Genetic Analysis of Milk Production Traits in the Different Parities of Ethiopian Jersey Dairy Cows
*Corresponding Author(s):
Kefale GetahunEthiopian Institute Of Agricultural Research, Holetta Research Center, Ethiopia
Email:kefalegetahun@gmail.com
Abstract
The objectives of this study were to estimate genetic and phenotypic parameters (variances, heritabilities and correlations) of milk production traits in the five consecutive parities. The studied traits were lactation milk yield and lactation length. The number of records were approximately 1004 and 1019, 811 and 825, 517 and 532, 380 and 387 and, 269 and 270 in the first, second, third, fourth and fifth parities for lactation milk yield and lactation length traits, respectively. Multivariate animal model that included year and season as fixed effects and animal and error as random effects were applied. There were larger residual variances observed across parities in both lactation milk yield and lactation length traits. The residual variances also increased in advanced parities for both traits. Heritabilities across parities for lactation milk yield were in the range of 0.07 to 0.27. The estimated heritabilities in the five parities for lactation length were 0.07, 0.18, 0.14, 0.5 and 0.07, respectively. Heritabilities across parities for both traits are different and lower around the first parities but increased at later parities.Genetic and phenotypic correlations among parities for lactation milk yield were varied from 0.45 to 0.95 and 0.26 to 0.53, and they were all positive, respectively shows that different parities of lactation milk yield can be shared medium to large extent of common genes and phenotypic values. Estimated genetic correlations among parities for lactation length were in the extreme range of (-0.71 to 0.98) values. Phenotypic correlations of lactation length among parities were all positive values but lower in the range 0.01 to 0.31 which shows little association of phenotypic measurements among parities. The present estimations were inconsistent with majority of earlier studies which might be associated with differences in observed data set, breed, environmental factors and modeling and statistical procedures followed.
Keywords
Genetic correlation; Heritability; Parity; Variance
Introduction
Genetic and environmental factors contribute to the formation of a phenotype. The amount of contributions of each factor depends on the genetic architecture of the trait, the environment in which an individual exposed, and the lifetime of animals [1, 2]. Milk yield or milk production is a quantitative trait governed by many genes with complex pathways. As difference genes are expressed in different lactation, the amount of lifetime milk produced per female is influenced by the lactation numbers. Milk yield tends to increase gradually from lactation one until reach its peak at around the fourth or fifth lactation[3]. The increase occurred alongside the physiological change (development and the size of the udder started from the first lactation) and good management (disease control, feed and water available) of cows. To increase milk production, it is essential to improve environmental conditions and genetic quality. Improvement of performance through selection is mainly dependent upon the effective use of additive genetic variation and accurate estimation of genetic parameters for the traits to be selected. Thus, knowledge of genetic and environmental factors for each lactation number are essential to obtain correct estimation and for developing a suitable selection or culling criterion. Many countries use first lactation performance for genetic evaluation because of bulk knowledge about genetic parameters for many dairy traits are concentrated on the first lactation [4] and assumed that the same genes influence first and later lactation yields. considering that first lactation can provide adequate information about late lactation [5]. Furthermore, first lactation is an ideal evaluations system to select bulls based on their daughter performances [6, 7]. However, research on the basis of first lactation milk yield or less could not provide complete information because the physiological status of cows’are changed considerably after first calving [8]. Thus, records of second and later lactations provide more complete information on lifetime performance than those from first lactation only [9] and increase accuracy of estimation, but not large for sire evaluation [5]. As a trait which is expressed repeatedly in animals’ life, the milk production performance is affected by genetic and environmental factors. Genetic and phenotypic parameters of a trait measured in different parities are essential to know the true heritability and relationship in different parities in different periods and used for management decision in every complete lactation stages.Previous genetic analysis of milk production and lactation length traits in Jersey dairy cows at Adea Berga subdairy research farm, Ethiopia was included >6 parities with extended lactation records (milk records more than 305 days). such genetic evaluation system (including different lactations as repeated measures of the same trait) assuming that different lactations are influenced by the same set of genes and environments i.e, common genetic and permanent environmental effect [10]. However, the fact is beyond the assumption and for accurate evaluation of milk yield and lactation length, parity should be treated as a different trait, but correlated traits in a multiple-lactation analysis [7]. No studies were found in the literature regarding variance and genetic parameter estimation (heritability and correlation) considering different parities as different trait for Jersey cows in Ethiopia. Therefore, the aim of this study was to estimate variances, heritability, and correlations among parities of lactation milk yield and lactation length traits.
Materials and Methods
- Study location and data source
Retrospective data of lactation milk yield and lactation length with a completed lactation records through five consecutive parities in pure Jersey cows calved from 1986 to 2019obtained from central Ethiopia, Adea Berga sub dairy research farm was used for genetic parameter analysis. This farm was founded in 1986 by introducing 400 pregnant pure Jersey heifers and 2 bulls from Denmark. Earlier authors [11] extensively discussed the geographical location, description of the farm, herd management and breeding program of the research farm.
- Data collection and management
- Pedigree information regarding ID number of animal, sire and dam, birth date, calving dates, lactation end date and parities were obtained from individual animal record sheets from pure Jersey genetic improvement research farm. The traits used for the study were production traits (lactation milk yield and lactation length). First, second, third, fourth and fifth parities of lactation milk yield and lactation length are considered as different traits. Prior to analysis, incomplete records were deleted/edited according to the following criteria 1. Lactation which was still in progress were removed (Table 1).
- Lactation length less than 100 days were deleted
- Data with unknown sire and dam (animals with unknown pedigree were pruned)
- Abortion and stillbirth data were removed
- Apparent errors associated with animal birth date, calving date, lactation end datewere edited
|
|
Observed data in different parities |
||||
|
Parity 1 |
Parity 2 |
Parity 3 |
Parity 4 |
Parity 5 |
|
|
Number of records (animals) for milk yield |
1004 |
811 |
517 |
380 |
269 |
|
Average milk yield |
2028.3 |
2259.2 |
2023.4 |
2160.5 |
2445.3 |
|
Number of records (animals) for lactation length |
1019 |
825 |
532 |
387 |
270 |
|
Average lactation length |
364.6 |
338.8 |
354.4 |
344.8 |
392.8 |
Table 1: Number of records of lactation milk yield and lactation length in the five consecutive parities.
Statistical Analysis
Multi-trait analyses of correlated traits utilize information from all traits to obtain estimates for a specific trait and provide accurate estimates of genetic parameters than a single-trait genetic evaluation [12]. Moreover, multiple trait analysis is the only way to obtain unbiased estimates for a trait, which is observed only on animals selected based on values of a correlated trait [13, 14]. In support of these ideas, multi-trait analysis of an animal model was used for estimation of(co) variance components and the resulting genetic parameters (heritabilities, genetic and environmental correlations) of lactation milk yield and lactation length across five parities with AI-REML algorithm of the WOMBAT software [15].Each parity was considered as different traits foranalysis of milk yield and lactation length in the genetic evaluation. Year and season were identified as fixed effects and analyzed by [16] to determine the level of significance. The preliminary analysis showed that year was the only significant source of variation in all parities and fitted in to genetic parameter analysis. Additive genetic and residual effects were assumed as random effects. The animal model for analysis of genetic and phenotypic co (variances)among parities were described as follows (Table 2).
Yi = Xibi+ Ziai + ei
For i= 1, 2, 3, 4, 5 representing the ithparity
Yi, is the vector of observations(lactation milk yield and lactation length) on the ithparity;
bi, includes vector of fixed effects (year in this case) on the ithparity;
ai, is random direct animal (additive) genetic effects on the ithparity;
ei, is the vector of random residual effects on the ithparity; and
Xi and Zi are matrices of the fixed and random animal (additive) genetic effects on the ithparity, respectively.
Genetic and phenotypic correlations were calculated by using the following formulas;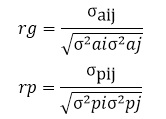
Where,
:geneticcorrelations,
:phenotypiccorrelations
: additive genetic covariance between parity i andj of milk yield or lactation length trait,
: phenotypiccovariancebetweenparityiand j of milk yield or lactation length trait,
: additive genetic variance for parityi of milk yield or lactation length trait,
additive genetic variance for parity j of milk yield or lactation length trait,
phenotypicvariancefor parityi of milk yield or lactation length trait,
Phenotypic variance for parityj of milk yield or lactation length trait.
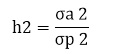
Heritability is the proportion of additive genetic variance to total phenotypic variance and calculated as the following formula;
|
Pedigree of animals |
Lactation milk yield |
Lactation length |
|
Original number of animals |
1572 |
1579 |
|
Number of animals after pruning |
1192 |
1199 |
|
Number of animals w/out offspring |
619 |
622 |
|
Number of animals with offspring |
573 |
577 |
|
Number of animals with unknown sire |
313 |
313 |
|
Number of animals with unknown dam |
501 |
501 |
|
Number of animals with both parents’ unknown |
258 |
258 |
|
Number of sires with progeny in the data |
99 |
99 |
|
Number of dams with progeny in the data |
474 |
478 |
|
Number of animals with paternal grandsire |
0 |
0 |
|
Number of animals paternal granddam |
0 |
0 |
|
Number of animals maternal grandsire |
579 |
585 |
|
Number of animals maternal granddam |
500 |
506 |
Table 2: Pedigree structure of lactation milk yield and lactation length for genetic analysis across five parities.
Results And Discussions
The lactation performance of both traits and fixed effects of various factors (each parity also as a fixed effect) were studied using analysis of variance and published earlier [11-17]. No further discussion is needed about Table 1. As described in the objectives, the aims of this study were evaluation of heritabilities and correlations among parities of lactation milk yield and lactation length traits.
- Variances and heritability
The heritabilities and variances (additive, residual as well as phenotypic) estimates for lactation milk yield across parities are presented in (Table 3). The additive genetic variances were increased slightly to second parity then reduced at third parity. The additive genetic variance of lactation milk yield in Jersey cows at fifth parity was highest (282818 kg2) followed by fourth parity (154123 kg2). The residual/error variances increased steadily with advanced parities. Residual variances were larger than additive genetic variance for all parities on lactation milk yield indicating that both known and unknown environmental effects were higher impact on the variation of milk yield across parities. Authors [6] suggested that the increases in error variances in later lactations may be attributed to additional sources of variation, such as dry periods, which do not influence the first lactation.The existence of prolonged dry or open period, repeat breeder of cows, udder health like mastitis might be partially accounts for the increase of residual variances. Later lactation could have a higher error variance partly because of preferential treatment [18]. Estimated heritabilities of lactation milk yield across parities were0.09, 0.14, 0.08, 0.25and 0.27for first, second, third, fourth and fifth parities which were lower compared to the study by [19]. Higher mean heritability estimates of 0.33, 0.33 and 0.34 for lactation milk yield of first, second and third lactations [20]. Majority studies evaluated heritability of first lactation milk yield and reported higher estimate compared to the present result [21, 22]. Heritability estimates in fourth and fifth parities were greater than those of first, second and third parity. This might be the full adaptation of cows in reproductive, physiology and milking environment in the latter lactations. Furthermore, sufficient additive genetic variances were observed in the later (fourth and fifth) lactations. These were similar trends with milk yield over different lactations. Milk yield normally increased from the first to some subsequent lactations. The genotype structure in the population affects the estimated heritability values among lactation numbers. Moreover, the set and functions of genes and the considerable role of environments especially the respond of both interactions in different parities might be determined the heritability differences. Heritability (performance) of lactation milk yield during different parities were the result of different sets of genes and different environmental factors [19]. Nevertheless, genetic evaluations (selection or culling) of cows should be done in the latter lactation when cows are fully adopted to the milking environment which assisted to exploit their genetic potential. In the early lactations (parities), cows would be subjected to different environmental stresses (especially lactation and physiological stresses) which reduces full genetic exploitation of cows. This study showed that genetic selection to improve and increase of milk yield was better in the fourth and fifth lactation (parities) than those of the early lactation number (parity). Even though, early (first) lactation performance was good indicator that allow the breeder to forecast the subsequent lactation performance of cattle as it is highly correlated with future performance [23], reduce selection interval [22] and used as selection standards [24]. The present heritabilities of the first three parities were close to similar values except slight increment from third to fifth lactations. Nuzul et al. (2019) [19] reported increasing trend but higher heritability of milk yield across parities. Authors in the world reported different results of heritabilities across parities. According to the reports of [25] and [26] heritability estimates may increase with production level and phenotypic variance. Many authors reported heritability decrease with advanced lactation [5, 6,9, 27, 28, 29]. The estimation differences of this study to other authors might be the environment, the breed to be evaluated and or the estimation procedures are often subjected to bias the results. Earlier study by [30] traits after first lactation (in the second, third or fourth parity) are almost equally heritable. The present heritability in the third parity was four times lower than that of fifth parity. The proportion of residual variance was higher than the additive genetic variance at parity three which were decreased the heritability value at this stage of lactation. Component of the residual variances includes the whole of the factors not yet considered, which they are of genetic origin (nonadditive genetic effects) or related to the environment (factor not identified such as the productive state of the animal). Number of data obtained and pedigree structure of the animals in each lactation number would be other factors of differences in the heritability and variance components among parities. For example, the number of records in the third and fifth parity were1.9 and 3.7 times decreased than the first parity (Table 1).Data errors which leads to missing pedigree information and incorrectly assigned relationships can cause larger bias in estimates of heritability and variance components [31]. Other authors [32] found low heritability influenced by the weak structure of the pedigree information. On the other hand, [33] stated that animals with no records which are connected in the pedigree do not add any information (Table 3).
|
Parameters |
Number of parities (assumed as traits) |
||||
|
Parity 1 |
Parity 2 |
Parity 3 |
Parity 4 |
Parity 5 |
|
| σa2 |
38235.1 ±0.0 |
74206.2 ± 0.0 |
47706.8 ± 0.0 |
154123 ± 0.0 |
282818 ± 0.0 |
| σe2 |
418,937 ± 0.0 |
512,246 ± 0.0 |
656,188 ± 0.0 |
611,057 ± 0.0 |
759248 ± 0.0 |
| σp2 |
457172 ± 0.0 |
586452 ± 0.0 |
703895 ± 0.0 |
765181 ± 0.0 |
1042070 ± 0 |
|
h2 |
0.09 ± 0.0 |
0.14 ± 0.0 |
0.08 ± 0.0 |
0.25 ± 0.0 |
0.27 ± 0.0 |
Table 3: Heritabilities and variances of lactation milk yield in different parities.
σa2=additive genetic variance, σe2= residual variance, σp2=phenotypic variance, h2=heritability
Estimates of variances and heritabilitiesof lactation length in parity one through parity five in Jersey cows are presented in (Table 4). The additive genetic variances of lactation length were increased steadily and found highest at fourth parity (5360 days2). The residual variances were remained the same for first and second parities and the largest difference occurred in the third and fifth parities. The heritabilities of lactation length were variable results across parities. It was similar at the first and fifth parities (0.07). However, the value was greater at the fourth parity followed by second and third parity (0.5, 0.18 and 0.14), respectively. The greater estimate was caused by high genetic variance observed at fourth parity.
|
Parameters |
Traits estimated from multi trait analysis (LL) |
||||
|
Parity 1 |
Parity 2 |
Parity 3 |
Parity 4 |
Parity 5 |
|
| σa2 |
840.6 ± 635.7 |
2014.6 ±1035.2 |
2198 ± 1984.3 |
5360 ± 2351.4 |
1204 ± 2214 |
| σe2 |
11532.4 ±50.2 |
11179.3 ± 1058 |
15740.3 ±1979 |
10559.7 ± 0.0 |
15328.8 ± 25 |
| σp2 |
12373 ±566.7 |
13194 ± 680 |
17938 ± 1188 |
15919.7 ± 1288.6 |
16532.8 ±1585 |
|
h2 |
0.07 ± 0.05 |
0.18 ± 0.08 |
0.14 ± 0.11 |
0.5 ± 0.14 |
0.07 ± 0.13 |
Table 4: Heritabilities and variances of lactation length in different parities.
σa2=additive genetic variance, σe2= residual variance, σp2=phenotypic variance, h2=heritability
- Genetic and phenotypic correlations
There are reasonable differences on genetic and phenotypic correlations of lactation milk yield across parities. Genetic correlations were medium to high. Genetic correlations among the first and subsequent lactation of milk yields in Jersey cows were 0.54, 0.95, 0.45 and 0.87, respectively. According to the reports by (Tong et al., 1979; Meyer, 1984; Swalve and Van Vleck, 1987) estimation of genetic correlations in the subsequent parities were similar and greater than 0.8. The present results were statistically varied across parity and different from the above authors. As showed below in (Table 5), genetic correlation between first and third, first and fifth and, third and fifth parities were strong and higher than other parities (≥0.8). The higher and positive genetic correlations (≥8) among parities showed that different lactations were controlled by more or less the same set of genes. Authors in the world reported that milk production of dairy cattle in all lactations is essentially the same trait genetically [6, 34, 35]. On the other hand, various authors justified that milk yield traits for first and later lactations cannot be consider the same trait, unless genetic correlations are indeed equal to 1 [5, 28, 36, 37]. Therefore, the present genetic correlations of lactation milk yield among parities were not unity or equal to one. Selection of animals for milk production would be largely effective only highly correlated parities. The phenotypic correlations varied, on average from 0.26 to 0.53. In general low to medium values and lower than the corresponding genetic values. However, all correlations were positive and favorable.
|
|
Correlation analysisof lactation milk yield in different parities |
||||
|
Parity 1 |
Parity 2 |
Parity 3 |
Parity 4 |
Parity 5 |
|
|
Parity 1 |
|
0.54 ± 0.0 |
0.95 ± 0.0 |
0.45 ± 0.0 |
0.87 ± 0.0 |
|
Parity 2 |
0.31 ± 0.0 |
|
0.68 ± 0.0 |
0.53 ± 0.0 |
0.63 ± 0.0 |
|
Parity 3 |
0.26 ± 0.0 |
0.39 ± 0.0 |
|
0.58 ± 0.0 |
0.79 ± 0.0 |
|
Parity 4 |
0.29 ± 0.0 |
0.33 ± 0.0 |
0.29 ± 0.0 |
|
0.64 ± 0.0 |
|
Parity 5 |
0.33 ± 0.0 |
0.48 ± 0.0 |
0.36 ± 0.0 |
0.53 ± 0.0 |
|
Table 5: Genetic correlations (above diagonal) and phenotypic correlations (below diagonal) of lactation milk yield in the five consecutive lactation numbers (parities)
Genetic and phenotypic correlations of lactation length in different parities are summarized in (Table 6). Genetic correlations were found to be in the range of extreme values from negative (-0.71) to positive (0.98). There were positive but lower genetic correlations between parity one and two, two and three and, became negative relationship after parity three. The present result was lower than from [38] who found positive (0.35 to 0.53) correlations in the three consecutive parities of lactation length in Holstein breed. Genetic correlations of lactation length among parities were decreases as lactation distance increases. This showed that the influence of the same gene in the first, second or third parity could not control the later parities. Another set of genes would be greater influence in the advanced parities of lactation length. Thus, genetic correlations in the first or second parity cannot be used as a strong indicator of the later parities and genetic evaluation of lactation length in different parities should not be treated as the same repeated trait. Evaluation of different parities treated as a separate trait would be support accurate evaluation of genetic parameters of lactation length. On the other hand, phenotypic correlations of lactation length among parities were all positive values but lower in the range 0.01 to 0.31 which shows little association of phenotypic measurements among parities. This lower range was corresponded with those reported by [38].
|
|
Correlation analysis of lactation lengthin different parities |
||||
|
Parity 1 |
Parity 2 |
Parity 3 |
Parity 4 |
Parity 5 |
|
|
Parity 1 |
|
0.101±0.44 |
0.98 ± 0.7 |
-0.57 ± 0.44 |
-0.23 ± 0.93 |
|
Parity 2 |
0.01 0.04 |
|
0.1 ± 0.48 |
0.14 ± 0.34 |
-0.10 ±0.76 |
|
Parity 3 |
0.08 ± 0.05 |
0.27 ± 0.05 |
|
-0.71 ± 0.46 |
-0.08 ± 0.96 |
|
Parity 4 |
0.07 ± 0.06 |
0.17 ± 0.06 |
0.03 ± 0.07 |
|
-0.41 ± 0.79 |
|
Parity 5 |
0.07 ± 0.07 |
0.31 ± 0.07 |
0.15 ± 0.08 |
0.31 ± 0.07 |
|
Table 6: Genetic correlations (above diagonal) and phenotypic correlations (below diagonal) of lactation lengthin the five consecutive lactation numbers (parities)
Conclusion
Genetic and phenotypic variances were not the same for the five parities of lactation milk yield and lactation length traits. This would be the result of pleotropic effect of different genes interacts with different environments during different lactations. Heritabilities were varied across parities for both traits and increased as advanced parities which were inconsistent results compared to many authors. Genetic correlations of lactation milk yield for the five consecutive parities were positive values from medium to high indicating the presence of genetic variability and the likelihood to improve the milk yield traits of Jersey cattle in Ethiopia by way of selection is promising. Presence of low phenotypic association across parities were also shows different lactations are more or less influenced by different gene and environment in combination. The present estimates of genetic parameters considering all parities as the same trait would be decreases genetic improvement by introducing errors in the selection of animals. Therefore, multitrait analysis considering milk yield and lactation length in different parities as different traits for genetic evaluation should be done because considering different variances across parities would be reduce errors and increase accuracy.
Acknowledgement
The author is grateful to Adea Berga dairy research staff in their contribution of raw data supply.
Funding
The author declares no fund or finance received from any organization for doing this study.
Conflict of interest
No potential conflict of interest is reported regarding the subject matter of this manuscript.
References
- Falconer DS, Mackay TFC (1996) Introduction to Quantitative Genetics. 4th/Ed. Longman group, England 480.
- Bourdon RM (2000) Understanding animal breeding. 2nd Upper Saddle River, New Jersey 07458, USA. 538.
- Ray DE, Halbach TJ, Armstrong DV (1992) Season and Lactation Number Effects on Milk Production and Reproduction of Dairy Cattle in Arizona1. Journal of Dairy Science 75: 2976-2983.
- Roxstrm A, Strandberg E, Berglund B, Ulf Emanuelson, Philipsson J (2001) Genetic and Environmental Correlations Among Female Fertility Traits and Milk Production in Different Parities of Swedish Red and White Dairy Cattle. Acta Agriculturae Scandinavica, Section A. Animal Science 51: 7-14.
- Albuquerque LG, Keown JF, Van Vleck LD (1996) Genetic parameters of milk, fat and protein yields in the first three lactations using an animal model and restricted maximum likelihood. Brazilian Journal of Genetics 19 : 79-86.
- Tong AKW, Kennedy BW, Moxley JE (1979) Heritabilities and Genetic Correlations for the First Three Lactations from Records Subject to Culling. Journal of Dairy Science 62: 1784-1790.
- Meseret S, Negussie E (2017) Genetic parameters for test-day milk yield in tropical Holstein Friesian cattle fitting a multiple-lactation random regression animal model. South African Journal of Animal Science 47.
- Wiltbank M, Lopez H, Sartori R, Sangsritavong S, Gumen A (2006) Changes in reproductive physiology of lactating dairy cows due to elevated steroid metabolism. Theriogenology 65: 17-29.
- Powell RL, Norman HD (1981) Different lactations for estimating genetic merit of dairy cows. Journal of Dairy Science 64: 321- 330.
- Gebreyohannes G, Koonawootrittriron S, Elzo MA, Suwanasopee T (2012) Fitness of lactation curve functions to daily and test-day milk data in an Ethiopian dairy cattle population. Annual meeting abstracts, poster presentation. Journal of Animal Science 90: 15-20.
- Hunde D, Mészáros G, Dessie T, Assefa G, Tadesse M, et al. (2015) Milk yield and reproductive performance of pure Jersey dairy cattle in the Central Highlands of Ethiopia, Livestock Research for Rural Development 27.
- Meyer K (1991) Estimating variances and covariances for multivariate animal models by restricted maximum likelihood. Genetic Selection Evolution 23: 62-83.
- Thompson R, Meyer KA (1986) Review of theoretical aspects in the estimation of breeding values for multi-trait selection. Livestock Production Science 15:299-313.
- Van der Werf J (2003) Mixed Models for Genetic Analysis. University of New England Armidale, NSW Australia
- Meyer K (2007) WOMBAT – A tool for mixed model analyses in quantitative genetics by REML, Journal of Zhejiang University Science B 8: 815-821.
- SAS (Statistical Analysis System) (2004) SAS User Guide version 9. SAS, INC, Cary, NC, USA.
- Beneberu N, Shibabaw W, Getahun K, Alemayehu K (2022) Milk Productive Performances of Pure Jersey Dairy Cattle at Adea-Berga Dairy Research Center, Central Highland of Ethiopia. International Journal of Genetics and Genomics 10 : 1-6.
- Jones LP, Godard ME (1990) Five years’ experience with the animal model for dairy evaluations in Australia. Proc. 4th world congress Genetics Applied to Livestock Production 8: 382.
- Widyas N, Mahfudhoh N, Subiakti, SigitPrastowo (2019) Genetic parameters of milk yield from three consecutive lactation periods of imported Holstein cows. International Conference on Science and Applied Science.
- Swalve H, Van Vleck LD (1987) Estimation of genetic covariances for milk yield in first three lactations using an animal model and restricted maximum likelihood. Journal of Dairy Science 70: 842-849.
- Sunil K, Dalal DS, Pander BL, Patil CS (2016) Genetic evaluation of crossbred cattle for production traits. Haryana veterinary 55: 137-140.
- Sahin A, Ulutas Z, Adkinson AY, Adkinson RW (2014) Genetic parameters of first lactation milk yield and fertility traits in Brown Swiss cattle. Annals of Animal Science, 14 : 545-557.
- Jairath LK, Hayes JF, Cue RI (1995) Correlation between first lactation and lifetime performance traits of Canadian Holsteins. Journal of Dairy Science 78: 438 - 448.
- Da Y, Grossman M, Mistza I, Wiggans GR (1992) Estimation of genetic parameters for somatic cell score in Holsteins. Journal of Dairy Science 75: 2265-2271.
- De Veer JC, Van Vleck LD (1987) Genetic parameters for first lactation milk yields at three levels of herd population. Journal of Dairy Science 70: 1434-1441.
- Boldman KG, Freeman AE (1990) Adjustment for heterogeneity of variances by herd production level in dairy cows and sire evaluation. Journal of Dairy Science 73: 503-512.
- Weller J (1986) Comparison of multitrait and single trait multiple parity evaluations by Monte Carlo simulation. Journal of Dairy Science 69: 493.
- Visscher PM, Thompson R (1992) Univariate and multivariate parameter estimates for milk production traits using an animal model. I description and results of REML analysis. Genetics Selection Evolution 24: 415-429.
- Shokri-Sangari F, Atashi H, Dadpasand M, Saghanejad F (2019) Genetic parameters for milk yield and lactation persistency in the three first parities of Iranian Holstein cows. Rev Colomb Cienc Pec 32: 100-106.
- Molinuevo HA, Lush JL (1965) Reliability of first, second and third records for estimating the breeding value of dairy cows. Journal of Dairy Science 47: 890.
- Thomas SC, Pemberton JM, Hill WG (2000) Estimating variance components in natural populations using inferred relationships. Heredity 84: 427- 436.
- Urioste JI, Rekaya R, Gianola D, Fikse WF, Weigel KA (2003) Model comparison for genetic evaluation of milk yield in Uruguayan Holsteins. Livestock Production Science 84: 63-73.
- Meyer K (2003)Secateurs to prune your pedigrees. Animal Genetics and Breeding Unit, University of New England, Armidale, NSW 2351, Australia.
- Meyer K (1984) Estimates of genetic parameters for milk and fat yield for the first three lactations in British Friesian cows. Animal Production 38: 313-322.
- Bagnicka E, Dist O, Harmann H, Lukaszewicz M (2004) Heritabilities and genetic correlations between the dairy traits in goats estimated in first and later lactations. Animal Science Papers and Reports 22: 205-213.
- Maijala K, Hanna A (1974) Reliable phenotypic and genetic parameters in dairy cattle. In proceeding of the 1st world congress on genetics applied to livestock production 1: 541-563.
- Bonas G, Shook GE (1990) Genotype by environmental interaction and genetic correlations among parities for somatic cell count and milk yield. Journal of Dairy Science 3: 2563-2573.
- Hossein-Zadeh NG (2012) Genetic parameters and trends for lactation length in the first three lactations of Holstein cows. Archiv Tierzucht 55: 533-539.
Citation: Getahun K (2023) Genetic Analysis of Milk Production Traits in the Different Parities of Ethiopian Jersey Dairy Cows. J Anim Res Vet Sci 7: 054.
Copyright: © 2023 Kefale Getahun, et al. This is an open-access article distributed under the terms of the Creative Commons Attribution License, which permits unrestricted use, distribution, and reproduction in any medium, provided the original author and source are credited.