Geochemistry, Petrogenesis and Tectonic Setting of the Mafic Dykes from the Amgaon and Khairagarh Regions, Bastar Craton, Central Indian Shield: Constraints on the Precambrian Crustal Evolution
*Corresponding Author(s):
Hiredya ChauhanInter University Accelerator Centre, New Delhi-110067, India
Email:pradyumanah@gmail.com
Abstract
The Bastar Craton of the southern part of Central Indian shield is endowed with the presence of magmatic rocks in form of mafic magmatism (dominantly dykes, dyke swarms and sills) in the areas where they are exposed along with the basement rocks (Amgaon and Tirodi gneissic complex). The equivalent volcanic rocks occur in the supracrustal belts, where the magmatic rocks are intercalated with sedimentary rocks, as observed for example in the Sakoli and Khairagarh supracrustal belts. The studied dyke samples show large variation from low silica to high silica variants, basaltic to andesitic/rhyolitic in composition. The low silica samples are subdivided into low silica group I and II based on their distinct evolutionary trends on various bi-elemental plots and the incompatible trace elements ratios, including those for the rare earth elements. The observed chemical variations indicate that these samples were derived from distinct and/or mixed mantle sources from different depths. These samples were derived by varying degrees of partial melting followed by dominantly clinopyroxene, amphibole, plagioclase and to some extent olivine fractionation. The multi-elements patterns and various discriminant diagrams indicate that the studied samples were generated in a subduction environment giving rise to arc magmatism. The presence of dominantly dykes, dyke swarms and sills along with the basement rocks indicate that the study area has undergone deep erosion exposing the basement rocks and these magmatic bodies (dykes, dyke swarms and sills) actually represent the plumbing system for the mantle derived melts, which contributed significantly to the Precambrian crustal evolution processes in the Central Indian shield.
Keywords
CITZ; Proterozoic Mafic Magmatism; Subduction
Introduction
Mafic magmatism is a major contributor for the evolution of the crust from the early earth to the present. The nature of the magmatism changed from more mafic (komatiitic) to more basaltic and andesitic variants [1-4]. In the early history of the earth mafic magmatic rocks have been preserved in the granite greenstone sequences and dykes/dyke swarms to more recent large igneous provinces (LIP). It is known that the early earth was hotter and therefore mafic magmatic activities were rampant and various estimates indicate that nearly 80% of the crust was formed during the Archaean [3,5]. It is observed that the mafic volcanic rocks were preserved in the greenstone belts or Precambrian continental rift basins [6,7], but in most of the cratons where the basement gneisses are exposed, we observe only the dykes and dyke swarms and no volcanic equivalents are observed because of severe erosion to the deeper levels exposing the basement rocks [8-12]. It is possible that during the early earth there were numerous LIPs and their equivalents were present but these got eroded with time [13-16]. Because of the availability of higher temperature, more magma was generated from the evolving mantle that contributed to the formation of the crust [17-19]. Mafic and ultramafic magmatism poured mafic magma on the oceanic floor via the divergent plate boundaries, but rocks on the ocean floor are not older than 200 My [5,20,21]. Thus, we have to focus our studies on the continental crust, which preserves the oldest rocks to younger rocks produced at the continental arc, rift basins and LIPs [2,5].The Bastar Craton has preserved enormous dykes, dyke swarms and even major sills emplaced at deeper levels and now exposed along with the basement rocks as the supra-crustal rocks have disappeared because of long term erosion [12, 22-26], although some of the supracrustal rocks including volcanic flows are preserved in the rift basins such as the Sakoli belt volcanics and Khairagarh supracrustal volcanics [22,27,28]. We present here new geochemical data (major, trace including rare earth elements (REE) on the mafic dykes from the Amgaon and Khairagarh regions of the Bastar Craton (Figure 1). We have also reviewed the published data on the mafic magmatic rocks (dykes, sills and flows) and compared these with our studied rocks to put better constraints on the Precambrian crustal evolution of the Bastar Craton.
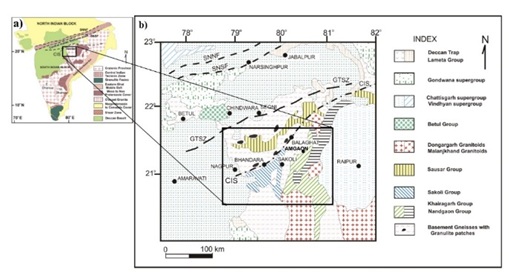 Figure 1 (a): Outline map of India showing the Central Indian Tectonic zone (CITZ) and mobile belts of the Indian shield. It is showing the study area marked as the Bastar Craton [29]. It is showing the study area marked as the Bastar Craton.
Figure 1 (b): Geological map of the part of Central Indian Shield (modified after [30,31]) showing the study area and the various lithologies.
Regional Geology
The Central Indian Bastar Craton essentially comprises Archaean granitoid basement, with multiple supracrustal and volcanic sequences. The diverse lithological assemblages of Bastar Craton are made up of basement gneisses, namely, Tirodi, Amgaon, Bengpal, and Sukma gneisses, these gneisses have components of Tonalite-trondhjemite-granodiorite (TTG) and melts of diverse compositions [15,32-37]. Supracrustal sequences of Bastar Craton are preserved in Sausar, Dongargarh, Sakoli, Khairagarh and Mahakoshal Supergroup, comprising sequences of metavolcanic and metasedimentary rocks [28,38-40]. Granulites from Balaghat-Bhandara and Ramakona-Katangi Ganulite belts associated with Central Indian Suture (CIS) zone [41,28] and Bhopalpatnam and Karimnagar granulite belts are exposed in Western Bastar [36,42-46]. Mafic dyke swarms of Bastar Craton include NWSE trending Keshkal swarm, Bhanupratappur swarm, Dantewara swarm, and Bastanar swarm, NNW-SSE trending Sonakhan swarm, N-S trending Lakhna dykes, ENE-WSW trending Bandimal dykes are well studied [11,22,42,47-57]. Dongargarh, Malanjkhand, Abhujmar and Mul granites represent the diverse Proterozoic granites from Bastar Craton [37,56,58-62].
Hazarika et al., (2020) have discussed the geochemistry of mafic dykes from Amgaon area, particularly from southern margin of central Indian suture (CIS), with those of northern Bastar Craton Lakhna (1.46 Ga) and Bandimal (1.42 Ga) dykes and inferred a widespread mafic magmatic event across the Bastar Craton circa.1.42–1.46 Ga. The dykes from Amgaon region represent a subduction related outgrowth of Columbia supercontinent due to the accretion of continental margins [55,56].
Hazarika, et al., (2019) identified mafic dykes of Boninitic compositions from Bastar Craton, earlier described by [63]. This boninite magmatism indicates the presence of remnant subduction-related signatures in the lithospheric mantle formed during the evolution of the Bastar Craton [56]. Dongargarh Supergroup records a significant portion of the evolutionary history of Bastar Craton. This supergroup comprises a sequence of metavolcanic and metasedimentary sequences of Nandgaon Group and Khairagarh Group overlying the basement of Amgaon gneisses. Nandgaon Group comprises of Bijli rhyolites and Pitepani volcanics, whereas Khairagarh Group comprises volcano sedimentary sequences [64,65]. The volcanic rocks of Khairagarh volcanic sequence are represented by variable Ti basalts [66] and basaltic andesite series that indicate partial melting of an enriched mantle source. The occurrence of the two contrasting sequences probably indicates generation in a hot Andean-type subduction zone for the High Magnesian Andesites (HMA) and Andean-type back-arc rifting for the basalt–basaltic andesite samples [28].
Present work is based on the geochemical study of Proterozoic mafic dykes from the Amgaon region, south of CIS and Khairagarh region of the Dongargarh Super group (Figure 1). These are doleritic dykes depict ophitic to sub-ophitic texture. Dominant mineralogy is plagioclases (andesine-labradorite) and pyroxene (dominantly augite) with minor olivine, opaques (magnetite-ilmenite), amphiboles and chlorite.
Geochemical Characteristics
Major and trace elements (Table 1) were determined using WD-XRF (Pan Analytical- Axios) at the Department of Geology, University of Delhi, India. The accuracy of the analyses for the major elements is better than 1% for SiO2 and 2% for other major elements, 2–5% for minor elements and better than 10% for trace elements. International rock standards used for calibrations are BHVO, JGB-1, JB-1A, JB-2, JB-3, JA-2, MB-H, AM-H, PM-S, GeoPT4 and GeoPT11 [28]. Some of the trace elements and the rare earth elements (REE: (Table-2) were analyzed by ICPMS (ELAN 6000 DRC-e, Perkin Elmer, Waltham, MA, USA) at the Indian Institute of Technology, Roorkee. Two USGS rock standards GSP-2 and AGVO-2 were used for calibration for the ICP-MS following the procedure described by [67].
Geochemical data on the studied dykes show groupings in terms of silica distribution, in the form of low and high silica groups (Table 1) (Figures 2 and 3). Majority of the samples fall in the low silica group where the SiO2 contents vary from 48.32 to 54.19 wt%. The high silica samples show SiO2 variation from 59.61 to 66.66 wt%, with a clear compositional gap. Al2O3 shows restricted distribution from 11.53 to 14.49 wt%. Fe2O3 shows large variation between 5.21 and 15.83 wt%. The high silica samples have restricted Fe2O3 between 5.21 and 8.61wt% and MgO varies between 3.98 and 9.87 wt%. The CaO contents for the low silica rocks varies between 6.76 and 11.58 wt% and for high silica rocks it is quite variable from 1.19 and 6.19 wt%. TiO2 contents are low for the high silica rocks (0.46-0.81 wt %) and not so different for the low silica rocks (0.9-1.47 wt %) (Figure 2). As expected Ni is lower in the high silica rocks (45-149 ppm) but much higher for the low silica rocks, mostly in te range from 100-200 ppm, but overall it varies from 85 to 468 ppm. Cr is quite variable from 95-~300 ppm for high silica but from nearly 300 to 930 ppm for the low silica rocks. Sc is lower for the high silica rocks (11-20 ppm) but higher for the low silica rock ranging from 24 to 50 ppm. As expected, Zr is much higher for the high silica rocks (225-492 ppm) compared to the low silica rocks having 72-314 ppm, mostly in the range of 72 to
|
Sample |
CP62 |
CP62A |
CP142 |
CP128 |
CP114 |
CP28 |
CP36 |
CP37 |
CP306 |
CP7 |
CP147 |
CP22 |
CP19 |
CP47 |
CP109 |
CP55 |
CP18 |
CP113 |
CP29 |
|
Major oxides (wt%) |
|
|
|||||||||||||||||
|
SiO2 |
52.47 |
51.04 |
48.46 |
53.07 |
54.17 |
54.19 |
52.36 |
50.2 |
50.98 |
48.32 |
50.67 |
51.5 |
49.79 |
50.97 |
60.25 |
59.61 |
60.33 |
59.9 |
66.66 |
|
Al2O3 |
13.69 |
12.8 |
14.62 |
13.89 |
14.14 |
13.84 |
12.56 |
12.94 |
12.3 |
11.53 |
12.27 |
13.24 |
12.97 |
13.2 |
13.65 |
14.49 |
16.1 |
12.12 |
13.04 |
|
TiO2 |
1.15 |
1.27 |
0.54 |
0.75 |
0.9 |
0.74 |
1.23 |
1.28 |
1.4 |
1 |
0.76 |
0.93 |
1.47 |
0.91 |
0.65 |
0.81 |
1.09 |
0.46 |
0.47 |
|
Fe2O3 |
12.88 |
14.18 |
10.38 |
11.35 |
10.89 |
11.43 |
14.23 |
13.51 |
15.83 |
13.51 |
10.85 |
11.63 |
11.05 |
11.32 |
6.91 |
8.61 |
7.16 |
11.34 |
5.21 |
|
MnO |
0.18 |
0.19 |
0.19 |
0.18 |
0.16 |
0.16 |
0.17 |
0.21 |
0.19 |
0.16 |
0.15 |
0.17 |
0.15 |
0.17 |
0.12 |
0.12 |
0.15 |
0.1 |
0.11 |
|
MgO |
6.55 |
6.43 |
7.51 |
6.32 |
6.94 |
6.74 |
6.47 |
5.92 |
6.45 |
9.87 |
9.22 |
7.78 |
8.6 |
8.09 |
7.56 |
6.38 |
4.26 |
8.64 |
3.98 |
|
CaO |
9.7 |
9.74 |
10.42 |
8.87 |
7.82 |
9.23 |
9.8 |
6.76 |
9.88 |
8.59 |
10.77 |
11.53 |
8.72 |
11.58 |
6.19 |
6.09 |
5.12 |
1.19 |
2.38 |
|
Na2O |
2.99 |
2.1 |
2.8 |
1.69 |
3.67 |
2.14 |
2.48 |
3.09 |
2.05 |
2.66 |
2.16 |
1.89 |
4.02 |
1.97 |
3.01 |
3.43 |
4.18 |
3.51 |
5.15 |
|
K2O |
2.18 |
1.49 |
1.93 |
1.76 |
1.34 |
1.39 |
1.61 |
1.85 |
0.42 |
1.67 |
0.77 |
0.48 |
1.15 |
0.67 |
2.68 |
1.85 |
2.03 |
0.79 |
3.43 |
|
P2O5 |
0.1 |
0.09 |
0.09 |
0.07 |
0.26 |
0.07 |
0.08 |
0.13 |
0.12 |
0.1 |
0.06 |
0.05 |
0.64 |
0.06 |
0.52 |
0.32 |
0.61 |
0 |
0.05 |
|
LOI |
0.1 |
0.64 |
2.93 |
1.78 |
0.82 |
0.72 |
0.8 |
3.32 |
1.79 |
2.71 |
2.59 |
0.79 |
1.38 |
0.98 |
0.32 |
0.26 |
0.32 |
2.79 |
1.04 |
|
Total |
101.99 |
99.97 |
99.87 |
99.73 |
101.11 |
100.7 |
101.79 |
99.21 |
101.41 |
100.1 |
100.27 |
99.99 |
99.94 |
99.92 |
101.86 |
102 |
101.35 |
100.84 |
101.52 |
|
Mg # |
50.18 |
47.31 |
58.9 |
52.44 |
55.79 |
53.87 |
47.38 |
46.46 |
44.66 |
59.13 |
62.73 |
56.99 |
60.65 |
58.6 |
68.42 |
59.47 |
54.09 |
60.14 |
60.2 |
|
Trace element (ppm) |
|
|
|||||||||||||||||
|
Cr |
161 |
149 |
296 |
103 |
320 |
93 |
401 |
440 |
147 |
932 |
557 |
555 |
352 |
557 |
242 |
329 |
97 |
208 |
194 |
|
Ni |
100 |
108 |
95 |
102 |
85 |
111 |
117 |
268 |
103 |
468 |
195 |
187 |
167 |
232 |
149 |
83 |
45 |
58 |
65 |
|
Co |
32 |
37 |
31 |
26 |
26 |
28 |
37 |
37 |
41 |
38 |
30 |
36 |
31 |
33 |
20 |
25 |
19 |
16 |
12 |
|
Sc |
44 |
45 |
34 |
46 |
26 |
43 |
31 |
24 |
50 |
27 |
37 |
46 |
23 |
43 |
13 |
20 |
11 |
16 |
13 |
|
Ga |
20 |
20 |
19 |
19 |
20 |
19 |
20 |
21 |
22 |
18 |
18 |
18 |
20 |
18 |
17 |
18 |
18 |
23 |
17 |
|
Rb |
94 |
67 |
96 |
109 |
60 |
108 |
59 |
45 |
44 |
64 |
55 |
43 |
68 |
59 |
101 |
104 |
254 |
59 |
151 |
|
Ba |
258 |
370 |
552 |
546 |
1131 |
377 |
246 |
277 |
71 |
217 |
159 |
118 |
379 |
253 |
1267 |
1039 |
1573 |
66 |
686 |
|
Sr |
152 |
135 |
442 |
153 |
404 |
293 |
251 |
173 |
122 |
218 |
117 |
120 |
185 |
134 |
732 |
701 |
529 |
11 |
128 |
|
Cu |
145 |
160 |
57 |
176 |
71 |
109 |
163 |
182 |
167 |
132 |
112 |
117 |
12 |
106 |
3 |
29 |
9 |
12 |
65 |
|
Zn |
84 |
94 |
106 |
85 |
130 |
78 |
127 |
96 |
87 |
114 |
85 |
79 |
131 |
96 |
130 |
80 |
136 |
240 |
60 |
|
Zr |
151 |
158 |
72 |
166 |
111 |
193 |
201 |
187 |
129 |
149 |
76 |
83 |
314 |
95 |
237 |
330 |
492 |
225 |
318 |
|
Y |
34 |
29 |
24 |
35 |
25 |
34 |
24 |
27 |
23 |
28 |
20 |
20 |
34 |
19 |
30 |
33 |
58 |
27 |
38 |
|
Pb |
1 |
2 |
3 |
2 |
3 |
4 |
1 |
4 |
2 |
1 |
2 |
1 |
8 |
2 |
11 |
7 |
10 |
25 |
17 |
|
Th |
7 |
7 |
6 |
7 |
4 |
8 |
4 |
4 |
6 |
5 |
6 |
8 |
1 |
6 |
7 |
10 |
4 |
2 |
6 |
|
Nb |
6 |
7 |
6 |
6 |
6 |
6 |
7 |
11 |
9 |
9 |
4 |
6 |
12 |
8 |
12 |
10 |
15 |
11 |
13 |
|
U |
3 |
1 |
3 |
3 |
2 |
4 |
1 |
1 |
1 |
2 |
1 |
1 |
2 |
1 |
4 |
4 |
9 |
2 |
4 |
|
V |
315 |
347 |
187 |
297 |
299 |
300 |
318 |
299 |
315 |
402 |
389 |
337 |
283 |
356 |
228 |
234 |
178 |
357 |
149 |
Table 1: Major (wt%) and trace element (ppm) analyses for representative mafic dykes from the Aamgaon and Khairagarh region. Samples are classified as: Low Silica Group-1 (CP62, CP62A, CP142, CP128, CP114, CP28, CP36, and CP37); Low Silica Group-2 (CP306, CP7, CP147, CP22, CP19, CP47); and High Silica (CP109, CP55, CP18, CP113, CP29). LOI, loss on ignition; magnesium number, Mg# = Cationic (Mg*100/Mg+Fe).
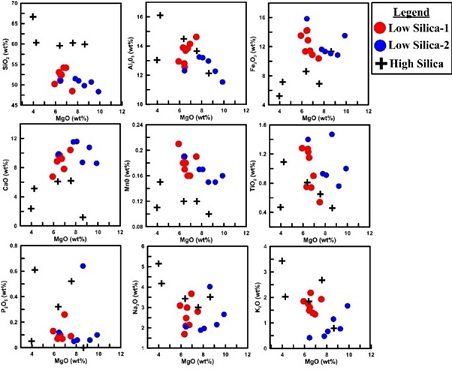 Figure 2: MgO versus major elements Binary plot of the studied rocks (Low Silica Group-1, Low Silica Group-2 and High Silica).
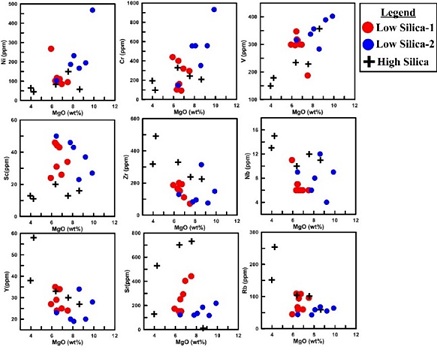 Figure 3: MgO versus trace elements Binary plot of the studied rocks (Low Silica Group-1, Low Silica Group-2 and High Silica).
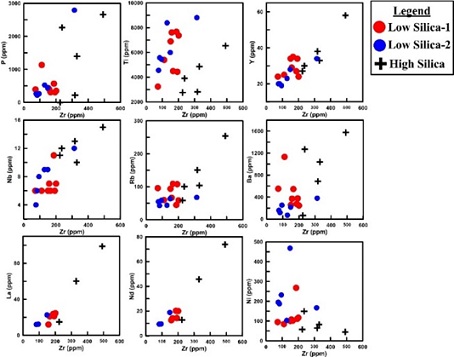 Figure 4: Zr versus trace elements Binary plot of the studied rocks (Low Silica Group-1, Low Silica Group-2 and High Silica).
|
Sample |
CP62A |
CP128 |
CP28 |
CP36 |
CP37 |
CP7 |
CP22 |
CP47 |
CP55 |
CP18 |
CP113 |
|
REE (ppm) |
|||||||||||
|
La |
12 |
21 |
21.2 |
24.6 |
23.6 |
22.6 |
12.1 |
12.4 |
60.2 |
98.9 |
14.9 |
|
Ce |
17.4 |
28.7 |
30.6 |
30.59 |
39.07 |
35.5 |
13.3 |
12.9 |
106.6 |
175.5 |
26.8 |
|
Nd |
12.63 |
14.27 |
14.38 |
20.02 |
20.22 |
18.88 |
9.45 |
9.6 |
45.68 |
73.8 |
12.82 |
|
Sm |
3.27 |
3.05 |
3.13 |
3.13 |
4.35 |
3.93 |
2.52 |
2.71 |
7.65 |
11.47 |
2.9 |
|
Eu |
1.15 |
0.79 |
0.84 |
1.33 |
1.26 |
1.18 |
0.85 |
0.86 |
1.91 |
3.02 |
0.68 |
|
Gd |
4.03 |
3.24 |
3.03 |
3.03 |
4.39 |
4.25 |
3.04 |
2.85 |
5.69 |
7.45 |
3.18 |
|
Dy |
4.8 |
3.43 |
3.41 |
3.41 |
4.4 |
4.22 |
3.28 |
3.25 |
3.99 |
4.36 |
2.54 |
|
Er |
2.39 |
1.82 |
1.74 |
1.83 |
1.9 |
1.88 |
1.82 |
1.72 |
1.68 |
1.6 |
1.98 |
|
Yb |
2.35 |
1.93 |
1.82 |
1.82 |
1.76 |
1.72 |
1.78 |
1.74 |
1.51 |
1.27 |
2.89 |
|
Lu |
0.27 |
0.26 |
0.26 |
0.26 |
0.23 |
0.27 |
0.25 |
0.26 |
0.22 |
0.22 |
0.42 |
Table 2: Rare Earth Element (ppm) analytical data for representative mafic dykes from the Aamgaon and Khairagarh region. Classification of samples are same as described in (Table-1).
In terms of the rare earth elements (REEs), the high silica are much more enriched compared to the low silica rocks. Whereas the high silica rocks have enrichment of LREE from ~250 to >400 times chondrite, the low silica rocks have LREE enrichment from ~50 to ~100 times chondrite (Fig. 5a: normalising values after Sun and Mc Donough, 1989). The (La/Sm)N, (La/Gd)N, (La/Yb)N and (Gd/Yb)N for the high silica rocks vary from 5.6 to 5.1, 11.58 to 9.07, 55.16 to 28.79 and 4.7 to 3.17 respectively.
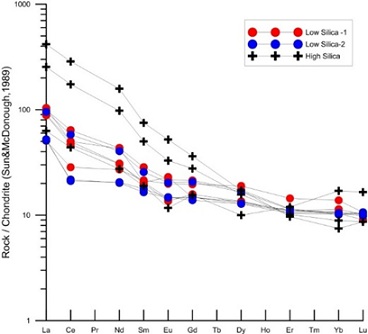 Figure 5a: Chondrite-normalized rare earth elements (REEs) plot shows enriched characteristics for the studied rocks. High Silica rocks shows higher abundances compared to Low Silica Group-1 and Low Silica Group-2 samples. Normalizing values are from [68].
For the low silica rocks, these ratios are 2.55 to 4.72, 2.68 to 6.99, 3.59 to 9.45 and 1.33 to 1.36 respectively. Thus, it is very clear that the high silica rocks have much higher LREE enrichment and much higher LREE/HREE ratios compared to the low silica rocks, probably indicating their derivation from different sources or these two rock types have undergone very different petrogenetic histories (Figure 5a). The multi-elements spidergram patterns for the studied samples show strong negative anomalies for Nb, P, Ti and equally strong positive anomalies for Pb and to some extent Zr (Figure 5b). Like the REE patterns (Figure 5a) the multi-element spidergram patterns show that the high silica samples have much higher abundances of incompatible trace elements compared to the low silica samples (Figure 5b).
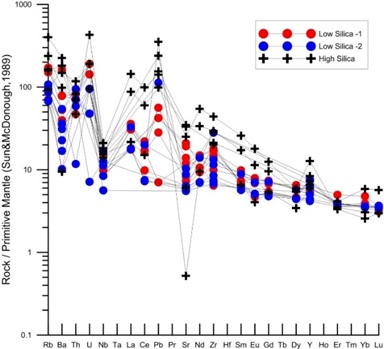 Figure 5b: Primitive mantle-normalized multi-element plot shows overall enriched pattern with strong negative anomalies for Nb, P, Ti and strong positive anomalies for Pb. Normalizing values are from [68].
Magma Types
Geochemically majority of the studied samples are basalt to basaltic-andesite composition, but a few samples with higher SiO2 classify as andesites based on TAS (Total Alkali vs Silica: [69,70] diagram (Figure 6a). The high SiO2 andesitic samples plot separately with a compositional gap. In terms of the trace elements ratios (Nb/Y vs Zr/TiO2: [71]) the studied samples again classify as sub-alkaline basalt to basaltic andesite and the high SiO2 samples classify as rhyodacite (Figure 6b). Like figure 6a the high silica samples plot separately with a compositional gap with higher Zr/Ti ratios (Figure 6b). For comparison we have considered published data on Proterozoic mafic magmatic rocks (dykes and flows) from the adjoining areas (Sakoli volcanics: [72], Amgaon Gneissic Complex basaltic and boninitic dykes [55,56], Amgaon Gneissic Complex amphibolitic and doleritic dykes [38] and Khairagarh volcanics [28]. Texturally and mineralogically they are similar to the mafic magmatic rocks of the adjoining areas, as described by the earlier workers [22,26,28,38,55,56,72-74]. Geochemically these mafic magmatic rocks from the adjoining areas depict subalkaline basalt-basaltic andesite to andesite-rhyolite as observed in our studied samples (Figures 6c and 6d), however, volcanics the samples from the adjoining regions depict much larger compositional variations, especially the Sakoli bi-modal, because they represent different tectonic [72].
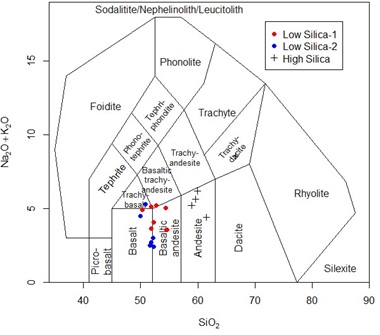 Figure 6a: SiO2 versus Na2O + K2O (TAS diagram) [69] shows majority of the studied samples (Low Silica Group-1 and Low Silica Group-2) are basalt to basaltic- andesite while High Silica samples classify as andesites.
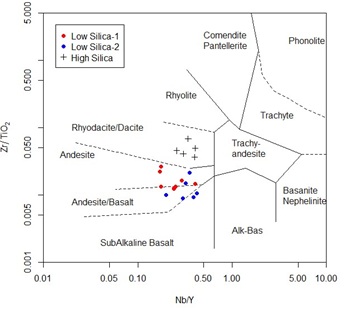 Figure 6b: Nb/Y versus Zr/TiO2 plot [75] shows studied samples (Low Silica-Group-1 and Low Silica Group-2) classified as sub-alkaline basalt to basaltic andesite while High Silica samples are classified as rhyodacite.
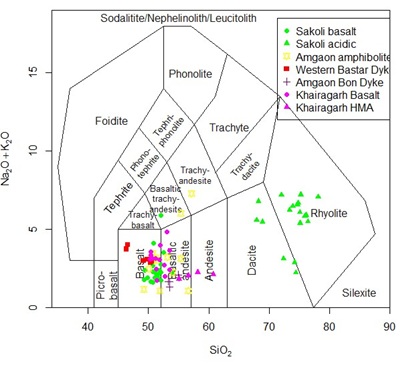 Figure 6c: SiO2 versus Na2O + K2O (TAS diagram) shows that mafic magmatic rocks from the adjoining areas represent basalt-basaltic andesite to andesite- rhyolite as observed in our studied samples.
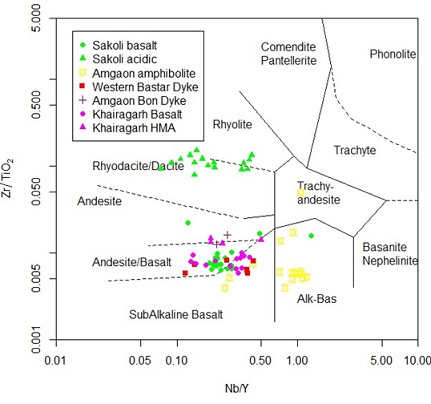 Figure 6d: Nb/Y versus Zr/TiO2 plot [75] of the mafic magmatic rocks from the adjoining areas depict alkaline basalt to sub-alkaline basalt, basaltic andesite to andesite and Rhyodacite as observed in our studied samples.
Petrogenesis
In a series of simple but informative bi-variant plots using MgO wt% and Zr ppm concentrations against other major and trace elements are presented here for the studied sample (Figures 2-4). These elements are used as indices of fractionation to understand the relationships between various elements during petrogenetic processes in basaltic magma. Zircon is least mobile trace element that does not get perturbed during the alteration and low grade metamorphism that these rocks have undergone and is essentially incompatible in basaltic systems [76]. In the MgO vs major elements plots (Figure 2), we observe at least three sub-trends, one for the high silica group and two sub-trends for the low silica basaltic rocks, probably indicating that all the studied rocks were not derived from the same parental melt, rather they represent independent magma batches or they represent heterogeneous sources (Figure 2). Most of the elements show negative trends against MgO except CaO which shows positive trends, probably indicating coprecipitation of olivine and clinopyroxene. Na2O and K2O show somewhat scattered trends, which could be partly related to alteration effect and partly source heterogeneity. The MgO vs compatible trace elements Ni, Cr, V and Sc show positive trends probably indicating coprecipitation of mafic phases (olivine, pyroxene, amphiboles) and MgO vs incompatible trace elements Zr, Nb, Y, Sr and Rb show negative trends, indicating little effects of alteration on these trace elements (Figure 3). To further assess the possibility of alteration on the studied rocks, we have plotted various trace elements against Zr, which is considered robust during alteration and low grade metamorphism, thus categorized as high field strength elements (HFSE). The plots of P, Ti, Y, Nb, Rb, Ba, La and Nd show positive trends and Ni shows the expected negative trend against Zr, indicating less perturbed nature of these trace elements (Figure 4).
The binary plots of MgO wt% and Zr ppm against compatible and incompatible trace elements indicate little effect of secondary alteration processes on the studied samples and depict sub-trends as observed in the MgO vs major elements (Figure 2), indicating source heterogeneity or their derivation from independent parental magma. The Zr and Ni concentration vary from less than 100 ppm to about 500 ppm Zr and from ~470 ppm to 45 ppm Ni in the studied samples (Figures 3 and 4). If all the samples were derived from the same or similar parental melt, then at least 80% fractional crystallization will be required but no such evidence is reflected in our petrographic studies. We observe for example wide range of concentrations for Al2O3 and CaO for a given MgO concentration, similarly we observe wide variation in the concentration of Ni and Cr for similar Zr levels, all these observations indicate that the studied samples were derived from different batches of primary magmas with different levels of MgO and Zr or these were derived from heterogeneous sources (Figures 2-4). The incompatible trace elements ratios for example Zr/Nb, Nb/La, Sm/Nd, Zr/La etc. do not change with moderate degrees of crystal fractionation but are quite sensitive to varying degrees of partial melting, source heterogeneity and to some extent crustal contamination. On the other hand, the ratios of compatible/incompatible trace elements e.g. Ni/Zr, Cr/Zr, V/Zr etc. are quite sensitive to fractional crystallization, our data indicate that the studied samples have undergone varying degrees of partial melting of heterogeneous sources, followed by varying extent of fractional crystallisation of gabbroic assemblages [7].
In the plot of Zr/Y vs Zr (ppm) the studied samples and those from the adjoining areas are plotted to understand their source characteristics, degrees of partial melting and evolutionary history of the parental melts to give rise to derivative melts through fractional crystallization in different combinations. These diagrams will also allow us to compare the studied samples with the adjoining areas to understand regional scenarios (Figures 7a and 7b). In this diagram (Figures 7a and 7b) two calculated partial melting curves are shown, after [76].
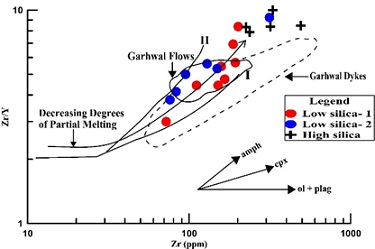 Figure 7a: Binary plots of Zr versus Zr/Y [78]. The two partial melting curves are after [76] and vectors for fractional crystallization. Our samples from the Low Silica Group-1 plot between the two melting curves, Low Silica Group-2 samples plot along the partial melting curve II and the High Silica samples plot at higher levels of Zr as well as Zr/Y ratios.
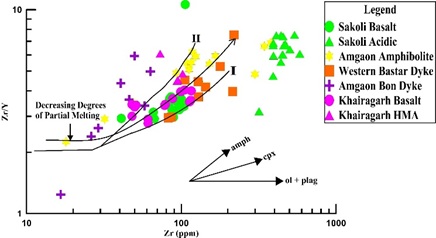 Figure 7b: Binary plots of Zr versus Zr/Y [78]. The two partial melting curves are after [76] and vectors for fractional crystallization. Samples from the adjoining areas i.e. from Sakoli mafic volcanics and Western Bastar dykes plot along the melting Curve I and the Sakoli acidic volcanics plot separately with much higher Zr.
The two melting curves correspond to two sets of mineralogy for the sources; curve I is calculated for sources with 60% olivine, 20% orthopyroxene, 10% clinopyroxene and 10% plagioclase; and curve II is calculated for sources with 60% olivine, 20% orthopyroxene, 10% clinopyroxene and 10% garnet for Archaean mantle sources [76,77]. The Zr/Y ratio for the melting curve II is higher because Y is held in garnet, thus on melting of such sources the resulting melt will have lower Y and therefore higher Zr/Y ratios, for curve I on the other hand, the Zr/Y ratio is higher as all the Y from the source region is released to the melt. Zr being incompatible for the basaltic system, its abundances are higher for lower degrees of partial melting and its abundances decrease in the derivative melts as the degrees of partial melting increases. Also shown in this diagram are the fractional crystallization curves for olivine + plagioclase, clinopyroxene and amphiboles. Fractionation of olivine + plagioclase does not affect the Zr/Y ratios although the Zr abundance increases in the derivative melts as the fractional crystallization processes proceed. The clinopyroxene and amphibole fractionation increase the Zr/Y ratios, more drastically for amphibole fractionation. Like the olivine + plagioclase fractionation, clinopyroxene and amphibole fractionation also causes increase in the Zr abundances as the latter is essentially incompatible for the basaltic system [7,75]. In (Figure 7a), the low silica group I samples plot between the two melting curves but more closer to the partial melting curve I, samples of the low silica group II plot along the partial melting curve II and the high silica samples plot at higher levels of Zr as well as Zr/Y ratios. Incidentally the studied high silica samples plot closer to the highly differentiated Garhwal dykes with similar Zr levels but the studied samples also have higher Zr/Y ratios. The low silica group I samples depict large variation in Zr abundances indicating their derivation from very low to higher degrees of partial melting at shallower levels compared to the low silica group II samples which probably got generated at deeper levels where garnet was stable in the source region. The low silica group I and high silica samples show increasing Zr/Y ratios with increasing Zr abundances, which probably indicate that these samples have undergone clinopyroxene + amphibole fractional crystallization. The Low silica group II probably represents higher degrees of partial melting which was followed by olivine + plagioclase fractionation, as the samples with higher Zr do not show any increase in the Zr/Y ratios as shown by the other groups (Figure 7a). Also the low silica group II plot is closer to the Garhwal flows which are shown to have undergone olivine + plagioclase fractionation of melts generated from sources from garnet stability field [7,79]. Samples from the adjoining areas particularly those from Sakoli mafic volcanics and Western Bastar dykes plot along the melting Curve I and the Sakoli acidic volcanics plot separately with much higher Zr, as seen in the case of highly differentiated Garhwal dykes (Figures 7a and 7b). The sample of the Amgaon amphibolites plot closer the melting curve II and the samples of the Khairagarh basalt plot along both the curves with majority of them plotting between the two melting curves. Samples of the high magnesian andesites (HMA) from Khairagarh and the Amgaon boninitic dykes plot closer to the melting curve II (Figure 7b). Some of the boninite samples plot much above the melting curve indicating that these samples have undergone extensive amphibole fractional crystallization, probably because of the presence of water, the same may be true for the studied high silica samples. The samples of the Amgaon amphibolite show large variation in Zr but no change in their Zr/Y ratios probably indicating that these samples have undergone olivine + plagioclase fractionation. All the other samples from the adjoining areas, probably have undergone dominantly clinopyroxene fractional crystallization [72,55].
Tectonic Settings
The multi-elements patterns of the studied samples depict enrichment of the incompatible trace elements, like the rare earth elements patterns (Figures 5a and 5b). However, the multi-elements patterns show strong negative anomalies for Nb, P and Ti but they also show positive Pb anomalies; these features are commonly observed in subduction related arc magmatism [7,71,78]. Thus, the incompatible trace elements and the rare earth elements patterns suggest that the studied samples represent arc magmatism (Figures 5a and 5b). The studied samples are plotted in AFM diagram [80], they follow the tholeiitic to calc alkaline trend (Figure 8a). The plots indicate that the low silica rocks represent an immature arc while the high silica rocks follow the calc-alkaline trend indicating their derivation when the arc has matured. In the same diagram (Figure 8b), the mafic magmatic rocks from Khairagarh (basalts and high magnesian andesite) follow the tholeiitic trend although they plot separately. It has been shown by [28] that the HMA were derived from Andean type subduction environment and the basaltic rocks were emplaced in the back arc environment of the same arc. The Amgaon Boninite also plotted along with the Khairagarh HMA, indicating a similar environment of their emplacement as suggested by [55]. The Sakoli volcanics plot towards the high iron end of the tholeiitic trend and have been shown to have been emplaced in a rift tectonic environment with the supra-crustal sequences (Figure 8b).
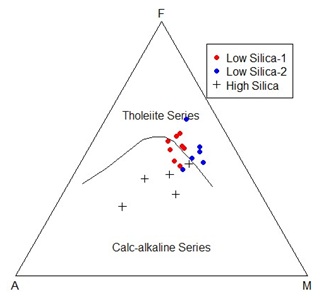 Figure 8a: AFM diagram [80] shows the tholeiitic to calc alkaline trend for our studied samples (Low Silica Group-1, Low Silica Group-2 and High Silica).
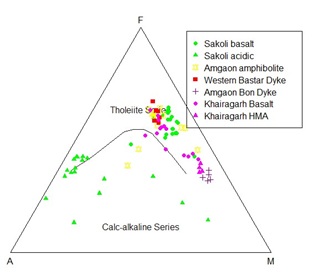 Figure 8b: AFM diagram [80] follows the tholeiitic trend and plot separately for the magmatic rocks from the Khairagarh (basalts and high magnesian andesite).
In the FeO/MgO vs SiO2 [81], whereas the low silica rocks plot within the tholeiite field, the high silica rocks plot within the calc-alkaline field (Figure 9a). This implies that the low silica rocks were derived from dominantly mantle components of the arc sources and the high silica rocks were derived from dominantly crustal sources or they represent mantle derived magma that interacted extensively with the crustal components, as the arc matured [82,83]. In this diagram, the samples from Sakoli belt, Amgaon mafic dykes and amphibolites, western Bastar dykes, and basaltic volcanics from Khairagarh belt plot within the tholeiitic series field, on the other hand the low-Ti basalt and HMA and boninite dykes plot in the calc-alkaline series along with the high silica rocks of the studied samples (Figure 9b). Like the AFM diagram (Figure 8) the FeOt/MgO vs SiO2 diagram (Figure 9) clearly distinguishes two lineages, tholeiitic samples representing continental rift volcanics and dykes and those from back arc basin.
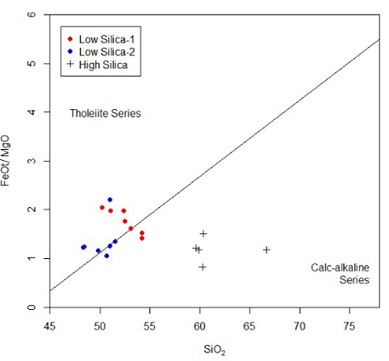 Figure 9a: SiO2 versus FeO/MgO plot [81], shows Low Silica Group-1 and Group-2 rocks plot within the tholeiite field whereas the High Silica rocks plot within the calc-alkailine field.
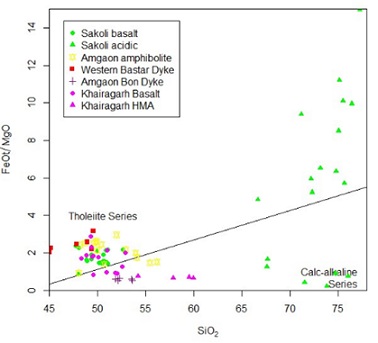 Figure 9b: SiO2 versus FeO/MgO plot [81], the samples from the adjoining areas plot within the tholeiitic series field while the samples from the low-Ti basalt, HMA and boninite dykes plot in the calc-alkaline series.
The boninitic dykes from Amgaon gneissic complex and the HMA and low Ti basalt of the Khairagarh basin plot in the calc alkaline series field. In the triangular plot of 2Nb - Zr/4 - Y [83], all the studied samples plot in the field of volcanic arc basalt (Figure 10a). All the mafic rocks samples from the adjoining areas plot in the fields of volcanic arc basalt and within plate tholeiites. Sakoli volcanics are shown to be rift related volcanics [72], Amgaon amphibolites and dykes are again rift related [38] this is confirmed by their plot in within-plate tholeiites field (Figure 10b).
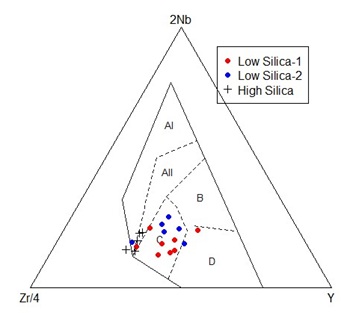 Figure 10a: The Nb-Zr/4- Y discrimination diagram for basalts [84]. The fields are defined as follows: Al- WPAB; All- WPAB/WPT; B- E-type MORB; C- WPT/ VAB; D- N-type MORB/VAB. All the studied samples (Low Silica Group-1, Group-2 and High Silica) plot in the field of volcanic arc basalt. (WPAB- within plate alkali basalts; E-type MORB- Mid Ocean Ridge Basalt; N-MORB- Normal MORB; VAB- volcanic arc basalts; WPT- within plate tholeiites).
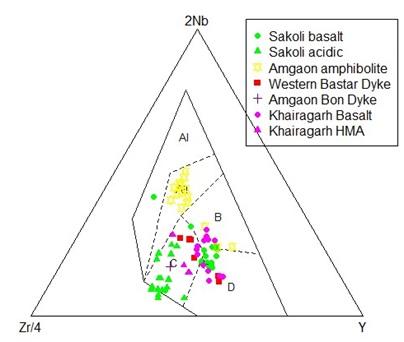
Figure 10b: The 2Nb - Zr/4 - Y discrimination diagram for basalts [84]. All the mafic rocks samples from the adjoining areas plot in the fields of volcanic arc basalt and within plate tholeiites.
Western Bastar dykes and the boninites are shown to be subduction related magmatism with arc tholeiite and boninitic affinities. HMA and low Ti basalt indicate generation in a hot Andean-type subduction zone for the HMA and Andean-type back-arc rifting for the basalt–basaltic andesite samples [11,28,48,63].
The tectonic discriminant Ti-V diagram after [85] is also being used to understand the tectonic setting of the studied samples. The basis of this plot is the variation in the crystal / liquid partition coefficients for V, which ranges with increasing oxygen fugacity from >1 to << 1. This is because V can exist in reducing conditions (V3+) or oxidizing conditions (V4+ and V5+) in a natural magma system. Since the partition coefficient for Ti is almost always <<1, the depletion of V relative to Ti is a function of the ƒO2 of the magma and its source region. Based on the Ti/V ratios rocks from different settings (Figure 11) are classified, although there are some overlaps for the rocks from continental flood basalt and back arc and MORB, the continental flood basalt field is restricted to higher V and Ti abundances with similar Ti/V ratios between 20 and 50. In this diagram the studied samples plot dominantly in the arc tholeiite field, although some samples straddle in the BAB field (Figure 11a).
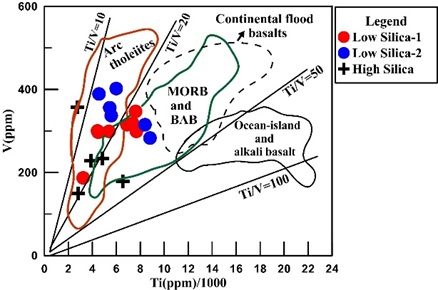 Figure 11a: Ti-V basalt discrimination diagram [85] shows the studied samples (Low Silica Group-1, Group-2 and High Silica) plot dominantly in the arc tholeiite field, although some samples straddle in the Back-arc basin (BAB) field.
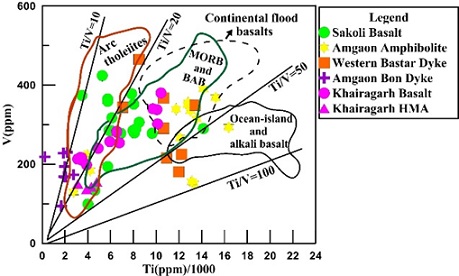 Figure 11b: Ti-V basalt discrimination diagram [85], the samples from the adjoining areas plot dominantly in the fields of continental flood basalt field, arc tholeiite field and MORB, BAB field.
The samples of the Amgaon amphibolites and western Bastar dykes plot dominantly in the continental flood basalt field. The samples of the Khairagarh basalt and HMA plot dominantly in the arc tholeiite field, although some of the Khairagarh basalt plots in the continental flood basalt field. Samples of the Amgaon boninite dykes plot with the arc tholeiite field (Figure 11b). The observed tectonic settings for the samples from the adjoining areas are consistent with the earlier studies [31], Amgaon Gneissic Complex basaltic and boninitic dykes [22,55,56], Amgaon Gneissic Complex amphibolic and doleritic dykes [38] and Khairagarh volcanics [28]. The present studied samples are similar to the Sakoli volcanics [31] plotting dominantly in the arc tholeiite field but a few samples plot in the BAB field.
Discussion and Conclusion
The U−Pb zircon age of 3.56Ga for a tonalite from the central part of the Bastar Craton was first described by [33]. Subsequently a U–Pb SHRIMP age of 3.6 Ga for a K-rich granite from Bastar Craton was reported by [11]. Our data indicate that the extraction age of the protoliths for the Amgaon Gneissic Complex vary between 3396 and 2550Ma [72] and the extraction age for the Tirodi Gneissic Complex vary from 2960 to 2122 Ma respectively [86]. The depleted mantle model ages for the Khairagarh volcanics vary from 2489 to 2984 Ma [28] and the depleted mantle model ages for the Sakoli mafic volcanics vary from 2000 to 2275 Ma [31]. Thus, it appears that the Bastar Craton evolved through bimodal volcanics right from the beginning in the form of basement gneiss (Amgaon and Tirodi Gneiss) and subsequently as rift and arc volcanism as the Craton evolved.
The studied dyke samples from the Bastar Craton represent Proterozoic mafic dykes from Amgaon and Khairagarh regions, belonging to the Dongargarh Supergroup. These dykes intrude the basement rocks known as the Amgaon Gneissic Complex with no apparent volcanics related to these dykes are present in the basement rocks. However, there are exposure of the Khairagarh mafic volcanics and HMA exposed as part of the supracrustal belt [28,64,66]. In the regional framework there are mafic volcanics recorded from the Sakoli supracrustal belt, where volcanic rocks are exposed with the rift related sediments. There are also reports of arc volcanism in the form of Pitepani belt volcanics and those from the Kotri-Dongargarh mobile belt [31,64]. However, in the adjoining areas dominantly dykes and sills are present in the basement rock - Amgaon and Tirodi gneiss [11,38,55,56]. On the basis of our field observations from the Bastar Craton and those from the other parts of the world, we conclude that because of deep erosion all the evidence of supracrustal rocks including the volcanics are gone and only dykes-sills and dyke swarms acted as plumbing system for the emplacement and eruption of mantle derived melts [46,87,88]. As the temperature of the early earth was much higher, there could have been enormous lava flows on the surface of the early earth, equivalent of Mesozoic Large Igneous Plutons (LIPs) but they are not preserved and their presence is indicated by the dykes, dyke swarms, sills and other mafic plutonic bodies which are exposed because of deep erosion and exposure of plutonic bodies and basement gneisses [9,62,89,90].
Acknowledgments
HC thanks the Director, Inter- University Accelerator Center (IUAC), New Delhi for mentorship and support all through this work. University Grants Commission (UGC), DS Kothari fellowship, application number- ES/19-20/0011 is gratefully acknowledged by HC to carry out this research work. TA thanks the JC Bose Fellowship, SERB New Delhi for the financial support and Director, Wadia Institute of Himalayan Geology, Dehradun for the infrastructural facilities.
References
- Arndt NT, Bruzak G, Reischmann T (2001) The oldest continental and oceanic plateaus: geochemistry of basalts and komatiites of the Pilbara craton, Australia. In: Ernst RE, Buchan, KL (eds) Mantle Plumes: Their Identification Through Time. Geol. Soc. Amer. Spec. Publ., 352: 359-387.
- Cawood PA, Hawkesworth CJ, Dhuime B (2013) The continental record and the generation of continental crust. Bull 125: 14-32.
- Cawood PA, Hawkesworth CJ (2019) Continental crustal volume, thickness and area, and their geodynamic implications. Gond. Research 66: 116-125.
- Hawkesworth C, Cawood PA, Dhuime B (2019) Rates of generation and growth of the continental crust. Geosci. Frontiers 10: 165-173.
- Hawkesworth C, Cawood PA, Dhuime B (2020) The evolution of the continental crust and the onset of plate tectonics. Front. Ear. Science 8: 326.
- Horan MF, Hanson GN, Spencer KJ (1987) Pb and Nd isotope and trace element constraints on the origin of basic rocks in an early Proterozoic igneous complex, Minnesota. Precamb. Research 37: 323-342.
- Ahmad T, Tarney J (1991) Geochemistry and petrogenesis of Garhwal Volcanics: implications for evolution of the north Indian lithosphere. Precambrian Research 50: 69-88.
- Ernst RE (2001) The use of mafic dyke swarms in identifying and locating. Mantle Plumes: Their Identification through Time. Geol. Soc., Amer., Spec. Pub., 352: 247-265.
- Ernst RE, Buchan KL (2001) Large mafic magmatic events through time and links to mantle-plume heads. In: Ernst RE, Buchan, KL (eds) Mantle Plumes: Their Identification through Time. Geol. Soc. Amer. Spec. Papers, 352: 483-566.
- Korenega J (2008) Plate tectonics, flood basalts and the evolution of Earth’s oceans. Terra Nova 20: 419-439.
- Srivastava RK, Ellam RM, Gautam GC (2009) Sr–Nd isotope geochemistry of the early Precambrian sub-alkaline mafic igneous rocks from the southern Bastar craton, Central India. Mineral. Petrol., 96: 71–79.
- Samal AK, Srivastava RK, Ernst RE (2021) An appraisal of mineral systems associated with Precambrian Large Igneous Provinces of the Indian Shield. Ore Geology Reviews 131: 104009.
- Herzberg C, Zhang J (1996) Melting experiments on anhydrous peridotite KLB-1: Compositions of magmas in the upper mantle and transition zone. Journal of Geophysical Research, 101: 8271-8295.
- Condie KC (2005) High field strength element ratios in Archean basalts: a window to evolving sources of mantle plumes? Lithos 79: 491-504.
- Wanjari N, Ahmad T (2007) Geochemistry of granitoids and associated mafic enclaves in Kalpathri area of Amgaon Gneissic Complex, Central India. Gond. Geol. Magazine Special 10: 55-64.
- Keller CB, Schoene B (2012) Statistical geochemistry reveals disruption in secular lithospheric evolution about 2.5 Gyr ago. Nature 485: 490-493.
- Bickle MJ (1986) Implications of melting for stabilisation of the lithosphere and heat loss in the Archaean. Eart. Plan. Sci. Letters 80: 314-324.
- Herzberg C, Condie K, Korenaga J (2010) Thermal history of the Earth and its petrological expression. Eart. and Plan. Science Letters 292: 79-88.
- Lassiter JC, DePaolo DJ (1997) Plume/lithosphere interaction in the generation of continental and oceanic flood basalts: chemical and isotopic constraints. Geophy. Mono. Amer. Geophy. Union 100: 335-356.
- Cawood PA, Hawkesworth CJ, Pisarevsky SA, Dhuime B, Capitanio, FA, et al. (2018) Geological archive of the onset of plate tectonics. Philos. Trans. of the Royal Society 376: 20170405.
- Condie KC, Aster RC, Van Hunen J (2016) A great thermal divergence in the mantle beginning 2.5 Ga: Geochemical constraints from greenstone basalts and komatiites. Geoscience Frontiers 7: 543-553.
- Rao NVC, Burgess R, Lehmann B, Mainkar D, Pande SK, et al. (2011) 40Ar/39Ar ages of mafic dykes from the Mesoproterozoic Chattisgarh basin, Bastar craton, Central India: Implication for the origin and spatial extent of the Deccan Large Igneous Province. Lithos 125: 994-1005.
- Radhakrishna T, Chandra R, Srivastava AK, Balasubramonian G (2013) Central/Eastern Indian Bundelkhand and Bastar cratons in the Palaeoproterozoic supercontinental reconstructions: A palaeomagnetic perspective. Precam. Research 226: 91-104.
- Radhakrishna T, Krishnendu NR, Balasubramonian G (2013) Palaeoproterozoic Indian shield in the global continental assembly: Evidence from the palaeomagnetism of mafic dyke swarms. Earth-Sci. Reviews 126: 370-389.
- Samal AK, Rai AK, Srivastava RK (2020) Multiple mantle melting events for two overlapping ca. 2.21– 2.18 Ga mafic dyke swarms in the Dharwar craton, India. Intern. Geology Reviews 63: 2166-2191.
- Srivastava RK, Gautam GC (2015) Geochemistry and petrogenesis of Paleo Mesoproterozoic mafic dyke swarms from northern Bastar Craton, central India: Geodynamic implications in reference to Columbia supercontinent. Gond. Research 28: 1061-1078.
- Ahmad T, Mishra MK, Longjam KC, Alam M, Joshi KB, et al. (2010) Characterization of the Proterozoic mafic magmatism in the Central Indian Shield: constraints on crustal evolution. National symposium on ‘Geology and Mineral Resources of Bundelkhand Craton (GMRB-2010), 17.
- Longjam KC, Ahmad T (2012) Geochemical characterization and petrogenesis of Proterozoic Khairagarh volcanics: implication for Precambrian crustal evolution. Geology Journal 47: 130-143.
- Ramakrishna RCV, Gupta HK, Krishna VG, Gaur VK (1989) Seismic structure of the subcrustal lithosphere in the south Indian shield from body wave travel times data of shallow earthquakes, In: International Symposium on “Structure and Dynamics of the Indian Lithosphere” Hyderabad, India.
- Chattopadhyay A, Huin AK, Khan AS (2003) Structural framework of Deolapar area, central India and its implications for Proterozoic nappe tectonics. Gond. Research 6: 107-117.
- Ahmad T, Longjam KC, Fouzdar B, Bickle MJ, Chapman HJ (2009) Petrogenesis and tectonic setting of bimodal volcanism in the Sakoli Mobile Belt, Central Indian shield. Island Arc18: 155-174.
- Sarkar G, Corfu F, Paul DK, McNaughton NJ, Gupta SN, et al. (1993) Early Archean crust in Bastar Craton, Central India - a geochemical and isotopic study. Precamb. Research 62: 127-137.
- Ghosh JG (2004) 3.56 Ga tonalite in the central part of the Bastar Craton, India: oldest Indian date. Jour. of Asian Earth Science 23: 359-364.
- Ramachandra HM (2004) A review of terrane evolution in the Precambrian Dharwar and Bastar Craton. GSI Spec. Publ., 84: 1-21.
- Wanjari N, Asthana D, Rao VD (2005) Remnants of early continental crust in the Amgaon gneisses, Central India: geochemical evidence. Research 8: 589-595.
- Mondal MEA, Hussain MF, Ahmad T (2020) Archean granitoids of the Bastar Craton, Central India. Society, London, Special Publications 489: 135-155.
- Dora ML, Upadhyay D, Malviya VP, Meshram T, Baswani SR, et al. (2021) Neoarchaean and Proterozoic crustal growth and reworking in the Western Bastar Craton, Central India: Constraints from zircon, monazite geochronology and whole-rock geochemistry. Research 362: 106284.
- Alam M, Naushad M, Wanjari N, Ahmad T (2009) Geochemical Characterizations of Mafic Magmatic Rocks of the Central Indian Shield: Implication for Precambrian Crustal Evolution. of the Virtual Explorer 32: 21.
- Mohanty SP (2015) Palaeoproterozoic supracrustals of the Bastar Craton: Dongargarh supergroup and Sausar group. Soc., London, Memoris 43: 151-164.
- Randive KR, Korakoppa MM, Muley SV, Varade AM, Khandare HW, et al. (2015) Paragenesis of Cr-rich muscovite and chlorite in green-mica quartzites of Saigaon–Palasgaon area, Western Bastar Craton, India. Earth Syst. Science 124: 213-225.
- Roy A, Prasad HM (2003) Tectonothermal events in Central Indian Tectonic Zone (CITZ) and its implications in Rodinian crustal assembly. Journal Asian Earth Science 22: 115-129.
- Mishra VP, Singh P, Dutta NK (1988) Stratigraphy, structure and metamorphic history of Bastar craton. Geol. Surv. India Rec., 117: 1-26.
- Santosh M, Tsunogae T, Yang CX, Han YS, Hari KR, et al. (2020) The Bastar craton, central India: A window to Archean–Paleoproterozoic crustal evolution. Research 79: 157-184.
- Vansutre S, Hari KR (2010) Granulite belts of Central India with special reference to the Bhopalpatnam Granulite Belt: Significance in crustal evolution and implications for Columbia supercontinent. Asian Earth Science 39: 794-803.
- Mukherjee S, Adhikari A, Vadlamani R (2019) Constraining paleoproterozoic (∼7 Ga) collisional orogenesis between the Eastern Dharwar and Bastar cratons: New Sm–Nd garnet isochron and Th–U-total Pb monazite chemical ages from the Bhopalpatnam orogen, central India. Lithos 350: 105247.
- Meshram T, Dora ML, Baswani SR, Upadhyay D, Meshram R, et al. (2021) Petrogenesis and UPb geochronology of charnockites flanking the Pranhita Godavari rift in peninsular India-link between the Bastar and Eastern Dharwar Cratons. Research92: 113-132.
- French JE, Heaman LM, Chacko T, Srivastava RK (2008) 1891–1883 Ma Southern Bastar–Cuddapah mafic igneous events, India: A newly recognized large igneous province. Research 160: 308-322.
- Srivastava RK, Mondal SK, Balaram V, Gautam GC (2010) PGE geochemistry of low-Ti high-Mg siliceous mafic rocks within the Archaean Central Indian Bastar Craton: implications for magma fractionation. Petrology 98: 329-345.
- Shellnutt JG, Hari KR, Liao AY, Denyszyn SW, Vishwakarma N, et al. (2019) Petrogenesis of the 1.85 Ga Sonakhan mafic dyke swarm, Bastar Craton, India. Lithos 334: 88-101.
- Liao ACY, Shellnutt JG, Hari KR, Denyszyn SW, Vishwakarma N, et al. (2019) A petrogenetic relationship between 2.37 Ga boninitic dyke swarms of the Indian Shield: Evidence from the Central Bastar Craton and the NE Dharwar Craton. Research 69: 193-211.
- Samal AK, Srivastava RK, Ernst RE, Söderlund U (2019) Neoarchean-Mesoproterozoic mafic dyke swarms of the Indian Shield mapped using Google Earth™ images and ArcGIS™, and links with large igneous provinces. In Dyke swarms of the World: A modern perspective, 335-390.
- Ratre K, De Waele B, Biswal TK, Sinha S (2010) SHRIMP geochronology for the 1450 Ma Lakhna dyke swarm: Its implication for the presence of Eoarchaean crust in the Bastar Craton and 1450–517 Ma depositional age for Purana basin (Khariar), Eastern Indian Peninsula. Asian Earth Science 39: 565-577.
- Das P, Das K, Chakraborty PP, Balakrishnan S (2011) 1420 Ma diabasic intrusives from the Mesoproterozoic Singhora Group, Chhattisgarh Supergroup, India: Implications towards non-plume intrusive activity. Earth Sys. Science 120: 223-236.
- Mondal MEA, Hussain MF, Ahmad T (2006) Continental growth of Bastar craton, central Indian shield during Precambrian via multiphase subduction and lithospheric extension/rifting: evidence from geochemistry of gneisses, granitoids and mafic dykes. Geoscience Osaka City University 49: 137-151.
- Hazarika B, Malpe DB, Dongre A (2019) Petrology and geochemistry of a boninite dyke from the western Bastar craton of central India. Journal Earth System Science 128: 1-17.
- Hazarika B, Malpe DB, Dongre A (2020) Petrogenesis of mafic dykes from the western Bastar craton of Central India and their relation to outgrowth of Columbia supercontinent. Mineralogy and Petrology 114: 243-262.
- Srivastava RK, Söderlund U, Ernst RE, Gautam GC (2021) A ca. 2.25 Ga mafic dyke swarm discovered in the Bastar craton, Central India: Implications for a widespread plume-generated Large Igneous Province (LIP) in the Indian shield. Research 360: 106232.
- Stein HJ, Hannah JL, Zimmerman A, Markey RJ, Sarkar SC, et al. (2004) A 2.5 Ga porphyry Cu–Mo–Au deposit at Malanjkhand, central India: implications for Late Archean continental assembly. Research 134: 189-226.
- Panigrahi MK, Bream BR, Misra KC, Naik RK (2004) Age of granitic activity associated with copper-molbdenum mineralization at Malanjkhand, Central India. Mineralium Deposita 39: 670-677.
- Rajesh HM, Mukhopadhyay J, Beukes NJ, Gutzmer J, Belyanin GA, et al. (2009) Evidence for an early Archaean granite from Bastar craton, India. Geological Society 166: 193-196.
- Dora ML, Singh Y, Joshi S, Kundu A, Suresh G, et al. (2019) The first report on the chemical (Th–U–Pb) monazite age of the Mul granite pluton, Western Bastar craton, central India and its metallogenic significance. Earth System Science 128: 1-7.
- Asokan AD, Elangovan R, Vishwakarma N, Hari KR, Ram Mohan M (2020) Petrogenesis of the Kanker granites from the Bastar craton: implications for crustal growth and evolution during the Archean-Proterozoic transition. Earth Science 8: 212.
- Srivastava RK, Pimentel MM, Gautam GC (2016) Nd-isotope and geochemistry of an early Palaeoproterozoic high-Si high-Mg boninite–norite suite of rocks in the southern Bastar craton, central India: petrogenesis and tectonic significance. Internatinal Geol. Reviews 58: 1596-1615.
- Asthana D, Dash MR, Pophare AM, Khare SK (1996) Interstratified low-Ti and high-Ti volcanics in arc-related Khairagarh Group of Central India. Current Science 71: 304-306.
- Deshpande GG, Mohabey NK, Deshpande MS (1990) Petrography and tectonic setting of Dongargarh volcanics. Visesa Prakasana-Bharatiya Bhuvaijñanika Sarveksana 28: 260-286.
- Asthana D, Kumar S, Vind AK, Zehra F, Kumar H, et al. (2018) Geochemical fingerprinting of∼5 Ga forearc-arc-backarc related magmatic suites in the Bastar Craton, Central India. Jour. Asian Earth Science 157: 218-234.
- Bhattacharya S, Chaudhary AK, Basei M (2012) Original nature and source of khondalites in the Eastern Ghats Province, India. Soc, London, Special Publications, 365: 147-159.
- Sun SS, McDonough WF (1989) Chemical and isotopic systematics of oceanic basalts: implications for mantle composition and processes. In: Saunders AD, Norry MJ (eds) Magmatism in ocean basins. Geol. Soc. London Spec. Publications 42: 313-345.
- Middlemost EAK (1994) Naming materials in magma/igneous rock system. Earth Science Reviews 37: 215-224.
- Le Bas MJ, Le Maitre RW, Streckeisen A, Zanettin B (1986) A chemical classification of volcanic rocks based on the total alkali-silica system. Petrology 27: 745-750.
- Pearce JA (1996) A user’s guide to basalt discrimination diagrams. Trace element geochemistry of volcanic rocks: applications for massive sulphide exploration. Geol. Assoc. Canada, Short Course Notes 12: 79-113.
- Ahmad T, Dragusanu C, Tanaka T (2008) Provenance of Proterozoic Basal Aravalli mafic volcanic rocks from Rajasthan, Northwestern India: Nd isotopes evidence for enriched mantle reservoirs. Precambrian Research 162: 150-159.
- Srivastava RK, Gautam GC (2012) Early Precambrian mafic dyke swarms from the Central Archaean Bastar craton, India: geochemistry, petrogenesis amd tectonic implications. Geol. Journal 47: 144-160.
- Srivastava RK, Samal AK (2019) Geochemical characterization, petrogenesis, and emplacement tectonics of Paleoproterozoic high-Ti and low-Ti mafic intrusive rocks from the western Arunachal Himalaya, northeastern India and their possible relation to the~ 1.9 Ga LIP event of the Indian shield. Journal 54: 245-265.
- Tarney J (1992) Geochemistry and significance of mafic dyke swarms in the Proterozoic. In Developments in Precamb. Geology 10: 151-179.
- Drury SA (1983) The petrogenesis and setting of Archaean metavolcanics from Karnataka State, South India. Geochim. Acta 47: 317-329
- Sun SS, Nesbitt RW (1977) Chemical heterogeneity of the Archaean mantle, composition of the Earth and mantle evolution. Earth Planet. Science Letters 35: 429-448.
- Pearce JA, Norry MJ (1979) Petrogenetic implications of Ti, Zr, Y, and Nb variations in volcanic rocks. Mineral. Petrology 69: 33-47.
- Ahmad T, Mukherjee PK, Trivedi JR (1999) Geochemistry of Precambrian mafic magmatic rocks of the Western Himalaya, India: petrogenetic and tectonic implications. Chemical Geology, 160, 103-119.
- Irvine TN, Baragar WRA (1971) A guide to the chemical classification of the common volcanic rocks. Jour. Earth Science 8: 523-548.
- Miyashiro A (1974) Volcanic rock series in island arcs and active continental margins. Jour. Science 274: 321-355.
- Hawkesworth CJ, Turner SP, McDermott F, Peate DW, Van Calsteren P (1997) U-Th isotopes in arc magmas: Implications for element transfer from the subducted crust. Science 276: 551-555.
- Keller B, Schoene B (2018) Plate tectonics and continental basaltic geochemistry throughout Earth history. Earth Planet. Sci. Letters 481: 290-304.
- Meschede M (1986) A method of discriminating between different types of mid-ocean ridge basalts and continental tholeiites with the Nb 1bZr 1bY diagram. Geology 56: 207-218.
- Shervais JW (1982) Ti-V plots and the petrogenesis of modern and ophiolitic lavas. Earth Planet. Sci. Letters 59: 101-118.
- Mishra MK, Devi SJ, Kaulina T, Dass KC, Kumar S, et al. (2011) Petrogenesis and tectonic setting of the Proterozoic mafic magmatic rocks of the central Indian Tectonic Zone, Betul area: geochemical constraints. In Dyke Swarms: Keys for Geodynamic Interpretation, 189-201.
- Acharyya SK (2001) Geodynamic setting of the Central Indian Tectonic Zone in central, eastern and north-eastern India. Geological Survey of India Special Publications64: 17-35.
- Pandey A, Chalapathi Rao NV (2019) Coupled assimilation and fractional crystallization (AFC) and mantle plume source (s) contribution in the generation of Paleoproterozoic mafic dykes of the Eastern Dharwar Craton, Southern India. Geol. Soc. India 93: 157-162.
- Nance RD, Murphy JB, Santosh M (2014) The supercontinent cycle: a retrospective essay. Research 25: 4-29.
- Singh SK, Srivastava RK, Kumar S, Samal AK (2021) Geochemical characterization of the Paleoproterozoic (ca. 1.98-1.97) Darguwan-Surajpura mafic sills within the Bijawar basin, North-Central India: Genetic aspects and geodynamic implications. Geochem., 81: 125689.
Citation: Chauhan H, Wanjari N, Pandey AC, Ahmad T (2022) Geochemistry, Petrogenesis and Tectonic Setting of the Mafic Dykes from the Amgaon and Khairagarh Regions, Bastar Craton, Central Indian Shield: Constraints on the Precambrian Crustal Evolution. J Atmos Earth Sci 6: 030.
Copyright: © 2022 Hiredya Chauhan, et al. This is an open-access article distributed under the terms of the Creative Commons Attribution License, which permits unrestricted use, distribution, and reproduction in any medium, provided the original author and source are credited.