Grip & Pinch Strength in Relation to Anthropometric Data in Adults
*Corresponding Author(s):
Thomas LauwersDepartment Of Plastic Surgery, Maastricht University Medical Center, Maastricht, Netherlands
Email:t.lauwers@mumc.nl
Abstract
There are few studies that comprehensively explore a large scale of variables within one study population to correctly determine the variables that are truly significant in determining grip and pinch strength. Furthermore studies that have been conducted on this subject mostly offer conflicting reports and are based on different geographical populations. The goal of this study is to explore a large scale of variables and their relationship to grip and pinch strength and to establish reference values to help clinicians asses loss of grip and pinch strength in patients.
A cross-sectional study was conducted on 309 participants between 18 and 80 with at least one healthy upper extremity. The grip and pinch strength was measured using a Jamar hand dynamometer in position two and a Jamar hydraulic pinch gauge.
A total of 309 participants were included in this study, 152 (49.2%) males and 157 (50.8%) females between the age of 18 and 80 years old. Linear regression analysis reveals a varying set of variables significantly associated with grip and pinch strength (p ≤ 0.05). For grip strength, these are age, sex, height, weight, and thickest forearm circumference, while for pinch strength these are sex, weight, thickest forearm circumference, and hand length.
Keywords
LEVEL OF EVIDENCE
INTRODUCTION
The interpretation of grip strength can only be done objectively if there are reference values which can be compared to the measured grip and pinch strength of a patient. These however are scarce, especially for the European population making the evaluation of grip strength subjective to the clinicians experience and expectations.
Another solution would be to measure the grip strength in the contralateral hand and compare those results with that of the injured hand [10]. This however gives rise to a number of problems, namely that the grip strength in the dominant hand would be significantly higher than in the non-dominant hand [11,12]. However in different cases it would seem that only right handed individuals have a significantly higher grip strength in the dominant hand [13-16]. While others say there is no significant difference in grip strength between the dominant and non-dominant hand [17,18]. This makes it unclear whether or not measuring the grip strength in the contralateral hand is a suitable means for determining what the grip strength in the affected hand should be. Evidently this method of assessing grip strength would also be useless if there is a case of bilateral loss of grip strength.
The solution for this is to have reference values of hand grip and pinch strength means or a formula in which one could insert a number of patient dependent variables and then calculate the predicted grip and pinch strength [11,17]. But to achieve this we must first determine which variables are truly determinative for the grip and pinch strength.
Several studies have reported that grip strength has a correlation with a number of variables, these range from the health status and physical activity [19,20] to occupation [21] and anthropometric factors such as the circumference of the forearm and height [22]. But the variables that were measured, their correlations and the statistical significance of these variables vary between the studies and are based on completely different geographical populations. Furthermore according to a Korean study on normative measurements on grip and pinch strength no significant correlations have been found between anthropometric variables and grip strength in women [18]. To our knowledge there are few studies that comprehensively explore a large scale of variables within the same study population to correctly determine the variables that are truly significant in determining grip and pinch strength.
MATERIALS AND METHODS
Participants
The study was conducted in Maastricht, The Netherlands, at the Maastricht University Medical Centre (MUMC+). The aim was to obtain at least 240 voluntary participants with 20 males and 20 females in each age group (18-29, 30-39, 40-49, 50-59, 60-69, 70-80). These numbers were chosen in order to ensure there is enough heterogeneity in the study population to be able to correct for age and sex.
Study protocol
Basic information was first obtained: Surname, date of birth, gender, hand dominance, length, weight and medical history (in accordance to the exclusion criteria).
If the participants met the requirements, further anthropometric data was taken and all measurements were done in centimeters (Figures 1 and 2).

Figure 1: Anthropometric measurements.
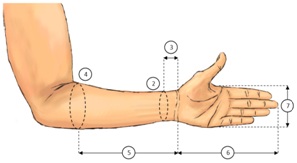
Figure 2: Anthropometric measurements.
1) Forearm length (measured from the proximal border of the lateral epicondyle of the humerus to the radial styloid process). 2) Thinnest forearm circumference. 3) Distance between the thinnest forearm circumference till the distal wrist crease. 4) Thickest forearm circumference. 5) Distance between the thickest forearm circumference till the distal wrist crease. 6) Hand length (measured from the distal wrist crease till the tip of the third finger). 7) Hand width (measured at the height of the distal palmar crease).
Upon completing the necessary documentation the grip and pinch strength were measured using a calibrated Jamar hand dynamometer in position two [23] and a calibrated Jamar hydraulic pinch gauge (Sammons Preston Rolyan). All grip and pinch strength measurements were conducted according to the recommendations of the American Society of Hand Therapists [24]. The participant was seated with the arm in neutral position and elbow flexed to 90 degrees. The forearm was held in a neutral position with little to no flexion nor ulnar deviation of the wrist. The grip and pinch strength were measured three times in kilograms and the mean was calculated and used as the outcome [25].
Two subgroup measurements were performed on a smaller portion of the participants. The first subgroup measurements were performed to analyze the difference between dominant and non-dominant hand grip and pinch strength.
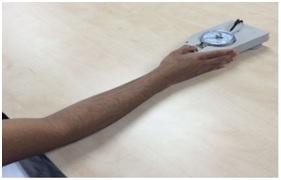
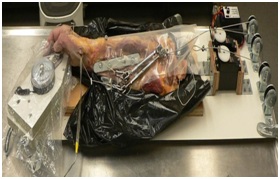
The second subgroup measurements were performed to compare the outcome of pinch grip strength measured in the classical way with the outcome of pinch grip strength measured in a specific fixed position, the fixed pinch position. In the fixed pinch position the participant is sitting down in front of a table with the upper arm adducted to the torso and the forearm (from the elbow down) fixed on the table. The participant would then rest his/her palm and stretched fingers to the side of a specially built Jamar hydraulic pinch gauge holder. The participant would then, using only his/her thumb, press downwards on the pinch gauge without lifting the forearm or grabbing the pinch gauge holder with the other fingers (Figure 3). This would allow us to assess the force that the muscles in the thumb are able to exert without synergistic action from muscles of the other fingers or wrist. This data would also allow us to testa cyclic loading model we are developing, in another study, which is similar to other experimental settings reported in literature [26]. The cyclic loading model can then be used in future experimental cadaver research which requires researchers to mimic realistic pinch forces (Figure 4).
Data analysis
Linear regression analysis was performed to analyze the uncorrected and corrected effect of patient characteristics on grip and pinch strength, where the corrected effects were obtained by adding all variables in one multivariable linear regression model.
Multicollinearity was checked using Variance Inflation Factors (VIF), where a VIF > 10 indicates a collinearity problem. No multicollinearity was found in our models. We considered p-values ≤ 0.05 to be statistically significant. Because this study is exploratory we did no correct for multiple testing. IBM SPSS Statistics for Windows (version 21.0, Armonk, NY: IBM Corp) was used for all statistical analyses.
RESULTS
|
Overall |
Men |
Women |
Significance |
|
|
(n = 309) |
(n = 152) |
(n = 157) |
||
|
Mean (SD) |
Mean (SD) |
Mean (SD) |
p |
|
|
Age (years) |
52.9 (17.7) |
53.9 (18.4) |
51.9 (17.1) |
0.315 |
|
Height (cm) |
172.4 (9.9) |
178.8 (8.1) |
166.2 (7.1) |
≤ 0.001 |
|
Weight (kg) |
76.1 (15.0) |
83.0 (13.6) |
69.4 (13.3) |
≤ 0.001 |
|
Forearm length (cm) |
26.7 (2.1) |
28.0 (1.6) |
25.3 (1.5) |
≤ 0.001 |
|
Thinnest forearm circumference (cm) |
17.8 (1.5) |
18.6 (1.3) |
17.0 (1.3) |
≤ 0.001 |
|
Distance till distal wrist crease (cm)* |
3.9 (0.9) |
4.0 (0.9) |
3.7 (0.8) |
0.006 |
|
Thickest forearm circumference (cm) |
26.7 (2.6) |
28.3 (2.0) |
25.1 (2.1) |
≤ 0.001 |
|
Distance till distal wrist crease (cm)** |
20.3 (1.8) |
21.3 (1.4) |
19.3 (1.4) |
≤ 0.001 |
|
Hand length (cm) |
18.4 (1.2) |
19.3 (1.0) |
17.7 (0.9) |
≤ 0.001 |
|
Hand width (cm) |
8.5 (0.7) |
9.0 (0.5) |
8.0 (0.4) |
≤ 0.001 |
|
* In relation to the location of the thinnest forearm circumference |
||||
|
** In relation to the location of the thickest forearm circumference |
||||
The mean grip and pinch strength was significantly higher for men than for women (p < 0.001) (Table 2). Men had a 16.7kg higher mean grip strength, which translates to 63.1% more grip strength compared to women. This was similar for the pinch strength where men had a 3.4kg higher mean pinch strength, which translates to 53.6% more pinch strength compared to women.
|
Men |
Women |
Difference |
95% CI of the Difference |
Significance |
||
|
Mean (SD) |
Mean (SD) |
Mean |
Lower Bound |
Upper Bound |
P |
|
|
Grip strength (kg) |
43.0 (9.8) |
26.4 (6.1) |
-16.7 |
-18.5 |
-14.8 |
≤ 0.001 |
|
Pinch strength (kg) |
9.7 (1.8) |
6.3 (1.3) |
-3.4 |
-3.7 |
-3.0 |
≤ 0.001 |
Analyzing all variables separately revealed the uncorrected effects of age, sex, height, weight, forearm length, thinnest forearm circumference, thickest forearm circumference and its distance till distal wrist crease, hand length and hand width to be significantly correlated to grip strength (all p-values ≤ 0.001). This was not the case for the variable distance till distal wrist crease in relation to the thinnest forearm circumference (p = 0.980) (Table 3).
|
Uncorrected Effect |
Significance |
Corrected Effect |
Significance |
|
|
B* (95% CI) |
p |
B* (95% CI) |
p |
|
|
Age (years) |
-0.165 |
≤ 0.001 |
-0.134 |
≤ 0.001 |
|
(-0.236 to -0.094) |
(-0.185 to -0.082) |
|||
|
Sex (man/woman) |
16.648 |
≤ 0.001 |
8.506 |
≤ 0.001 |
|
(14.830 to 18.466) |
(5.978 to 11.035) |
|||
|
Height (cm) |
0.796 |
≤ 0.001 |
0.262 |
0.001 |
|
(0.698 to 0.894) |
(0.108 to 0.416) |
|||
|
Weight (kg) |
0.358 |
≤ 0.001 |
-0.203 |
0.001 |
|
(0.281 to 0.435) |
(-0.319 to -0.087) |
|||
|
Forearm length (cm) |
3.505 |
≤ 0.001 |
-0.163 |
0.660 |
|
(3.013 to 3.997) |
(-0.890 to 0.565) |
|||
|
Thinnest forearm circumference (cm) |
3.249 |
≤ 0.001 |
-0.635 |
0.264 |
|
(2.476 to 4.022) |
(-1.752 to 0.482) |
|||
|
Distance till distal wrist crease (cm)** |
0.020 |
0.980 |
-0.367 |
0.477 |
|
(-1.522 to 1.562) |
(-1.383 to 0.648) |
|||
|
Thickest forearm circumference (cm) |
2.895 |
≤ 0.001 |
2.445 |
≤ 0.001 |
|
(2.506 to 3.284) |
(1.651 to 3.240) |
|||
|
Distance till distal wrist crease (cm)*** |
3.425 |
≤ 0.001 |
-0.077 |
0.825 |
|
(2.784 to 4.065) |
(-0.762 to 0.608) |
|||
|
Hand length (cm) |
5.933 |
≤ 0.001 |
0.944 |
0.129 |
|
(5.102 to 6.764) |
(-0.278 to 2.166) |
|||
|
Hand width (cm) |
10.121 |
≤ 0.001 |
0.365 |
0.738 |
|
(8.645 to 11.597) |
(-1.780 to 2.510) |
|||
|
* Regression coefficient |
||||
|
** In relation to the location of the thinnest forearm circumference |
||||
|
*** In relation to the location of the thickest forearm circumference |
||||
However, after correcting for the effects of all the variables by analyzing them as part of one singular model, only the corrected effects of age, sex, height, weight and the thickest forearm circumference remained significantly correlated to grip strength (all p-values ≤ 0.001) (Table 3).
Analysis revealed a similar pattern when separately analyzing the same variables in relation to the pinch strength, where the uncorrected effects of sex, height, weight, forearm length, thinnest forearm circumference, thickest forearm circumference and its distance till distal wrist crease, hand length, and hand width were significantly correlated to pinch strength (all p-values ≤ 0.001). The uncorrected effects of age (p = 0.443) and distance till distal wrist crease in relation to thinnest forearm circumference (p = 0.142) were not significant (Table 4).
|
Uncorrected Effect |
Significance |
Corrected Effect |
Significance |
|
|
B* (95% CI) |
p |
B* (95% CI) |
p |
|
|
Age (years) |
-0.006 |
0.443 |
-0.010 |
0.054 |
|
(-0.020 to 0.009) |
(-0.021 to 0.000) |
|||
|
Sex (man/woman) |
3.378 |
≤ 0.001 |
1.719 |
≤ 0.001 |
|
(3.032 to 3.724) |
(1.201 to 2.237) |
|||
|
Height (cm) |
0.139 |
≤ 0.001 |
0.017 |
0.300 |
|
(0.118 to 0.160) |
(-0.015 to 0.048) |
|||
|
Weight (kg) |
0.076 |
≤ 0.001 |
-0.055 |
≤ 0.001 |
|
(0.061 to 0.091) |
(-0.079 to -0.032) |
|||
|
Forearm length (cm) |
0.666 |
≤ 0.001 |
0.027 |
0.723 |
|
(0.567 to 0.765) |
(-0.122 to 0.176) |
|||
|
Thinnest forearm circumference (cm) |
0.852 |
≤ 0.001 |
0.210 |
0.072 |
|
(0.713 to 0.990) |
(-0.019 to 0.439) |
|||
|
Distance till distal wrist crease (cm)** |
0.226 |
0.142 |
-0.002 |
0.986 |
|
(-0.076 to 0.529) |
(-0.210 to 0.206) |
|||
|
Thickest forearm circumference (cm) |
0.610 |
≤ 0.001 |
0.458 |
≤ 0.001 |
|
(0.538 to 0.683) |
(0.296 to 0.621) |
|||
|
Distance till distal wrist crease (cm)*** |
0.620 |
≤ 0.001 |
-0.061 |
0.389 |
|
(0.490 to 0.749) |
(-0.202 to 0.079) |
|||
|
Hand length (cm) |
1.223 |
≤ 0.001 |
0.356 |
0.005 |
|
(1.065 to 1.382) |
(0.106 to 0.606) |
|||
|
Hand width (cm) |
2.190 |
≤ 0.001 |
-0.056 |
0.803 |
|
(1.918 to 2.462) |
(-0.495 to 0.383) |
|||
|
* Regression coefficient |
||||
|
** In relation to the location of the thinnest forearm circumference |
||||
|
*** In relation to the location of the thickest forearm circumference |
||||
Once again, after correcting for the effects of all the variables by analyzing them as part of one singular model, only the corrected effect of sex (p ≤ 0.001), weight (p ≤ 0.001), thickest forearm circumference (p ≤ 0.001) and hand length (p = 0.005) remained significantly correlated to pinch strength (Table 4).
When looking at hand dominance, women were found to have a statistically significant higher grip and pinch strength in the dominant hand versus the non-dominant hand. No such significant difference was found in men (Table 5).
|
Sex (n) |
Dominant Hand |
Non-Dominant Hand |
Significance |
95% Confidence Interval |
||
|
Mean (SD) |
Mean (SD) |
p |
Lower Bound |
Upper Bound |
||
|
Grip strength (kg) |
Men (25) |
38.6 (8.5) |
38.4 (7.5) |
0.839 |
-1.56 |
1.91 |
|
Women (25) |
24.8 (5.5) |
23.0 (5.4) |
0.009 |
0.49 |
3.08 |
|
|
Pinch strength (kg) |
Men (25) |
9.1 (1.6) |
8.8 (1.4) |
0.240 |
-0.19 |
0.72 |
|
Women (25) |
6.4 (1.33) |
6.1 (1.2) |
0.043 |
0.01 |
0.55 |
|
When comparing the standard measuring position with the fixed pinch position, a significant difference was found. In the fixed pinch position, without synergistic action from muscles of the other fingers and wrist, the muscles of the thumb were only able to exert 59.4% of the normal pinch strength in men (6.4kg versus 10.2kg) and only 62.7% of the normal pinch strength women (3.8kg versus 6.3kg) (Table 6).
|
Normal Pinch Strength (kg) |
Fixed Pinch Strength (kg) |
Significance |
95% Confidence Interval |
||
|
Mean (SD) |
Mean (SD) |
p |
Lower Bound |
Upper Bound |
|
|
Men (n = 38) |
10.2 (1.8) |
6.4 (1.4) |
≤ 0.001 |
3.28 |
4.33 |
|
Women (n = 53) |
6.3 (1.2) |
3.8 (1.3) |
≤ 0.001 |
2.23 |
2.91 |
DISCUSSION
With respect to the forearm circumference, some studies measured it at the midpoint of the forearm length [11] or at a predetermined point along the forearm [27]. We did not do this due to the fact that, from person to person, the point at which the circumference decreases and how gradually it does so varies. Thus, to avoid undermining the anatomical variations between humans, we measured the forearm circumference at its maximum point.
Regarding age, a distinct difference was seen between the grip and pinch strength. The mean grip strength is rather stable from age 18 till the age of 60-69 for both men and women, with men’s grip strength slightly increasing (a total increase of 3.5kg) and women's grip strength slightly decreasing (a total decrease of 2.2kg) throughout the years, after which the grip strength sharply declines. This is similar to what was seen by Sternäng et al., where grip strength sharply decreased after 72 years of age for men and after 67 years of age for women [28]. However our data places the sharp decline in mean grip strength for men a few years earlier. In contrast to the mean grip strength, the mean pinch strength remains stable throughout the years, from 18 till 80 years of age, in total only decreasing 0.2kg for men and 0.6kg for women.
In contrast to what our data reveals, the UK study by Anakwe et al., concluded that there was no predictive relationship for height and weight [10]. Although they base their conclusion on a smaller study population than in our study, it is plausible that the cause for the differing results might be due to inter-population differences. Thus the follow-up question would be, what are the inter-population differences? The Anakwe et al., study population had a higher mean height for men (178cm) and women (171cm) compared to a mean height of men (172cm) and women (166cm) in our study population. While the mean grip strength in the dominant hand for the Anakwe et al., population was also higher for men (48.6kg) and women (28.5kg) compared to the mean grip strength of men (43.0kg) and women (26.4kg) in our study population [10]. Such differences were also seen in a Spain and USA based study. In the Spain based study a mean grip strength of 35.1kg for men and 22.8kg for women was observed [29], while the mean grip strength in the USA based study is 62.1kg for men and 36.7kg for women [30].
Compared to the European studies, the mean grip strength in the USA based study is noticeably higher. The method in the American study differs from the other studies in testing grip strength in all five positions of the Jamar hand dynamometer. Regardless of its position, they then selected the highest grip strength outcome as the maximum grip strength for each participant. Interestingly enough in the majority of the participants (61%) the maximum grip strength was found in position 2 of the Jamarh and dynamometer. Ultimately it is unclear which factors truly contribute to the big difference in grip strength. This is due to the lack of reported patient and anthropometric data [30].
The lack of sufficient patient and anthropometric data is a recurring shortcoming in many studies concerning grip strength. This makes it impossible to extrapolate data from studies based on other geographical populations and apply it to one's own population. This further emphasizes the importance of region-specific grip strength studies.
To our surprise the data concerning the fixed pinch strength brought new insights to the use of standard forces in cadaver studies concerning cyclic loading in the hand and wrist. Our analysis has revealed that the standard forces being used in cadaver studies are likely incorrect. The reason for this is that the fixed pinch strength forces, that we measured, are significantly higher than the standard forces being applied in cadaver studies to this day.
The Korean study states that there is a clear correlation between the hand width and the hand grip strength in men [18]. When separately analyzing this variable there indeed seems to be a correlation to hand grip strength. However when analyzing hand width as part of a single model it is no longer identifiable as a significant variable. The reason for this is that while certain variables are indicated to have a significant effect on grip strength, the degree to which they determine the grip or pinch strength in relation to other variables is so small that its contribution is relatively insignificant. The confounding effect on the separately analyzed variables is thus corrected when analyzing all variables as part of one model. Thus using the thickest forearm circumference is a more reliable indicator for assessing grip strength than using the hand width. The same is seen in Lopes et al., where hand width, which according to their study has a high independent correlation, fails to explain enough variability in the outcome when analyzed as part of one multiple regression model and is thus not used in their predictive hand strength equation [11].
As with the Korean study [18] and Brazilian study [11] we used our data to create a predictive formula, which could be used to help clinicians and researchers assess the grip and pinch strength in patients. To do this we incorporated all variables which were significant in determining the grip and pinch strength. Using linear regression we created the following formulas with age in years, height in cm, weight in kg and thickest forearm circumference in cm.
Predictive grip strength (kg) = -70.958 + (-0.139 × Age) + (8.590 × Sex (Female=1, Male=2)) + (0.307 × height) + (-0.232 × weight) + (2.431 × Thickest forearm circumference)
Predictive pinch strength (kg) = -12.619 + (1.715 × Sex (Female=1, Male=2)) + (-0.049 × weight) + (0.534 × Thickest forearm circumference) + (0.407 × Hand length)
These predictive formulas could come close to accurately predicting the grip and pinch strength but further data is necessary to further increase their accuracy.
CONCLUSION
ACKNOWLEDGEMENT
Conflicting interest
Approval ethical committee
REFERENCES
- Chau N, Petry D, Bourgkard E, Huguenin P, Remy E, et al. (1997) Comparison between estimates of hand volume and hand strengths with sex and age with and without anthropometric data in healthy work¬ing people. Eur J Epidemiol 13: 309-316.
- Dincer F, Samut G (2014) Physical examination of the hand. In: Duruöz MT (ed.). Hand function: A practical guide to assessment. Springer, New York, USA.
- Rosén B (1996) Recovery of sensory and motor function after nerve repair. A rationale for evaluation. J Hand Ther 9: 315-327.
- Wang Y, Sunitha M, Chung KC (2013) How to measure outcomes of peripheral nerve surgery. Hand Clin 29: 349-361.
- Bagis S, Sahin G, Yapici Y, Cimen OB, Erdogan C (2003) The effect of hand osteoarthritis on grip and pinch strength and hand function in postmenopausal women. Clin Rheumatol 22: 420-424.
- Kodama R, Muraki S, Oka H, Iidaka T, Teraguchi M, et al. (2016) Prevalence of hand osteoarthritis and its relationship to hand pain and grip strength in Japan: The third survey of the ROAD study. Mod Rheumatol 26: 767-773.
- Campion H, Goad A, Rayan G, Porembski M (2014) Pisiform excision for pisotriquetral instability and arthritis. J Hand Surg Am 39: 1251-1257.
- Pilný J, Kubes J, Hoza P, Mechl M, Visna P (2007) [Scapholunate instability of the wrist following distal radius fracture]. Acta Chir Orthop Traumatol Cech 74: 55-58.
- Prosser R, Herbert R, Lastayo PC (2007) Current practice in the diagnosis and treatment of carpal instability--results of a survey of Australian hand therapists. J Hand Ther 20: 239-242.
- Anakwe RE, Huntley JS, McEachan JE (2007) Grip strength and forearm circumference in a healthy population. J Hand Surg Eur Vol 32: 203-209.
- Lopes J, Grams ST, da Silva EF, de Medeiros LA, de Brito CMM, et al. (2018) Reference equations for handgrip strength: Normative values in young adult and middle-aged subjects. Clin Nutr 37: 914-918.
- Noguchi T, Demura S, Aoki H (2009) Superiority of the dominant and nondominant hands in static strength and controlled force exertion. Percept Mot Skills 109: 339-346.
- Armstrong CA, Oldham JA (1999) A comparison of dominant and non-dominant hand strengths. J Hand Surg Br 24: 421-425.
- Incel NA, Ceceli E, Durukan PB, Erdem HR, Yorgancioglu ZR (2002) Grip strength: Effect of hand dominance. Singapore Med J 43: 234-237.
- Ozcan A, Tulum Z, Pinar L, Ba?kurt F (2004) Comparison of pressure pain threshold, grip strength, dexterity and touch pressure of dominant and non-dominant hands within and between right-and left-handed subjects. J Korean Med Sci 19: 874-878.
- Petersen P, Petrick M, Connor H, Conklin D (1989) Grip strength and hand dominance: Challenging the 10% rule. Am J Occup Ther 43: 444-447.
- Günther CM, Bürger A, Rickert M, Crispin A, Schulz CU (2008) Grip strength in healthy caucasian adults: Reference values. J Hand Surg Am 33: 558-565.
- Shim JH, Roh SY, Kim JS, Lee DC, Ki SH, et al. (2013) Normative measurements of grip and pinch strengths of 21st century Korean population. Arch Plast Surg 40: 52-56.
- Heimbürger O, Qureshi AR, Blaner WS, Berglund L, Stenvinkel P (2000) Hand-grip muscle strength, lean body mass, and plasma proteins as markers of nutritional status in patients with chronic renal failure close to start of dialysis therapy. Am J Kidney Dis 36: 1213-1225.
- Nevill AM, Holder RL (2000) Modelling handgrip strength in the presence of confounding variables: Results from the Allied Dunbar National Fitness Survey. Ergonomics 43: 1547-1558.
- Josty IC, Tyler MP, Shewell PC, Roberts AH (1997) Grip and pinch strength variations in different types of workers. J Hand Surg Br 22: 266-269.
- Chong CK, Tseng CH, Wong MK, Tai TY (1994) Grip and pinch strength in Chinese adults and their relationship with anthro¬pometric factors. J Formos Med Assoc 93: 616-621.
- Firrell JC, Crain GM (1996) Which setting of the dynamometer provides maximal grip strength? J Hand Surg Am 21: 397-401.
- American Society of Hand Therapists (1992) Clinical assessment recommendations. American Society of Hand Therapists, New Jersey, USA.
- Haidar SG, Kumar D, Bassi RS, Deshmukh SC (2004) Average versus maximum grip strength: Which is more consistent? J Hand Surg Br 29: 82-84.
- Cheema T, Salas C, Morrell N, Lansing L, Reda Taha MM, et al. (2012) Opening wedge trapezial osteotomy as possible treatment for early trapeziometacarpal osteoarthritis: A biomechanical investigation of radial subluxation, contact area, and contact pressure. J Hand Surg Am 37: 699-705.
- Alahmari KA, Silvian SP, Reddy RS, Kakaraparthi VN, Ahmad I, et al. (2017) Hand grip strength determination for healthy males in Saudi Arabia: A study of the relationship with age, body mass index, hand length and forearm circumference using a hand-helddynamometer. J Int Med Res 45: 540-548.
- Sternäng O, Reynolds CA, Finkel D, Ernsth-Bravell M, Pedersen NL, et al. (2015) Factors associated with grip strength decline in older adults. Age Ageing 44: 269-274.
- Luna-heredia E, Martín-peña G, Ruiz-galiana J (2005) Handgrip dynamometry in healthy adults. Clin Nutr 24: 250-258.
- Crosby CA, Wehbé MA, Mawr B (1994) Hand strength: Normative values. J Hand Surg Am 19: 665-670.
Citation: Gachette RE, Lauwers T (2018) Grip & Pinch Strength in Relation to Anthropometric Data in Adults. J Orthop Res Physiother 4: 039.
Copyright: © 2018 Roderick Gachette, et al. This is an open-access article distributed under the terms of the Creative Commons Attribution License, which permits unrestricted use, distribution, and reproduction in any medium, provided the original author and source are credited.