Land Characteristics and Agricultural Suitability Status along a Toposequence in Santa, Bamenda Highlands, Cameroon
*Corresponding Author(s):
Primus Azinwi TamfuhDepartment Of Soil Science, Faculty Of Agronomy And Agricultural Sciences, University Of Dschang, P.O. Box 222, Dschang, Cameroon
Email:aprimus20@yahoo.co.uk
Abstract
Soil degradation is common in mountainous zones due to their rugged topography. This work aims to characterize mountainous ecosystem soils in Santa (Cameroon) and to evaluate their fertility status along the slope. Four soil profiles including P1= Dystric Protostagnic Gleysol (differentic); P2= ChromicDystric Cambisol (Clayic, differentic); P3= Chromic Dystric Cambisol (clayic, differentic); P4= Leptic Cambisol) developed on basalt were described, sampled and analyzed at four respective topographic positions (footslope, backslope, shoulder and summit).The Fertility Capability Classification (FCC) and simple limitation method senabled to identify major agricultural constraints. Results show that soil clay contents increase with increasing altitude. Also, the soil reveal moderate to high acidity, medium to very high Total Nitrogen (TN), moderate to high Organic Carbon (OC), high C/N ratio and low total available phosphorus (TAP), very low to low exchangeable Ca, low to moderate exchangeable Mg, low to very high K, medium cation exchange capacity (CEC), low exchangeable bases and low to moderate Al toxicity. The structural stability and slaking indices indicate higher soil stability for P4 and P1 compared to midslope soils. The A1 horizons are potentially more stable than the subsurface horizons due to the stabilizing effect of SOM. The Ca/Mg/K ratio reveals a relative concentration of exchangeable K and a cation imbalance. Most of the soil properties differ along the slope, probably due to differences in elevation, forms and elements of relief or slope processes. Major constraints to crop production are slope steepness (t), Al toxicity (a), high leaching potential (e), low nutrient capital reserves (k), massive clay (C), abrupt textural discontinuity (LC) and waterlogging (g). The fertility capability classes include LCaek (P4), Ctaek (P3), LCtaek (P2) and Cegk (P1).These constraints can be overcome by post-rainy season farming, contour ploughing, terracing, liming and fertilization.
Keywords
Nutrient management; Tropical soils; Toposequence; Soil quality; Slope processes
INTRODUCTION
Soil degradation is a serious problem in most developing countries especially in Sub-Saharan Africa because of its negative effect on soil fertility and nutrient balance aggravated by soil erosion [1,2]. Improper land management systems cause erosion, reduce soil fertility and often cause acidification [3,4]. In the Cameroon Western Highlands, soils are often very vulnerable due to demographic pressure associated to environmental conditions like high rainfall and uneven topography [5,6]. In such ecosystems, agricultural practices that have remained traditional for long are now being progressively modernized, leading to progressive occupation of formerly neglected areas [7]. This modernisation implies an increase in the use of fertilizers, pesticides and improvement in irrigation techniques for off-season crop production. Demographic pressure has stirred reduction of fallow time leading to soil exposure to erosion, nutrient depletion and soil acidification [8-11]. Most often, agricultural activities are conducted without proper conservation measures often resulting to soil fertility decline caused by acidification. Acid soils show excess Al3+, Mn2+ and H+ which inhibit plant root development and plant nutrient absorption [12,13]. The consequences are reduction in yields, estimated at up to 70% [14-16]. This justifies the poor agricultural yields, the extension of cultivated areas and the movement of populations towards more fertile soils in the upper parts of the mountainous ecosystems formerly reserved for grazing and horticulture [17-19]. The slope plays an essential role in increasing the diversity of soil cover [11]. Soil loss from land surfaces through erosion is thus common and affects crop production [17,20-23]. One major limiting factor to optimum crop production is the lack of in-depth information on soil and land characteristics in mountainous ecosystems. Specifically in Cameroon, works dedicated to the characterization of mountainous ecosystem soils are quite localised mostly in the Bambouto Mountains in the Cameroon Western highlands [24-26]. Some authors [26-34] have characterized the Bamenda mountain soils, but none of their works was dedicated on land fertility evaluation. The main aim of the present study is to study the morphological and physico-chemical characteristics of mountainous ecosystem soils in Santa (North West Cameroon) and to carry out a land capability evaluation along a slope gradient. The results obtained will provide data to farmers on the management strategies to be adopted on such soils for optimum soil productivity.
MATERIALS AND METHODS
Study site
Santa Sub-divisionis located in North-West Cameroon (Figure 1), precisely in the Bamenda Mountain, one of the massifs of the Cameroon Western highlands. The climate is the equatorial type (mean annual temperature of 18.5°C; average annual rainfall of 1800 mm). Rain falls from April to November and the dry seasons tretches from December to March. The topography is rugged with high hills (>2000 m asl), steep slopes and u-shaped valleys [35]. The vegetation is grassland savannah with fringes of forest along gentle slopes and valleys. Main streams are the Njong and Mbei which empty their waters into the Matazem. The major soil types are Gleysols in valley bottoms, Dystric Cambisols in hill slops and Leptic Cambisols in hill summits [30,31]. The area lies along the Cameroon Volcanic Line and major rocks are basalt (occupying >80% of the area), trachyte and rhyolite [36]; they overlie the granite-gnessic basement [34]. Almost 80% of the inhabitants practise agriculture and main crops cultivated are tubers, cereals, cabbage, carrot, and green beans, etc. 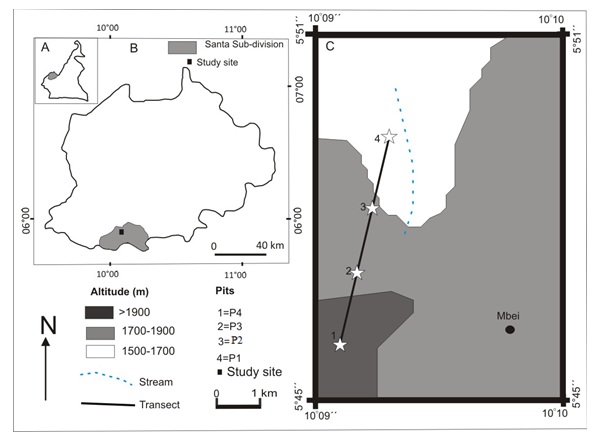
Figure 1: Map of Cameroon (A) showing the position of Santa Sub-division in the North West Region (B) and the studied site (C).
Field and laboratory procedures
Based on a reconnaissance study and several soil surveys done in the area, twenty soil profiles were studied through bore holes from less than 1500 m altitude to more than 1900 m altitude (Figure 1). Four soil profiles developed on basalts, representative of the studied area, were described and sampled along a NNE-SSW transect in the northern flank of the Santa Peak at the summit, shoulder slope, Backslope and footslope. Soil samples were stored in plastic bags and taken to the laboratory for analysis. Details of geochemistry of the basalt and soils are reported in [34]. In the laboratory, soil samples were air-dried for one week and passed through a 2 mm sieve to remove plant debris and pebbles. The physico-chemical analyses were done at the Laboratory of Soil Analysis and Chemistry of the Environment (LABASCE) of the University of Dschang (Cameroon). The soil moisture content was determined by noting the weight-loss of air-dried samples after oven-drying at 105°C for 24 hours. Bulk density (Db) and particle density (Dp) were measured by paraffin coating method and pycnometer method, respectively. Soil porosity was deduced from Db and Dp. Particlesize distribution was measured by Robinson´s pipette method. The pH-H2O was determined in a soil/water ratio of 1:2.5 and pH-KCl was dosed in a soil/KCl mixture of 1:2.5. The pHNaF was measured by the Fieldes-Perrott method [1]. The OC was measured by the Walkley-Black method [37]. TN was dosed by the Kjeldahl method while TAP was measured by concentrated nitric acid reduction method. Exchangeable cations were analysed by ammonium acetate extraction at pH=7. The CEC was measured by sodium saturation method. All these analyses were performed according to [37]. Exchangeable aluminium was evaluated by the violet pyrocathecol method [38]. Aluminium toxicity (Al toxicity) was defined by the Kamprath equation as in Eq. 1 [39].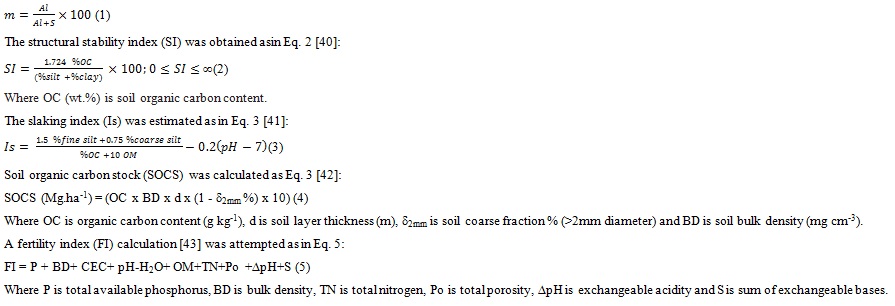 Soil requirements in basic cations were calculated using the nutrient deficiency method [43]. Soil fertility limitations and FCC units were obtained using Version 4 of FCC [44]. Limiting factors to crop production were deducted by simple parametric method [45].
RESULTS
Morphological and physical characteristics of soils along the slope
Profile P1 is located at footslope position on a Dystric Protostagnic Gleysol (differentic). It is a swampy pondy soil with two horizons, Ag and AG. The Ag horizon (0-80 cm), is dark brown (7.5YR3/3), clayey, massive and plastic with fine roots and gradual transition with the underlying BG horizon (Figure 2). The BG horizon (80-170 cm) is clayey, very dark brown (7.5YR3/4), massive and plastic with few fine roots. It is limited at the base by a perched water table 1. Profile P2 is located at the Backslope on a Chromic Dystric Cambisol (Clayic, differentic) and shows four horizons: A1, B1, B2 and C. The A1 horizon (0-20 cm) is dark brown (5YR3/4), humiferous, loose, clayey, with few rock fragments and few fine roots. The transition with the underlying B1 is sharp. The B1 horizon (20-70 cm) is reddish yellow (7.5YR7/8), clayey, granular with few fine roots. The transition with the underlying B2 is sharp. B2 (70-120 cm) is pale yellow (2.5Y7/3), clayey and massive; it transits sharply into the C horizons (>120 cm). The C horizon is a reddish yellow (7.5YR7/8), clayey, massive material, mixed with blocks of partly weathered basalt. Profile P3 is Dystric Protostagnic Gleysol (differentic). It is located at the shoulder slope and is morphologically similar to P2, but thinner. Profile P4, located at the summit is a Chromic Dystric Leptic Andic Cambisol (Differentic). It has three horizons: A1, AC and C. A1 and C are morphologically similar to those of P2. The AC (67-90 cm) horizon is yellowish brown (5YR5/6), lightly humiferous, clayey, massive to granular. It is a transition horizon between A1 and C.

Figure 2: Cross-section of the studied area showing the different soil profiles (P1, P2, P3 and P4) and their topographic positions (Summit, shoulder, Backslope and Footslope).
|
Site characteristics |
Summit |
Shoulder |
Backslope |
Footslope |
|
|
Geographic coordinates |
Longitude |
05?48?19??E |
05?48?18??E |
05?48?18??E |
05?48?20??E |
|
Latitude |
10?09?02??E |
10?09?06??N |
10?09?11??N |
010?09?15??N |
|
|
Altitude (m) |
2063 |
1891 |
1895 |
1508 |
|
|
Mean slope % (class) |
2 (Very gentle) |
12 (steep). |
10 (steep) |
<1(sub-horizontal) |
|
|
Mean annual precipitation (mm) |
1992 |
1890 |
1780 |
1622 |
|
|
Mean annual temperature (?C) |
17.56 |
18.34 |
18.77 |
19.16 |
|
|
Vegetation |
Grassed Savannah with stunted trees |
Grassed Savannah with stunted trees |
Grassed Savannah with stunted trees |
Grassed Savannah |
|
|
Parent rock |
Basalt, melanocratic, blocky and composed of olivine, clinopyroxene and rarely plagioclase and an abundant groundmass. |
Basalt, colluvial deposits |
|||
|
Soil type [50] |
Leptic Cambisol |
Chromic dystric Cambisol |
Chromic dystric Cambisol |
Dystric Protostagnic Gleysol |
|
|
Soil use |
Subsistence farming |
Subsistence farming |
Subsistence farming |
Market gardening |
|
|
State of erosion |
Moderate |
Moderate |
Moderate |
Mild |
|
|
Human influence |
Burning, tilling |
Burning, tilling |
Burning, tilling |
Clearing, tilling, furrow and sprinkler irrigation, fertilization. |
|
Table 1: Studied site characteristics
Physically, all soil profiles display a wide range of textural variations from P1 to P4. Clay content increases with profile depth and elevation (Table 2). The particle density ranges from 2.4 to 2.6 gcm-3. The bulk density is highest in P1 while P2 and B1 of P4 show the lowest values. The total porosity ranges from 29 to 40%, with BG of P1 showing lowest porosity. The slaking indices vary from 0.28 to 0.63. The structural stability indices range from 1.48 to 11.95. All surface horizons show a SSI above 9 (except A1 of P3) and are thus structurally stable. For B1 horizons, that of P1 shows a high risk of structural degradation, while there maining profiles show structurally degraded B1 horizons.
|
Soil (depth in cm)
Soil characteristics |
P1 |
P2 |
P3 |
P4 |
|||||||||
|
Ag (0-80) |
BG (80-150) |
A1 (0-20) |
B1 (20-70) |
B2 (70-120) |
A1 (0-25) |
B1 (25-65) |
B2 (65-160) |
A1 (0-30) |
AC (30-67) |
||||
|
Physical properties |
|||||||||||||
|
Sand |
Fine sand |
9 |
2 |
21 |
8 |
30 |
12 |
18 |
12 |
26 |
11 |
||
|
Coarse sand |
6 |
3 |
17 |
13 |
20 |
10 |
11 |
20 |
22 |
19 |
|||
|
Silt |
Fine silt |
10 |
9 |
16 |
20 |
4 |
19 |
16 |
14 |
8 |
13 |
||
|
Coarse silt |
15 |
13 |
13 |
11 |
7 |
18 |
7 |
20 |
10 |
11 |
|||
|
Clay |
61 |
69 |
33 |
48 |
38 |
41 |
48 |
34 |
38 |
46 |
|||
|
Texture |
Heavy clay |
Heavyclay |
Clay loam |
Clay |
Sandy clay |
Clay |
Clay |
Clay loam |
Sandy clay loam |
Clay |
|||
|
Particle density (g/cm3) |
2.40 |
2.40 |
2.50 |
2.50 |
2.60 |
2.50 |
2.50 |
2.60 |
2.50 |
2.60 |
|||
|
Bulk density (g/cm3) |
1.70 |
1.70 |
1.50 |
1.50 |
1.60 |
1.60 |
1.60 |
1.70 |
1.50 |
1.60 |
|||
|
Porosity (%) |
29.17 |
29.17 |
40.00 |
36.00 |
36.00 |
36.00 |
36.00 |
35.00 |
40.00 |
38.46 |
|||
|
Moisture content (%) |
28.00 |
34.00 |
12.2 |
11.32 |
8.12 |
16.92 |
18.01 |
17.09 |
14.22 |
15.03 |
|||
|
Structural stability index |
11.91 |
6.89 |
10.11 |
1.90 |
1.73 |
8.04 |
1.48 |
1.13 |
11.95 |
4.84 |
|||
|
Slaking index |
0.48 |
0.44 |
1.18 |
0.94 |
0.71 |
1.20 |
0.94 |
0.34 |
0.73 |
0.88 |
|||
|
Chemical properties |
|||||||||||||
|
pH-water |
5.70 |
5.80 |
5.30 |
5.60 |
5.9 |
5.10 |
4.80 |
5.9 |
5.40 |
5.10 |
|||
|
pH-KCl |
5.00 |
4.50 |
4.80 |
4.40 |
5.1 |
4.40 |
4.50 |
5.0 |
4.50 |
4.50 |
|||
|
ΔpH |
0.7 |
1.3 |
0.5 |
1.2 |
0.8 |
0.7 |
0.3 |
0.9 |
0.9 |
0.6 |
|||
|
pHNaF |
7.6 |
7.9 |
8.6 |
9.9 |
9.6 |
10.1 |
9.8 |
10.3 |
9.5 |
10.1 |
|||
|
Organic carbon (%) |
5.94 |
3.64 |
3.64 |
1.87 |
0.3 |
3.64 |
0.61 |
0.2 |
3.88 |
1.96 |
|||
|
Total nitrogen (g/kg) |
3.51 |
2.21 |
0.96 |
2.63 |
0.04 |
1.74 |
0.28 |
0.02 |
1.91 |
0.51 |
|||
|
Exchangeable bases ( cmolckg-1 of soil) |
Calcium |
4.96 |
4.44 |
2.12 |
1.84 |
1.72 |
1.8 |
2.92 |
1.99 |
1.48 |
1.68 |
||
|
Magnesium |
2.08 |
2.01 |
1.44 |
1.68 |
1.32 |
1.6 |
0.8 |
1.21 |
1.72 |
0.96 |
|||
|
Potassium |
2.64 |
2.7 |
1.52 |
2.82 |
1.03 |
0.21 |
1.06 |
0.92 |
1.48 |
3.14 |
|||
|
Sodium |
0.08 |
0.03 |
0.08 |
0.04 |
0.12 |
0.07 |
0.03 |
0.12 |
0.04 |
0.09 |
|||
|
Sum of exchangeable bases |
9.76 |
9.18 |
5.34 |
6.38 |
4.19 |
5.68 |
7.81 |
4.24 |
7.92 |
8.67 |
|||
|
CEC pH7(cmolc+kg-1 of soil) |
19.70 |
20.11 |
15.68 |
15.8 |
12.45 |
13.2 |
13.76 |
10.20 |
14.08 |
14.8 |
|||
|
Base Saturation (%) |
49.49 |
45.65 |
32.91 |
37.98 |
35.60 |
40.38 |
34.96 |
41.56 |
33.52 |
39.66 |
|||
|
Available P (mg/kg) |
22.58 |
11.033 |
14.018 |
4.41 |
1.22 |
8.96 |
6.11 |
5.52 |
11.68 |
4.67 |
|||
|
Exchangeable Al ( cmolc+kg-1 ) |
6 |
11 |
113 |
21 |
1.93 |
123 |
117 |
2.23 |
102 |
107 |
|||
|
Al toxicity (%) |
1.61 |
3.27 |
28.51 |
3.19 |
31.5 |
23.35 |
21.74 |
33.4 |
16.10 |
19.27 |
|||
|
Electrical conductivity (mS/cm) |
0.03 |
0.02 |
0.02 |
0.01 |
0.11 |
0.02 |
0.01 |
0.03 |
0.04 |
0.02 |
|||
|
Exchangeable sodium % |
0.43 |
0.15 |
0.51 |
0.25 |
2.82 |
0.53 |
0.22 |
2.8 |
0.28 |
0.61 |
|||
Table 2: Soil physical and chemical properties
Soil Chemical properties and fertility indices
Chemically, soil pH-H2O varies from 4.8 to 5.8, marked by a slight increase with depth for P1 and P2 contrary to P3 and the P4 (Table 2). The pH-KCl values are slightly lower than the pH-H2O. The TN is medium to very high for all surface horizons but low for the subsurface horizons. P1 shows higher TN contents compared to the other profiles. Exchangeable Ca is the most abundant exchangeable cation (1.48-4.96 cmolc kg-1). It increases lightly with depth for P1 and P2 while a reverse trend is observed for P3 and P4. Exchangeable Mg ranges from 0.8 to 2.08 cmolc kg-1. Apart from P4, slight decrease in Mg with profile depth is noticed for all profiles. The highest Mg levels appear in P1 while the lowest ones appear in B1 of P3. Exchangeable K varies from 0.21 to 3.14 cmolc kg-1; it increases with depth for all profiles. The A1 horizons of P4 shows the highest exchangeable K, but the lowest levels occur in P3 and P2. Exchangeable Na contents range from 0.03 to 0.12 cmolckg-1. The sum of exchangeable bases varies from 4.24 to 9.76 cmolckg-1 and the highest values appear in P1 and P4, while the lowest ones appear at P2 and P3. CECpH7 varies from 12.4 to 20.11 cmolckg-1. The highest values appear in P1 while the lowest one occurs at P3. The soil CEC varies lightly with profile depth but also decreases with elevation. The base saturation varies from 32.91 to 49.49%. P1 and P3 show a slight decrease in BS with depth while P2 and P4 portray a slight increase with depth. Available P ranges from 4.42 to 22.58 mgkg-1; these values are low for all horizons except for A1 of P1. Al toxicity ranges from 1.61 to 28.51%, varies irregularly with profile depth and increases with elevation.
Concerning fertility indices, The silt/clay ratios vary from 0.31 to 1.46; ratios of P1, P3 and P4 are low (0.31-0.52<0.75) and those of P3 are high (0.88-1.46>0.75). The C/N ratios range from 7 to 38 (Table 3). The TN/pH-H2O ratios vary from 0.003 to 0.62. All these ratios reduce from A1 to sub-surface layers in all profiles, except for P2. The N/P ratios vary from 36.23 to 595.83. The C/P ratios range from 362.23 (B2 of P3) to 4194 (B1 of P2). The Mg/K ratio fluctuates between 0.31 and 7.62.The Mg/K values are less than 1 for all profiles, except for A1 of P3 and A1 of P4.The Ca/Mg ratios vary between 0.86 and 3.35. Although B1 horizon of P3 shows the highest Ca/Mg ratio, these values are higher for P1. The lowest Ca/Mg ratio appears in A1 of P4. The Ca/Mg/K ratios reveal a strong relative concentration of exchangeable K in all the profiles, generally varying from 4.55 to 9.05. The Forestier’s fertility indices (F) range from 0.54 to 1.36 for all profiles. The Fertility Index (FI) ranges from 711.70 (B1 of P3) to 103.06 (A1 of P1). All FI values of A1 horizons are higher than those of B1. For each of these horizons, lower values are observed for P2 and P3. The SOCS range from 19.89 to 433.16 Mg.ha-1, and the highest values appear in P1 (297.73-433.16 Mg.ha-1) and P4 (171.79-216.49 Mg.ha-1) while P2 and P3 show lower values at the surface.
|
Ratios and indices |
Silt/clay ratio |
C/N |
TN/pH |
N/P |
C/P |
Mg/K |
Ca/Mg |
Base saturation |
Ca/Mg/K |
CRC |
F |
FI |
SOCS |
|
|
|
||||||||||||||
|
P1 |
||||||||||||||
|
Ag (0-80 cm) |
0.43 |
17 |
0.62 |
155.45 |
2630.65 |
0.79 |
2.38 |
49.49 |
51.24/21.49/27.27 |
0.67/1.19/4.55* |
1.34 |
103.06 |
793.95 |
|
|
BG (80-150 cm) |
0.31 |
16 |
0.38 |
200.31 |
3299.19 |
0.74 |
2.21 |
45.65 |
48.52/21.97/29.51 |
0.64/1.22/4.92* |
1.08 |
86.77 |
433.16 |
|
|
P2 |
||||||||||||||
|
A1 (0-20 cm) |
0.88 |
38 |
0.18 |
68.48 |
2596.66 |
0.95 |
1.47 |
32.91 |
41.73/28.35/29.92 |
0.55/1.57/4.99* |
0.58 |
89.57 |
107.74 |
|
|
B1 (20-70 cm) |
1.46 |
3 |
0.47 |
595.83 |
4236.52 |
0.6 |
1.1 |
37.98 |
29.02/26.50/44.48 |
0.38/1.47/7.41* |
0.85 |
75.02 |
56.1 |
|
|
B2 (>120 cm) |
0.29 |
7.5 |
0.006 |
333,33 |
2500 |
1.28 |
1.3 |
33.7 |
42.2/32.4/25.6 |
0.56/1.77/4.26 |
0.25 |
76.17 |
ND |
|
|
P3 |
||||||||||||||
|
A1 (0-25 cm) |
0.44 |
21 |
0.34 |
194.28 |
4064.31 |
7.62 |
1.13 |
40.38 |
49.86/44.32/5.82 |
0.66/2.46*/0.97 |
0.54 |
79.25 |
272.8 |
|
|
B1 (65-160 cm) |
0.4 |
21 |
0.06 |
45.89 |
999.84 |
0.75 |
3.35 |
34.96 |
61.09/16.74/22.18 |
0.80/0.93/3.70* |
1.03 |
71.7 |
24.4 |
|
|
B2 (>160 cm) |
1,00 |
10 |
0.003 |
36.23 |
362.23 |
1.64 |
1.64 |
41.5 |
48.3/29.0/22.7 |
0.64/2/3.8 |
0.38 |
73.1 |
19.89 |
|
|
P4 |
||||||||||||||
|
A1 (0-30 cm) |
0.47 |
20 |
0.35 |
163.5 |
3321.35 |
1.16 |
0.86 |
33.52 |
31.62/36.75/31.62 |
0.42/2.04/5.27* |
1.36 |
90.08 |
229.05 |
|
|
AC (30-67 cm) |
0.52 |
38 |
0.1 |
109.14 |
4194.31 |
0.31 |
1.75 |
39.66 |
29.07/16.61/54.33 |
0.38/0.92/9.05* |
1.27 |
77.8 |
92.78 |
|
*: most concentrated element that determines the direction of equilibrium; CRC: coefficient of relative concentration; F: Forestier’s Index ((Sum of bases2/(Clay+fine silt)); FI: fertility index; SOCS: soil organic carbon stocks.
Table 3: Nutrient ratios and fertility indices
DISCUSSION
Soil distribution and characteristics along the toposequence
Morphologically, soils along transect vary in terms of colour, texture, structure and thickness. Slope is the dominant pedogenic process in these soils as it contributes run off and translocation of materials downslope via erosion and movement of materials [46, 47]. This transported and accumulated material leads to progressively deeper and finer texture soils with decreasing elevation. P1 developed on a swampy valley at footslope shows a dark colour due to reduction conditions imposed by hydromorphism; P2 and P3 with reddish yellow colours portray effect of iron under oxidizing conditions [31]. P4 is young soil with no diagnostic horizons whose properties are still similar to those of the parent basalt. Soil diversity along the toposequence has also attributed to difference in elevation, in the forms and elements of relief, or due to slope processes [2,17,48].
The low (<0.75) silt/clay ratios of P1, P2 and P4 probably portray old age pedogenic processes, while moderate ratio (>0.75) of P3 shows moderate age pedogenic processes [49]. All soil profiles show a silt/clay greater than 0.15 indicating relatively young soils with low degree of weathering [49]. The low slaking indices (SI
The studied soils show moderate to very high acidity and the pH-KCl is considerably lower than pH-H2O indicating abundance of exchangeable acidity [43]. The A1 horizons show very high OC probably due to an earlier release of amorphous allophane and ferrihydrite which stabilise organic compounds [1,2,24]. This is confirmed by high pHNaF (≥9.5) in most horizons, portraying andosolic features [18,24]. P1 shows outstandingly high TN contents compared to the rest of the soils of the different profiles. Exchangeable Ca, the most abundant base, is very low to low [49]. The sum of exchangeable bases is low probably due to leaching processes favoured by steep [24,52]. The soil CEC is slightly higher than values of pure kaolinite possibly due to contribution of soil OM. The base saturation is low to moderate [49]. The available Pi slow for all the soil horizons except for Ag of P1 and such low values are typical of acid soils [6,50]. Phosphorus availability might be hindered by its fixation by free Al and Fe [7]. Low (R<0.2) to moderate (0.3-0.3) CEC/clay ratios reflect a predominant kaolinitic mineralogy [1,2,51].
Fertility status of the Santa soils and management strategies
The high C/N ratios, except for B1 of P1 and P2, show poorly evolved and poor quality organic matter [49]. A decrease in TN/pH ratios with profiles depths reflects a decrease in soil fertility with depth [51]. The very high N/P ratios reveal a potential unavailability of P and TN to plants [43,49]. The high C/P ratios (>200) for all profiles portrays slow turn-over of soil available phosphorus [12,52-54]. Except for A1 of P3 with balanced Mg/K ratios, all profiles portray a cation imbalance and a potential risk of Mg deficiency [52]. The Ca/Mg ratios (>2) of P1 and B1 of P3 suggest a potential cation balance between Mg and Ca [53], while the rest of the horizons deficiency show a low Ca/Mg ratio (<2), indicating a potential Ca and Mg deficiency [49,52]. The Ca/Mg/K equilibrium reveals a high relative concentration of exchangeable K in all profiles, depicting unbalanced cation equilibrium relative to the ideal situation of 76% Ca, 18 % Mg and 6 % K for optimum plant nutrient uptake [49]. Exchangeable Ca is the deficient base in all profiles; requiring 280.50 tons ha-1 in P1, 1460 tons ha-1 in P2, 107.05 tons ha-1 (plus 34.81 tons ha-1 of exchangeable K) in P3 and 205.20 tons ha-1 in P4 required to raise the base saturation to 50% at 20 cm depth (Figure 3), in agreement with [14,32]. The high Forestier’s indices (F>1) for P1 and P4 and moderate for P2 and P3 (0.3<F<1) are consistent with leaching of basic cations along the slope [8]. The Fertility Index (FI) shows that the soil horizons fall within the range of moderately fertile soils, except for B1 of P3 that falls under low fertility class [54].SOCS decreases with elevation to P3, before increasing at P4; this parameter also decreases with profile depth. SOCS variation is attributed on OM, gravel and/or the bulk density [55,56]. The difference in soil properties could be due to difference in elevation, forms and elements of relief and/or slope processes [4].
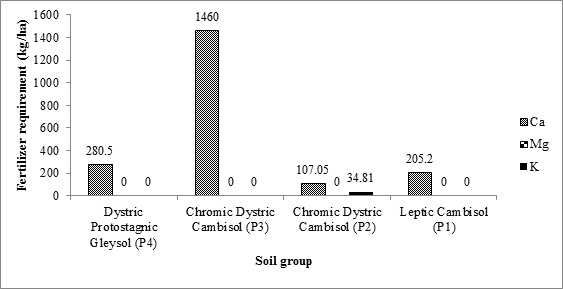 Figure 3: Recommended fertilizer doses required to raise soil base saturation to 50% for the 30 cm depth with a Ca/Mg/K rate of 76/18/6 for the different soils.
The FCC of [44,57] reveals that major limitations to crop production for P4 are Al toxicity (a), high leaching potential and low nutrient reserves (Table 4). P2 and P3 show slope steepness (t), Al toxicity (a), high leaching potential (e) and low nutrient reserves (k) are major constraints, meanwhile constraints of P1 are massive clay (C), Al toxicity (a), waterlogging (g) and low nutrient reserve (k). Also, P3 displays a textural discontinuity (LC) at the surface 30 cm depth. The fertility capability classes are LCaek (P4), Ctaek (P3), LCtaek (P2) and Cegk (P1).Similar findings have been reported [3,51,58].
|
Categorical levels |
P1 |
P2 |
P3 |
P4 |
|
|
Type |
C |
L |
C |
L |
|
|
Substrata type |
- |
C |
- |
C |
|
|
Modifiers |
t |
- |
+ |
+ |
- |
|
a |
+ |
+ |
+ |
+ |
|
|
b |
- |
- |
- |
- |
|
|
e |
+ |
+ |
+ |
||
|
g |
+ |
- |
- |
- |
|
|
k |
+ |
+ |
+ |
+ |
|
|
m |
- |
- |
- |
- |
|
|
v |
- |
- |
- |
- |
|
|
FCC |
Cagk |
LCtaek |
Ctaek |
LCaek |
|
C : clay; t: slope; a : aluminium toxicity; b : basic reaction; e : high leaching potential; g : water logging; k: low nutrient capital reserve; m : organic matter depletion; v : vertic properties; + : greater expression of the modifier; - : lesser expression of the modifier.
Table 4: Soil fertility limitations and fertility capability classification (FCC) units in reference to [44].
The study of the soil’s suitability for the cultivation of maize, huckleberry, beans and groundnut reveals that precipitation during the growing period and mean annual temperature show slight limitations (Table 5). The total annual precipitation shows very severe limitation to growth of groundnut and huckleberry and severe limitation to maize and beans growth. Slope steepness constitutes a severe limitation for P2 and P3, but no limitation at P4 and P1 due to gentle slope. Except for P1 with very severe limitation, drainage and flooding show no limitation. The texture/structure reveals moderate limitation for maize at P4 and huckleberry at P1, groundnut and maize at P1, and a severe limitation at P1. Base saturation, sum of bases and CEC show a moderate limitation for the cultivation of all four crops at P4 and P1 but constitutes a slight limitation for P3 and P1. The soil pH-H2O is moderately suitable whiles oil depth, % rock fragments and O Care very suitable.
|
Soil
Land Characteristics |
P4 |
P3 |
P2 |
P1 |
|||||||||||||
|
Groundnut |
Huckleberry |
Maize |
Beans |
Groundnut |
Huckleberry |
Maize |
Beans |
Groundnut |
Huckleberry |
Maize |
beans |
Groundnut |
Huckleberry |
Maize |
Beans |
||
|
Climate during crop cycle (c) |
|||||||||||||||||
|
Precipitation (mm) |
S1-1 |
S1-1 |
S1-1 |
S1-0 |
S1-1 |
S1-1 |
S1-1 |
S1-0 |
S1-1 |
S1-1 |
S1-1 |
S1-1 |
S1-1 |
S1-1 |
S1-1 |
S1-1 |
|
|
Mean Temperature (°C) |
S1-1 |
S1-1 |
S1-1 |
S1-1 |
S1-1 |
S1-1 |
S1-1 |
S1-1 |
S1-1 |
S1-1 |
S1-1 |
S1-1 |
S1-1 |
S1-1 |
S1-1 |
S1-1 |
|
|
Annual Precipitation (mm) |
N2 |
N2 |
S3 |
S3 |
N2 |
N2 |
S3 |
S3 |
N2 |
N2 |
S3 |
S3 |
S3 |
N2 |
S3 |
S3 |
|
|
Topography (t) |
|||||||||||||||||
|
Slope (%) |
S1-0 |
S1-0 |
S1-0 |
S1-0 |
S3 |
S3 |
S3 |
S3 |
S3 |
S3 |
S3 |
S3 |
S1-0 |
S1-0 |
S1-0 |
S1-0 |
|
|
Wetness (w) |
|||||||||||||||||
|
Flooding |
S1-0 |
S1-0 |
S1-0 |
S1-0 |
S1-0 |
S1-0 |
S1-0 |
S1-0 |
S1-0 |
S1-0 |
S1-0 |
S1-0 |
N2 |
N2 |
N2 |
N2 |
|
|
Drainage |
S1-0 |
S1-0 |
S1-0 |
S1-0 |
S1-0 |
S1-0 |
S1-0 |
S1-0 |
S1-0 |
S1-0 |
S1-0 |
S1-0 |
N2 |
N2 |
N2 |
N2 |
|
|
Soil physical characteristics (s) |
|||||||||||||||||
|
Texture/structure |
S1-1 |
S1-1 |
S2 |
S1-0 |
S1-1 |
S2 |
S1-1 |
S1-1 |
S1-1 |
S2 |
S1-0 |
S3 |
S2 |
S3 |
S2 |
S3 |
|
|
Course fragments (%) |
S1-0 |
S1-0 |
S1-0 |
S1-0 |
S1-0 |
S1-0 |
S1-0 |
S1-0 |
S1-0 |
S1-0 |
S1-0 |
S1-0 |
S1-0 |
S1-0 |
S1-0 |
S1-0 |
|
|
Soil depth (cm) |
S1-0 |
S1-0 |
S1-0 |
S1-0 |
S1-0 |
S1-0 |
S1-0 |
S1-0 |
S1-0 |
S1-0 |
S1-0 |
S1-0 |
S1-0 |
S1-0 |
S1-0 |
S1-0 |
|
|
Soil fertility (f) |
|||||||||||||||||
|
S (cmolckg-1) |
S2 |
S2 |
S2 |
S2 |
S2 |
S2 |
S2 |
S2 |
S2 |
S2 |
S2 |
S2 |
S1-0 |
S1-0 |
S1-0 |
S1-0 |
|
|
CEC (cmolckg-1) |
S2 |
S2 |
S2 |
S2 |
S1-1 |
S1-1 |
S1-1 |
S2 |
S1-1 |
S1-1 |
S1-1 |
S2 |
S1-0 |
S1-0 |
S1-0 |
S1-0 |
|
|
Base saturation (%) |
S2 |
S2 |
S2 |
S2 |
S1-1 |
S1-1 |
S1-1 |
S1-1 |
S2 |
S2 |
S2 |
S2 |
S1-1 |
S1-1 |
S1-1 |
S2 |
|
|
pH (H2O) |
S2 |
S2 |
S2 |
S2 |
S2 |
S2 |
S2 |
S2 |
S2 |
S2 |
S2 |
S2 |
S1-1 |
S1-1 |
S1-1 |
S1-1 |
|
|
OC (%) |
S1-0 |
S1-0 |
S1-0 |
S1-0 |
S1-0 |
S1-0 |
S1-0 |
S1-0 |
S1-0 |
S1-0 |
S1-0 |
S1-0 |
S1-0 |
S1-0 |
S1-0 |
S1-0 |
|
|
Salinity (n) |
|||||||||||||||||
|
ESP (%) |
S1-0 |
S1-0 |
S1-0 |
S1-0 |
S1-0 |
S1-0 |
S1-0 |
S1-0 |
S1-0 |
S1-0 |
S1-0 |
S1-0 |
S1-0 |
S1-0 |
S1-0 |
S1-0 |
|
|
Suitability class |
|||||||||||||||||
|
Class |
S2fS3fN2c |
S2fN2c |
S2fsS3cS2f |
S2fS3cS2f |
S2fS3cS2f |
S2tsfN2 |
S2fS3ct |
S2fS3ct |
S2fS3tN2c |
S2fsS3tN2c |
S2fS3ct |
S2fS3sct |
S2sS3cN2c |
S3sN2wc |
S2sS3cN2wc |
S2fS3scN2w |
|
S1-0: no limitation, very suitable, optimal yield (95-100%); S1-1: slight limitation, suitable, almost optimal yield (85-95%); S2: moderate limitation, moderately suitable, acceptable yield (60-85%); S3: severe limitation, marginally suitable, low yield (40-60%); N1: very severe limitation, not recommended, but potentially suitable, unacceptable, very low yield (25-40%); N2: very severe limitation, not recommended, potentially not suitable, unacceptable yield (0-25%).
Table 5: Soil suitability for the cultivation of maize, beans, groundnuts and huckleberry by simple parametric method [26,44].
CONCLUSION
In Santa (Bamenda Highlands), soils are deep, moderately acidic, very humiferous, and clay content decreases with elevation. Four soil units (with increasing elevation) were identified including Dystric Protostagnic Gleysol (footslope), Chromic Dystric Cambisol (backslope), Chromic Dystric Cambisol (elbow) and Leptic Cambisol (summit) developed on basalt. The potentially high structural stability and low slaking potential eflect is due to high organic matter and clay contents at the surface, but resistance overcome by erosion imposed by steep slope. Soil variability is based on increase in elevation, forms and elements of relief, and slope processes. Major constraints to crop growth are Al toxicity (a), high leaching potential (e), low nutrient reserves (k), abrupt textural changes (LC), massive clay (C), waterlogging (g) and steep slope. Soil FCC classes are LCaek (P4), Ctaek (P3), LCtaek (P2) and Cegk (P1). Some measures to overcome constraints are post-rainy season farming, contour ploughing, terracing, fertilisation and liming.
ACKNOWLEDGEMENTS
The authors address special thanks to Prof. Désiré Tsozué (Department of Earth Sciences, University of Maroua, Cameroon) for naming the soil types according to WRB classification.
FUNDING
This piece of work did not receive any funding.
CONFLICT OF INTEREST
The authors did not declare any conflict of interests.
REFERENCES
- Fieldes M, Perrott KW (1966) The nature of allophane in soi1s, New Zealand. Journal of Science 9: 623-629.
- Ibrahim M, HanK, Ha S, ZhangY, HurS (2012) Physico-chemical characteristics of disturbed soils affected by accumulate of different textures in South Korea. Sains Malays 4: 285-291.
- Tematio P, Tsafack EI, Kengni L (2011) Effects of Tillage, Fallow and Burning on Selected Properties and Fertility Status of Andosols in the Mounts Bambouto, West Cameroon. Agricultural Sciences 2: 334-340.
- Tsozué D, Tematio P, Azinwi Tamfuh P (2016) Relationship between Soil Characteristics and Fertility Implications in Two Dystrandept Soils of the Cameroon Western Highland. International Journal of Soil Science 11: 36-48.
- Tsozué D, Azinwi Tamfuh P, Bonguen SMN (2015) Morphology, physicochemical characteristics and land suitability in the Western Highlands of Cameroon. International Journal of Plant and Soil Science 7: 29-44.
- Tsozué D, Nghonda JP, Tematio P, Basga SD (2019) Changes in soil properties and soil organic carbon stocks along an elevation gradient at Mount Bambouto, Central Africa. Catena 175: 251–262.
- Tematio P, Olson KR (1997) Impacts of industrialized agriculture on land in Bafou, Cameroon. Journal of Soil and Water Conservation 52: 404-405.
- Bindzi TJ (1987) Les sols rouges du Cameroun. MEISRES-FAO, Yaoundé, Cameroon.
- Sama A (1989) Acidification des sols sous culture. Valorisation de la Dolomie de TiaraIDRIVO, Yaoundé, Cameroon.
- kiki AR, Yemefack M, Tchienkoua (2002) Caractéristique biophysique et aptitude a la production végétale, animale et IRAD, Yaoundé, Cameroun.
- Getachew E, Mohammed A, Tesfaye A, Nebiyu A (2014) Growth and yield response of green beans (Phaseolus vulgaris L.) in relation to time of sowing and plant spacing in the humid tropics of Jimma, southwest Ethiopia. International Journal of Soil and Crop Sciences 2(7): 22-23.
- Brady NC, Weil RR (2014) The Nature and properties of soils. Prentice Hall, New York, USA.
- Lal R (2004) Soil Carbon Sequestration to Mitigate Climate Change. Geoderma 123: 1-22.
- Thé C, Calba H, Zonkeng C, Ngonkeu ELM, Adetimirin VO, Mafouasson HA, Meka SS, Horst WL (2006). Response of maize grain yield to changes in acid characteristics after soil amendments. Plant and Soil 284: 45-57.
- Kamga TR, Kouamé C, Atangana AR, Chagomoka T, Ndango R (2013) Nutritional evaluation of five African indigenous vegetables. Journal of Horticultural Research 21: 99-106.
- Bekele A, Kibret K, Bedadi B, Balemi T, Yli-Halla M (2018) Effects of lime, vermicompost and chemical P fertilizer on yield of maize in Ebantu District, Western Highlands of Afri J Agricultural Research 13: 477-489.
- Pimentel D, Harvey C, Resosudarmo P, Sinclair K, Kurz D, et al. (1995) Environmental and Economic Costs of Soil Erosion and Conservation Benefits. Science 267: 1117-1123.
- Tematio P, Kengni L, Bitom D, Hodson M, Fopoussi JC, et al (2004) Soils and their distribution on the Bambouto Volcanic Mountain, West Cameroon Highland, Central Africa. Journal of African Earth Sciences 39: 447-457.
- Tematio P, Fritsch E, Hodson ME, Lucas Y, Bitom D, et al. (2009) Mineral and Geochemical Characterization of a Leptic Aluandic Soil and a Thapto Aluandic-Ferralsol Developed on Trachytes in Mount Bambouto (Cameroon Volcanic Line). Geoderma 152: 314-323.
- Tsozué D, Bitom D, Lucas Y (2009) Biogeochemistry of Iron, Aluminium and Silicon in Humid Tropical Mountainous Soils (Bambouto Mountain, West Cameroon). The Open Geology Journal 3: 70-81.
- Pimentel D, Kounang N (1998) Ecology of Soil Erosion in Ecosystems. Ecosystem 1: 416-426.
- Pimentel D (2006) Soil Erosion: A Food and Environmental Threat, Environmental Development and Sustainability 8: 119-137.
- Tsozué D, Yakouba O (2016) Properties, Classification, Genesis and Agricultural Suitability of Soils in a Semiarid Pediplain of North Cameroon. African Journal of Agricultural Research 11(36): 3471-3481.
- Leumbe Leumbe O, Bitom D, Tematio P, Temgoua E, Lucas Y (2005) Study of Andic Ferrallitic Soils on Trachyte in the Humid Mountain Zone (Bambouto Mountains-West Cameroon). Etude et Gestion des sols 4: 313-26.
- Temgoua E, Djoukouo J, Likeng JDH, Tematio P (2014) Structural Stability of Andi sols and Andic Ferralsols from Mount Bambouto, West Cameroon Highlands. Journal of Experimental Biology 10: 26-34.
- Fogwe NZ (1990) The Ndop-Sabga Great Erosional Arc. Landslide and Erosional Risk. The University of Yaoundé,Yaoundé,
- Afungang RN (2010) Erosion, Mass Movement and Landscape Dynamics. Case Study of the Mezam Highlands. University of Yaoundé 1, Yaoundé, Cameroon.
- Afungang RN, Nkwemoh CA,. Ngoufo R (2017) Spatial modelling of landslide susceptibility using logistic regression Model in the Bamenda Escarpment zone, NW Cameroon. International journal of innovative research and development 6(12): 187-199.
- Guedjeo CS, Kagou Dongmo A, Ngapgue F, Nkouathio DG, Zangmo Tefogoum G, et al. (2012) Natural Hazards along the Bamenda Escarpment and Its Environs: The Case of Landslide, Rock Fall and Flood Risks. Journal of Geology and Mining Research 2: 15-26.
- Tita MA, Azinwi Tamfuh P, Wotchoko P, Magha MA, Bienkaa Azinwi R (2015) Micronutrient Composition of Soils and Supported Solanum scabrum in Bafut Sub-Division (North-West Cameroon). Int j Plant and Soil Science 9: 1-14.
- Dioh NL (2016) A comparative study of changes in soil quality under two cropping systems in Santa, North West region, Cameroon. PAID-WA, Buea, Cameroon.
- Azinwi Tamfuh P, Tsozué D, Tita MA, Boukong A, Ngnipa Tchinda R, et al. (2017) Effect of Topographic Position and Seasons on the Micronutrient Levels in Soils and Grown Huckleberry (Solanum scabrum) in Bafut (North-West Cameroon), World Journal of Agricultural Research 5: 73-87.
- Azinwi Tamfuh P, Temgoua E, Wotchoko P, Boukong A, Bitom D (2018) Soil Properties and Land Capability Evaluation in a Mountainous Ecosystem of North-West J Geoscience and Environment Protection 6: 15-33.
- Dongmo AK, Guedjeo CS, Azinwi Tamfuh P, Wotchoko P, Chenyi ML, et al. (2018) Geochemical and geotechnical characterization of soils developed on volcanic rocks in the Bamenda Mountain (Cameroon volcanic line). Int J Advanced Geosciences 6: 184-191.
- Morin S (1988) Les Dissymétries Fondamentales des Hautes Terres de l'Ouest-Cameroun et leurs Conséquences sur l'occupation Humaine. Exemple des Monts Bambouto.
- Kamgang P (2003) Pétrologie et Géochimie d’un Secteur Clé de la Ligne du Cameroun, Les Monts Bamenda: Implications sur la Genèse et l’évolution des Magmas. Ph.D Thesis, University of Yaoundé 1, Yaoundé, Cameroon.
- Reeuwij VKL (2002) Procedures for soil analysis, ISRIC-FAO, Wageningen, Netherlands.
- SSA (1996) Aluminium.In: Methods of soil analysis, Sparks DL (Ed), Chemical Methods, Chapter 18 pp.517-550), SSA, Madison, USA.
- Kamprath (1972) Soil Acidity and Liming, National Academic of Science, Washington, DC, USA.
- Pieri CJMG (1992) Fertility of Soils: a Future for Farming in the West African Savannah. Springer-Verlag, Berlin, Germany.
- Remy JC, Marin-Laflèche A (1976) L’analyse de Terre: Réalisation d’un Programme d’Interprétation Automatique. Annales agronomiques 25: 607-632.
- IPCC (2003) Good Practice Guidance for Land Use. In: Land Use Change and Forestry, Penman J. (Ed), IPCC/OECD/IEA/IGES, Hayama, Japan.
- Beernaert F, Bitondo D (1992) Land evaluation manual, Dschang University Centre, Dschang, Cameroon.
- Euroconsult (1989) Agricultural Compendium for Rural Development in the Tropics and the Subtropics, Elsevier, Amsterdam, Netherlands.
- Sys C, Van Ranst E, Debaveye J (1993) Land Evaluation. International Training Centre for Postgraduate Soil Scientists, Ghent, Belgium.
- Mal’tsev KA, Ivanov MA, Sharifullin AG, Golosov VN (2019) Changes in the rate of soil loss in river basins within the southern part of European Russia. Eurasian Soil science 52: 718-727.
- Latham M (1971) Role du Facteur Sol dans le Développement du Cotonnier en Côte d’Ivoire.Cah ORSTOM, Série Pédologie 11: 29-42.
- Sombroek WG, Zonneveld IS (1971) Ancient dune fields and fluviatile deposits.Soil survey paper No.5. Soil Survey Institute of Wageningen, Wageningen, Netherlands.
- Beernaert F, Bitondo D (1991) Simple and Practical Methods to Evaluate Analytical Data of Soil Profiles, Belgian Cooperation /University of Dschang, Dschang,
- WRB (World Reference base for soil Resources) (2014) International soil classification system for naming soils and creating legends for soil maps. FAO, Rome, Italy.
- Tabi FO, Ngobesing ESC, Yinda GS, Boukong A, Omoko M, et al. (2013) Soil fertility capability classification (FCC) for rice production in Cameroon lowlands.African Journal of Agricultural Research 8: 1650-1660.
- Dabin B (1964) General Study of Soil Usage Conditions in the Chad Trough. ORSTOM, Paris, France.
- Boyer J (1970) Summary of State-Of-Knowledge on the Factors of Soil Fertility in French Intertropical Africa, ORSTOM, Paris, France.
- Forestier J (1960) Fertilité des Sols des Caféières en RCA.Agronome Tropical 15: 543-567.
- Alcantara LP, Garcia BL, spejo AG (2015) Soil Organic Carbon along an Altitudinal Gradient in the Despenaperros National Park, Southern Spain. Solid Earth 6: 125-134.
- Shamsher H, Ishtiaq H, Shabir H (2019) Effect of altitude on forest soil properties at Northern Karakoram, Eurasian Soil science 52 (10): 1159-1169.
- Sanchez PA, Palm CA, Buol SW (2003) Fertility Capability Classification: a Tool to Assess Soil Quality in the Tropics. Geoderma 114: 157-185.
- Sys C, Van Ranst E, Debaveye J (1991) Land Evaluation. Part 1, Principles in Land Evaluation and Crop Production Calculation. General Administration for Development Cooperation. Agric. Publ. No 7, Brussels, Switzerland.
Citation: Azinwi Tamfuh P, Chotangui AH, Katte VY, Achantap RA, Magha AM, et al. (2020) Land Characteristics and Agricultural Suitability Status along a Toposequence in Santa, Bamenda Highlands, Cameroon. J Atmos Earth Sci 4: 022.
Copyright: © 2020 Primus Azinwi Tamfuh, et al. This is an open-access article distributed under the terms of the Creative Commons Attribution License, which permits unrestricted use, distribution, and reproduction in any medium, provided the original author and source are credited.