Mertolenga a Well Substrutured Population According to their Morphotypes
*Corresponding Author(s):
Mateus JCDepartamento De Zootecnia, Escola De Ciências Agrárias E Veterinárias , Universidade De Trás-os-Montes E Alto Douro, Vila Real, Portugal
Tel:+351 259350429,
Email:jmateus@utad.pt
Abstract
Genetic structure and diversity of three Mertolenga breed morphotypes were assessed with 30 microsatellites. Allelic richness per locus was relative high, with an overall average of 6.163. The mean number of alleles, corrected for the size of smaller sample, ranged between 5.6 in the Rosilho variety to 6 alleles in the Malhado de Vermelho and Unicolor varieties. The mean expected and observed heterozygosities ranged between 0.748 in the Unicolor variety, 0.730 in the Rosilho variety, and between 0.735 in the Unicolor variety and 0.685 in Malhado de Vermelho variety, respectively. The Rosilho variety systematically showed the lowest values of genetic diversity excepted for the observed heterozygosity and the number of specific alleles (Private Alleles). The analysis with STRUCTURE has allowed us to get 4 well-defined clusters (one cluster for the Mirandesa breed, an outgroup in the present study, and 3 clusters corresponding to the three morphotypes of the Mertolenga breed), which means that these varieties can be regarded as completely distinct populations in genetic terms. To analyze the substructure among the 58 animals studied, Factorial Correspondence Analysis and a Bayesian approach were carried out using GENETIX and STRUCTURE software. The factorial analysis of correspondences resulted in the formation of 3 well-defined clusters that correspond to one of the three varieties of the Mertolenga breed. The genetic information present in this study demonstrates that the Mertolenga Portuguese cattle breed is genetically well sub-structured in its three morphotypes. Since this has implications with regard to the rational management of animal genetic resource conservation, we believe that the results of this study should be taken into account in future breeding programs and assessments of risk of extinction because each of these populations is a significantly different genetic resource.
Keywords
INTRODUCTION
The aim of this study was to analyze the genetic diversity and the effect of morphotypes on genetic substructure of the Mertolenga Portuguese cattle breed. For that purpose, we will use the information provided by allele frequencies of 30 microsatellites, 16 of which are part of the list of microsatellites recommended by the ISAG group for genetic diversity studies.
MATERIAL AND METHODS
Animals
DNA extraction
| Locus† | BTA | Number of alleles | Allele size range (bp) |
Primer (mM) |
Ta (°C) |
| BM1824 | 1 | 7 | 178-190 | 0.22 | 58 |
| BM 2113 | 2 | 11 | 121-143 | 0.11 | 58 |
| INRA023 | 3 | 14 | 196-222 | 0.40 | 58 |
| MGTG4B | 4 | 14 | 129-155 | 0.15 | 60 |
| RM067 | 4 | 8 | 90-106 | 0.75 | 58 |
| ETH10 | 5 | 11 | 113-225 | 0.15 | 60 |
| ETH152 | 5 | 8 | 193-211 | 0.12 | 58 |
| ILSTS035 | 6 | 24 | 210-270 | 0.80 | 58 |
| RM006 | 7 | 8 | 110-124 | 0.25 | 58 |
| HEL9 | 8 | 12 | 147-169 | 0.03 | 52 |
| ETH225 | 9 | 10 | 140-158 | 0.15 | 60 |
| SPS113 | 10 | 13 | 133-157 | 0.15 | 60 |
| BRRIBO | 10 | 13 | 238-262 | 0.30 | 58 |
| HEL13c | 11 | 6 | 185-195 | 0.03 | 52 |
| TGLA345 | 12 | 10 | 112-142 | 0.05 | 58 |
| CSSM036 | 14 | 10 | 162-182 | 0.08 | 60 |
| SPS115 | 15 | 8 | 246-260 | 0.40 | 58 |
| TGLA53 | 16 | 18 | 154-188 | 0.15 | 60 |
| ETH185 | 17 | 13 | 221-245 | 0.03 | 66 |
| TGLA227 | 18 | 12 | 77-99 | 0.35 | 58 |
| ETH3 | 19 | 11 | 103-131 | 0.20 | 60 |
| TGLA126 | 20 | 8 | 111-125 | 0.50 | 58 |
| TGLA122 | 21 | 19 | 135-181 | 0.32 | 58 |
| ETH131 | 21 | 29 | 140-173 | 0.50 | 58 |
| BM2613 | 22 | 11 | 159-179 | 0.16 | 58 |
| CYP21e | 23 | 33 | 183-222 | 0.20 | 58 |
| BM1818 | 23 | 7 | 258-270 | 0.30 | 58 |
| ILSTS065 | 24 | 11 | 126-146 | 0.08 | 58 |
| HEL11 | 26 | 13 | 184-218 | 0.10 | 58 |
| BM203 | 27 | 18 | 115-241 | 0.04 | 58 |
Data analysis
The classical genetic diversity parameters were calculated using GENETIX software version 4.05.2 [18]. The unbiased average expected and observed heterozygosities per population was calculated within the breed. The total and mean number of alleles was corrected for these two parameters, which accounted for all possible combinations of twelve animals (smaller size of an analyzed sample) within each variety of the Mertolenga population. Fstat enabled us to calculate the inbreeding coefficient (FIS) and allelic richness.
Population structure was evaluated using the parameters of hierarchical F-statistics (FST, FIT, FIS), estimated according to that proposed by Weir and Cockerham [19] and implemented in Fstat, version 2.9.3.2 [20]. The null Hypothesis (Ho) that the estimates are not significantly different from zero was substantiated through testing based on permutations, as proposed by Goudet [20]. To test FIS (f), alleles were exchanged between individuals within populations; to test FIT (F), alleles were exchanged between populations; finally, to test FST (θ), individuals were exchanged between populations. The FST parameter that measures the proportion of different alleles between all population pairs was also calculated. The distribution of FST values between pairs of populations, under the assumption that there are no differences between the populations, was obtained through a random sampling of multi-locus genotypes between the two populations. The logarithm of maximum likelihood statistical G test [21] was used to classify the P values (proportion of data in the random sample obtained a value of FST as great or greater than observed). The significance of the P value, for the comparisons carried out, was corrected by the standard method of Bonferoni, as proposed by Goudet [20].
To have an idea of the degree of genetic separation between the three varieties studied; DA genetic distances between all pairs of populations were calculated using software populations [22].
To estimate the K value for Mertolenga, we used a reference population consisting of 48 animals of the Mirandesa breed, considered the best genetically distinct population of all Portuguese breeds. We varied the value of K from 1 to 6 and the software was set to run for 250 000 MCMC repetitions, with a 50 000 burn-in. There were ten runs for each value of K and the most likely value of K was determined by the highest average of the maximum likelihood of the data (Ln P (D)) with smaller variance.
The STRUCTURE software was also used to allocate individuals to their populations of origin using the strictly Bayesian method implemented by the software. The run was set for 1 000 000 MCMC repetitions, with a 100 000 burn-in, for the most likely value of K in order to determine the number of animals classified in each cluster. The percentage of individuals classified in each cluster was determined by considering the estimated proportion of the association of each individual genotype (Q) to each of the clusters. Was also calculated the percentage of subjects not included in their population of origin and misclassified in another cluster. Tests of individual allocation were also performed by STRUCTURE using a priori information about the source population of individuals, since the subjects were sampled from different herds and from distinct population with different phenotypes. The run had the same characteristics as before with K always equal to 4.
RESULTS
| Variety | H. Exp. | H. Obs. | MNA | MNAC† | TNA | TNA† | PA | Allelic | Fis | Dev. |
| Richeness | HWE | |||||||||
| Maver | 0.740 | 0.685 | 6.0 | 6.0 | 179 | 179 | 10 | 5.967 | 0.078 | 0 |
| Rosilho | 0.730 | 0.701 | 6.9 | 5.6 | 208 | 169 | 25 | 5.821 | 0.044 | 0 |
| Unicolor | 0.748 | 0.735 | 7.5 | 6.0 | 224 | 180 | 33 | 6.112 | 0.018 | 0 |
The DA genetic distances (Table 3) are equivalent to those observed among all Portuguese cattle breeds [4,9,11]. The greatest distance was obtained between the Rosilho and Malhado de Vermelho pair and shortest distance between the Rosilho and Unicolor pair. All FST values are significantly different from zero among all population pairs. They are equivalent to some of the FST values observed among other Portuguese cattle breeds [4] suggesting that these are entirely genetically distinct populations. The test for genetic differentiation between pairs of populations carried out by Genepop confirmed these results, after obtaining highly significant P values that enabled us to reject the null hypothesis that “The alleles were taken from the same distribution in all populations.” Table 4 shows the Wright estimators of genetic differentiation FIS (f) FIT (F) and FST (θ). None of the estimates of the inbreeding coefficient f was significantly different from zero. The levels of genetic differentiation θ obtained by locus were relatively low and ranged between 0.007 and 0.074 for locus BM1818 and RM006, respectively. For all loci analyzed, estimates of θ were not significantly different from zero except for loci ILSTS035, TGLA122, BM1824, ETH10, HEL11, ranging from highly significant in the first case, very significant in the second, and significant in that of the last three loci. However, when considering all loci, the result was considerably different from zero. The average proportion of genetic variation explained by differences among the varieties was 2.7%, which is quite low when compared with the variation observed among all populations of Portuguese cattle [4,9,11]. Nevertheless, recall that the populations concerned resulted from the subdivision in three phenotypes of a single Portuguese population. We attributed the remaining variation to individual differences existing within each one of the studied varieties.
| Morphotype | MaVer | Rosilho | Unicolor |
| MaVer | 0 | 0,1488 | 0,1336 |
| Rosilho | 0,0415† | 0 | 0,1029 |
| Unicolor | 0,0221† | 0,0235† | 0 |
| Locus | f | F | θ |
| BM1818 | -0,003 | -0,01 | -0,007 |
| BRRIBO | 0,023 | 0,064 | 0,042 |
| SPS115 | 0,032 | 0,037 | 0,004 |
| INRA23 | 0,098 | 0,133 | 0,039 |
| CYP21 | 0,034 | 0,051 | 0,018 |
| ETH152 | 0,056 | 0,067 | 0,012 |
| BM1824 | -0,028 | 0,048 | 0,073* |
| ETH131 | -0,006 | 0,011 | 0,017 |
| TGLA122 | -0,053 | 0,004 | 0,054‡ |
| BM2113 | 0,056 | 0,066 | 0,011 |
| RM067 | -0,082 | -0,074 | 0,008 |
| TGLA227 | -0,081 | -0,063 | 0,017 |
| ETH3 | 0,035 | 0,067 | 0,033 |
| ETH225 | 0,114 | 0,141 | 0,03 |
| TGLA53 | 0,008 | 0,042 | 0,035 |
| MGTG4B | 0,000 | 0,025 | 0,025 |
| SPS113 | -0,005 | 0,034 | 0,039 |
| ETH10 | 0,223 | 0,255‡ | 0,041* |
| CSSM36 | 0,101 | 0,105 | 0,004 |
| ILSTS035 | 0,059 | 0,127 | 0,073† |
| BM2613 | 0,081 | 0,103 | 0,024 |
| ILSTS065 | 0,053 | 0,04 | -0,014 |
| RM006 | -0,134 | -0,049 | 0,074 |
| BM203 | 0,133 | 0,154 | 0,024 |
| HEL11 | 0,166 | 0,199* | 0,039* |
| TGLA345 | 0,019 | 0,043 | 0,025 |
| TGLA126 | 0,201 | 0,215 | 0,019 |
| ETH185 | -0,015 | -0,002 | 0,012 |
| HEL13 | 0,008 | 0,028 | 0,02 |
| HEL9 | 0,094 | 0,112 | 0,02 |
| All Loci | 0,039 | 0,065† | 0,027† |
‡ P< 0.01
* P< 0.05
Figure 1 shows the results of Factorial Correspondence Analysis (FCA) applied to the Mertolenga breed. With regard to the morphotypes, there is a clear substructure among the Mertolenga individuals and the three varieties of the Mertolenga breed that are clearly grouped and separated from each other.
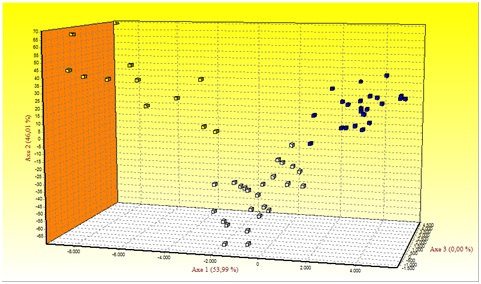 Figure 1: Factorial Correspondence Analysis carried out on the three varieties of the Mertolenga breed.
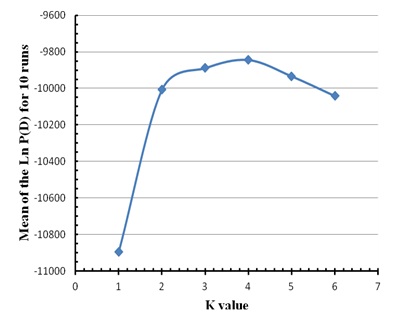 Figure 2: Average value of the Ln P(D) for ten runs without information of the source populations of the animals in the three varieties of the Mertolenga breed and Mirandesa breed.
| Varieties | Qmáx | Q> 0,8 | Q> 0,9 | Mean | Cluster |
| MaVer | 58,3% | 45,5% | 45,5% | 49,8% | 1 |
| Rosilho | 73% | 68% | 59% | 66,7% | 2 |
| Unicolor | 75% | 71% | 58% | 68,0% | 3 |
| Mirandesa | 100% | 94% | 88% | 94,0% | 4 |
| Mean | 76,6% | 69,6% | 62,6% | 69,6% |
| Variety | MalVer | Rosilho | Unicolor | Mirandesa | N | % |
| MalVer | 7 | 0 | 5 | 0 | 12 | 58.3% |
| Rosilho | 1 | 16 | 5 | 0 | 22 | 73% |
| Unicolor | 2 | 4 | 18 | 0 | 24 | 75% |
| Mirandesa | 0 | 0 | 0 | 48 | 48 | 100% |
| Varieties | Qmáx | Q>0.8 | Q>0.9 | Mean |
| MaVer | 100% | 55% | 55% | 70.0% |
| Rosilho | 91% | 82% | 73% | 82.0% |
| Unicolor | 96% | 87.5% | 79% | 87.5% |
| Mirandesa | 100% | 94% | 90% | 94.7% |
| Mean | 96.8% | 79.6% | 74.3% |
| MalVer | Rosilho | Unicolor | Mirandesa | N | % | |
| MalVer | 12 | 0 | 0 | 0 | 12 | 100% |
| Rosilho | 1 | 20 | 1 | 0 | 22 | 91% |
| Unicolor | 0 | 1 | 23 | 0 | 24 | 96% |
| Mirandesa | 0 | 0 | 0 | 48 | 48 | 100% |
DISCUSSION AND CONCLUSIONS
The results of FCA and STRUCTURE analyses demonstrated a clear genetic substructure in three well differentiated populations, each coincident with one of the current three morphotypes (Malhado de Vermelho, Rosilho or Mil Flores and Unicolor), so these may be considered as different populations. These results demonstrate, for the first time, that the three phenotypes of Mertolenga breed are really three distinct populations that can be easily isolated from each other, unlike the results of Ginja et al. [9], that could only isolate one of the three phenotypes. For the first time in Portugal, we have genetic arguments for the subdivision of one population out of three completely distinct populations. Since this fact has implications with regard to the rational management of animal genetic resources for conservation, we believe that the results of this study and others in the same field should be taken into account in future breeding programs. They are relevant to assessments of risk of extinction because each of these varieties is a significantly different genetic resource. At present, the Malhado de Vermelho morphotype population represents a small (less than 20% of the overall population) (Pais, Personal Communication) but effective exemplification of the Mertolenga breed, so their conservation should be a priority.
ACKNOWLEDGEMENT
REFERENCES
- Felius M (1995) Cattle breeds: An Encyclopedia. Trafalgar Square Publishing, The Netherlands.
- Beja-Pereira A, Alexandrino P, Bessa I, Carretero Y, Dunner S, et al. (2003) Genetic Characterization of Southwestern European Bovine Breeds: A Historical and Biogeographical Reassessment with a Set of 16 Microsatellites. J Hered 94: 243-250.
- Cymbron T, Freeman AR, Isabel Malheiro M, Vigne JD, Bradley DG (2005) Microsatellite diversity suggests different histories for Mediterranean and Northern European cattle populations. Proc Biol Sci 272: 1837-1843.
- Mateus JC (2008) Estudo da diversidade genética e filogenia das raças de bovinos autóctones Portuguesas. Tese de Doutoramento, Universidade de Trás-os-Montes e Alto-Douro, Vila Real, Portugal.
- Cymbron T, Loftus RT, Malheiro MI, Bradley DG (1999) Mitochondrial sequence variation suggests an African influence in Portuguese cattle. Proc Biol Sci 266: 597-603.
- Ginja C, Penedo MC, Melucci L, Quiroz J, Martínez López OR, et al. (2010) Origins and genetic diversity of New World Creole cattle: Inferences from mitochondrial and Y chromosome polymorphisms. Anim Genet 41: 128-141.
- Fernandes L (2004) A raça Mertolenga. Livro de Resumos das II Jornadas Técnicas de Raças Bovinas Autóctones, 5 e 6 de Maio de 2004. Escola Superior Agrária de Castelo Branco, Castelo Branco, Portugal.
- Cañón J, Alexandrino P, Bessa I, Carleos C, Carretero Y, et al. (2001) Genetic diversity measures of local European beef cattle breeds for conservation purposes. Genet Sel Evol 33: 311-32.
- Ginja C, Telo Da Gama L, Penedo MC (2010) Analysis of STR markers reveals high genetic structure in Portuguese native cattle. J Hered 101: 201-210.
- Miller SA, Dykes DD, Polesky HF (1988) A simple salting out procedure for extracting DNA from human nucleated cells. Nucleic Acids Res 16: 1215.
- Mateus JC, Penedo MC, Alves VC, Ramos M, Rangel-Figueiredo T (2004) Genetic diversity and differentiation in Portuguese cattle breeds using microsatellites. Anim Genet 35: 106-113.
- Hughes SS (2000) STR and 1.2.90. “STR and Nucleic Acid Analysis Software”.
- Raymond M, Rousset F (1995) GENEPOP Version 1.2: Population genetics software for exact tests and ecumenicism. J Hered 86: 248-249.
- Guo SW, Thompson EA (1992) Performing the exact test of Hardy-Weinberg proportion for multiple alleles. Biometrics 48: 361-372.
- Rousset F, Raymond M (1995) Testing heterozygote excess and deficiency. Genetics 140: 1413-1419.
- Raymond M, Rousset F (1995) An exact test for population differentiation. Evolution 49: 1283-1286.
- Weir BS (1996) Genetic data analysis II. Sinauer Associates, Sunderland, Massachusetts, USA.
- Belkhir K, Borsa P, Goudet J, Chikhi, L, Bonhomme F (1998) GENETIX, logiciel sous Windows TM pour la génétique des populations. Laboratoire Génomeet Populations, CNRS UPR 9060. Université de Montpellier II, Montpellier, France.
- Weir BS, Cockerham CC (1984) Estimation F-statistics for the analysis of population structure. Evolution 38: 1358-1370.
- Goudet J (2002) FSTAT (version 2.9.3). FSTAT.
- Goudet J, Raymond M, de Meeüs T, Rousset F (1996) Testing differentiation in diploid populations. Genetics 144: 1933-1940.
- Langella O (1999) Population genetic software (version 1.2.30).
- Pritchard JK, Stephens M, Donnelly P (2000) Inference of population structure using multilocus genotype data. Genetics 155: 945-959.
- Pritchard JK, Wen W, Falush D (2003) Documentation for STRUCTURE software: Version 2.2. University of Oxford, UK.
Citation: Mateus JC, Russo-Almeida PA, Rangel-Figueiredo MT (2018) Mertolenga a Well Substrutured Population According to their Morphotypes. J Anim Res Vet Sci 2: 006.
Copyright: © 2018 Mateus JC, et al. This is an open-access article distributed under the terms of the Creative Commons Attribution License, which permits unrestricted use, distribution, and reproduction in any medium, provided the original author and source are credited.