Observational Studies of Monsoonal Droughts and Large Scale Traits
*Corresponding Author(s):
Kumar VDepartment Of Earth And Ocean And Atmospheric Sciences, Florida State University, Tallahassee, United States
Tel:+1 8506441494,
Email:vinay.kumar@tamucc.edu
Abstract
Rainfall variability of the Indian summer (JJAS) monsoon droughts are linked to regional and global parameters. Here, with the use of 30 years of various observational datasets of rainfall, winds, temperature and other major indices, the variability of Indian summer monsoon is explored for drought years. In recent, due to increase in ocean surface temperature, meridional temperature gradient over Indian land and nearby sea is decreased. On the scale of months to season the rainfall and circulation features grow in and out of phase over Indian, Pacific Ocean and African regions. Additionally, droughts over Indian regions are manifestation of the ITCZ’s sway in meridional direction influenced by circulation and convective activities over Pacific, Indian and African regions. Ultimately, ENSO, warming in the regional oceans and internal dynamics remain the potential drivers of the ISMR droughts. In recent decades, Indian monsoon is showing favoritism towards drought.
Keywords
ocean surface temperature; meridional temperature; Monsoonal Droughts; Large Scale Traits
INTRODUCTION
Indian monsoonal drought in recent years (e.g., 2002, 2009, 2014 and 2015) drew our attention to revisit this problem. Since 1871 Indian region confronted total 25 droughts, while there were as many 32 years, when rainfall was below normal on all India basis [12]. Every summer (June-September) the distribution of rainfall is such that India is bound to faces drought over a smaller or bigger region. The severity of drought may vary amazingly from place to place and time to time. Once a wave of drought is blown out, the life of a common-man and farmers start to experience hardship in their daily activities [13]. Climatologically western part of India is virtually known a drought prone region, and rest of the India experiences wet and dry spells contemporary during June to September. In the literature of Indian monsoon, various drought indices and methods are defined to measure the intensity of monsoon droughts severity. The droughts during the period 1871-1995 are given in [14,12]. Even the hiatus in the summer monsoon rainfall for a large number days over India may lead to drought like conditions [15,16]. Long break of 20-25 days in the month July in 2002, made 2002 as the one of the worst drought years in the Indian history [17].
In last 30 years 6 major India monsoon droughts (1982, 1986, 1987, 2002, 2009 and 2015) were associated with ENSO event [2,18-22,12). These drought years, were linked with above than normal winter snow cover over Eurasian region [23,24,5,6]. The role of dry air intrusion during monsoonal break also linked with monsoonal droughts [17,25,10]. Thus, internal dynamics, Eurasian snow cover and dry air intrusion are some of the bigger players in producing droughts over the Indian region. The main characteristics of ISMR are 1) Almost no rainfall over central India and heavy rainfall over foothills of Himalaya and east equatorial Indian ocean. 2) High pressure over central India. 3) Shift of monsoonal trough northern region of India.
The motivation of the research is inspired from the recent warming of the Indian Ocean and changes in various large scale circulation patterns related to Indian monsoon. Understanding the large-scale traits of the Indian monsoon droughts is the main goal of the study. In this work, droughts are defined based on rainfall variability only. A drought year is defined when monsoon seasonal rainfall (June-September) is less than 10% of the climatological normal. All such drought years are considered in this study. Authors believe, simply understanding the synoptic and dynamical features of various atmospheric-oceanic systems during a monsoonal drought may help readers immensely. Thus, one of the main issue addressed in this manuscript is the representation of all the large-scale factors those affects ISMR’s rainfall. Previous studies and reports considered one aspect of large scale features associated with drought, one at time. This observational study raise questions, what are the impact of 1) the weakening of meridional gradient of surface temperature, 2) impact of ENSO on monsoon, 3) role of internal dynamics in the changing climate, on monsoonal droughts?
MATERIAL AND METHODS
All the datasets are freely available online on their respective websites for research purposes. Large scale circulation features like Walker and Hadley circulations are calculated based on the zonal and meridional component of the wind field. Rainfall anomalies are calculated based on the 30 years (1981-2010) of rainfall climatology. The study area is limited to the Indian landmass and Indian summer (JJAS) monsoonal droughts for the composite plots years 1982, 1985, 1986, 1987, 2002, 2004 and 2009 are considered throughout the manuscript.
RESULTS
Climatological features of monsoonal droughts over Indian subcontinent
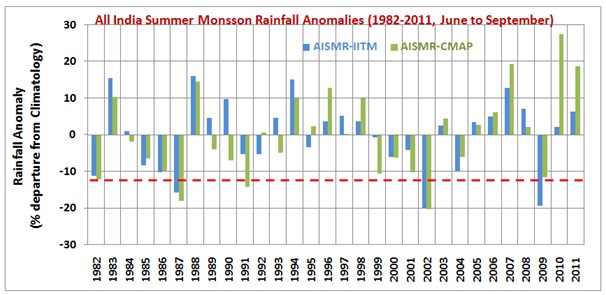
Figure 2, shows climatological characteristics of rainfall distribution over Indian subcontinent region. Here maximum rainfall is usually received by Western Ghats, the Northeastern India, Bangladesh and Myanmar. Furthermore, two extensions of maximum rainfall (ITCZ) are located one over central Africa and another over western Pacific region. One more distinguishable patch of rainfall is seen over east equatorial Indian region, which is known as double ITCZ over Indian region during boreal monsoon. In most of the drought cases northeastern Indian region and western Indian shows opposite rainfall variability. As a matter of fact, during droughts most of the India experiences above normal atmospheric pressures and subsidence of colder and drier air-mass. It is shown that Indian summer monsoon rainfall does not show any trend [26].
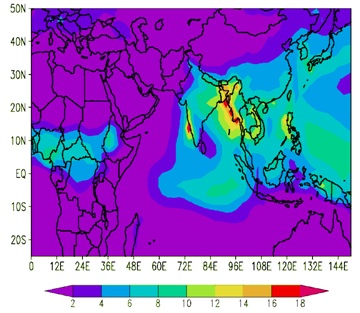 Figure 2: Climatological variations of summer monsoon rainfall over South Asian and African region. The climatology is based 30 years of datasets (1982-2011) from CMAP.
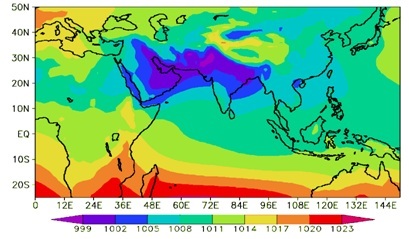 Figure 3a: Climatological MSLP in summer.
COMPOSITE MAPS SEVERAL VARIABLES FOR INDIAN SUMMER MONSOON DROUGHTS
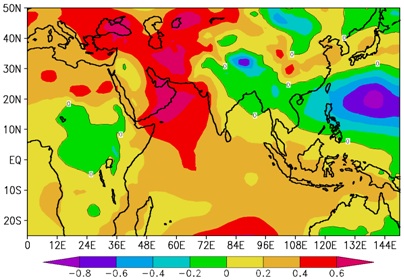 Figure 4: Rainfall anomalies for the composite of drought years.
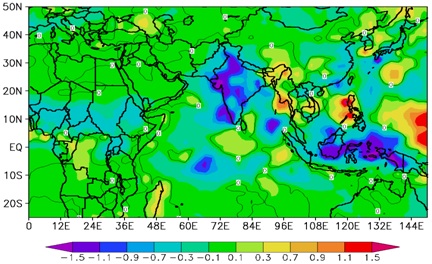 Figure 5a: Rainfall anomalies for the composite of drought years.
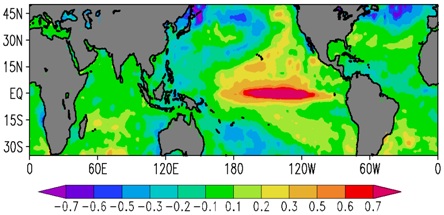 Figure 5b: SST anomalies for the composite of drought years.
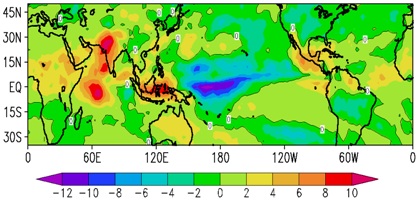 Figure 6: OLR anomalies for the composite of drought years.
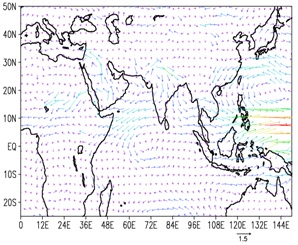
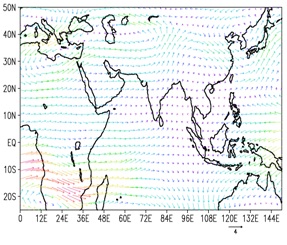 Figure 7b: Wind anomalies at 200mb for the composite of drought years.
One of the fundamental reasons of the existence of monsoonal flow is the meridional gradient of lower tropospheric temperature (Ocean vs Land). How, this temperature gradient swings from pre-monsoon month of May to monsoonal summer months is very exciting (Figures 8a&8b). There is barely any warming in the total column of atmosphere, which can pull the monsoon over Indian landmass in May (Figure 8a). Contrasting to the old fact of surface temperature gradient across Indian subcontinent and Indian Ocean, which drives the monsoon, latter on heating of the lower tropospheric column found an important factor for monsoon [39]. In figure 8b, the vertical gradient of the temperature in the lower tropospheric column changes a lot than figure 8a. If this warming is extended up to 600-500mb level, then it is expected that the monsoon may perform better over Indian region.
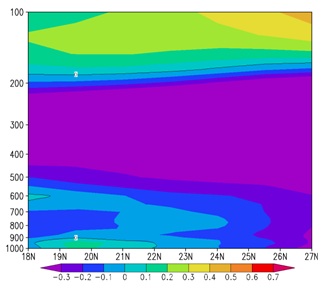 Figure 8a: Vertical profile of temperature averaged over lon=72 to lon=85 for May.
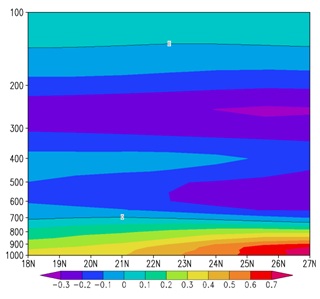 Figure 8b: Vertical profile of temperature averaged over lon=72 to lon=85 for Summer Season (JJAS).
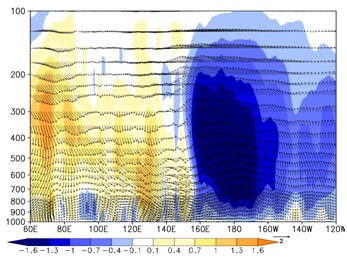 Figure 9a: Zonal Walker circulation (averaged over lat=-10 to lat=20).
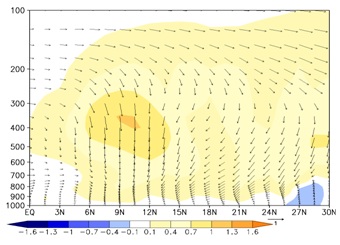 Figure 9b: Meridional local Hadley cell (averaged over lon=70 to lon=95) for the composite of drought years.
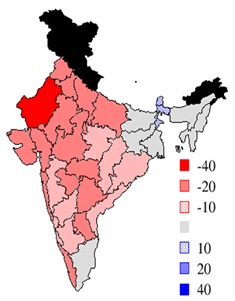 Figure 10: Composite map of the seasonal (June-September) variation of sub divisional rainfall expressed as percentage departure from long-term normal.
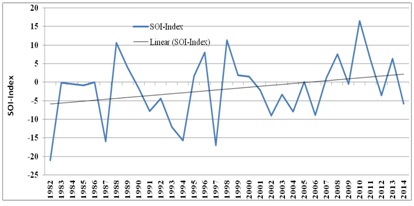 Figure 11: SOI Index averaged from June to September showing its value becoming negative to positive from 1982 to 2014.
DISCUSSION
The variability of rainfall brings natural calamities to the society, disaster to the environment, food scarcity, and imbalance to ecology. Among all the possibilities of the advanced forecasts we should facilitate the society to prepare for the natural disasters. We should educate and prepare society for a judicial use of natural resources, manage water problems, landslides, floods and droughts because the oddity of the monsoon is difficult to dodge. Further, there modeling of droughts may verify the weakening of meridional gradient of surface temperature, impact of ENSO on monsoon, role of internal dynamics and for other influences in the changing climate for monsoonal droughts?
Some of the important points as the discussion are raised here in the time of global warming how the monsoon will behave: -
a. On the disappearance of Eurasia and Arctic Ice completely
b. On the shift of the warming in the middle of Pacific Ocean than eastern Pacific Ocean during El-Nino years
c. The land and sea temperature gradient across the Indian continent and Indian ocean is decreasing
d. It has been shown that the depressions are decreasing in Bay of Bengal
e. Local circulation e.g., local Hadley cell, over Indian subcontinent are weakening
CONCLUSION
REFERENCES
- Blanford H F (1886) The rainfall of India. Supt govt Print, Calcutta, India.
- Walker GT (1924) Correlation in Seasonal Variations of Weather, IX: Further Study of World-weather. Meteorological Office, Poona, India. Pg no: 75-131.
- Sajjad S, Müller WA, Hagemann S, Jacob D (2011) Circumglobal wave train and the summer monsoon over northwestern India and Pakistan: The explicit role of the surface heat low. Clim Dyn 37: 1045-1060.
- Rodwell MJ, Hoskins BJ (2001) Subtropical Anticyclones and Summer Monsoons. J Climate 14: 3192-3211.
- Bamzai AS, Shukla J (1999) Relation between Eurasian snow cover, snow depth and the Indian summer monsoon: An observational study. J Climate 12: 3117-3132.
- Dash SK, Singh GP, Shekhar MS, Vernekar AD (2005) Response of the Indian summer monsoon circulation and rainfall to seasonal snow depth anomaly over Eurasia. Climate Dyn 24.
- Kanamitsu M, Krishnamurti TN (1978) Northern summer tropical circulations during drought and normal rainfall months. Mon Wea Rev: 106: 331-347.
- Krishnamurti TN, Bedi HS, Subramaniam M (1989) The summer monsoon of 1987. J Climate 2: 321-340.
- Krishnamurti TN, Bedi HS, Subramaniam M (1990) The summer monsoon of 1988. Meteor Atmos Phys 42: 19-37.
- Kumar V (2016) Review of Droughts over Indian Region. Int J Marine Sci Ocean Technol 3: 40-44.
- Hunt BG (2014) The influence of stochasticism on Indian summer monsoon rainfall and its impact on prediction. Clim Dyn 42: 2271-2285.
- Sikka DR (1999) Monsoon Drought in India. Center for Ocean-Land-Atmosphere Studies, Calverton, Maryland, USA. Pg No: 1-270.
- Koteswaram P (1976) Climatological Studies of Droughts in Asiatic Monsoon Area, Particularly India. Proc Nat Sci Acad 42: 1-14.
- Bhalme HN, Mooley DA (1979) On the performance of modified Palmer index. Arch Meteor Geophys Bioklim B 27: 281-295.
- Webster PJ, Magana VO, Palmer TN, Shukla J, Tomas RA, et al. (1998) Monsoons: Processes, predictability, and the prospects for prediction. J Geophys Res 103: 14451-14510.
- Gadgil S, Joseph PV (2003) On breaks of the Indian Monsoon. Proc Indian Acad Sci (Earth Planet Sci)112: 529-558.
- Krishnan R, Kumar V, Sugi M, Yoshimura J (2009) Internal Feedbacks from Monsoon-Midlatitude Interactions during Droughts in the Indian Summer Monsoon. J Atmos Sci 66: 553-578.
- Rasmusson EM, Carpenter TH (1983) The Relationship Between Eastern Equatorial Pacific Sea Surface Temperatures and Rainfall Over India and Sri Lanka. Mon Wea Rev 111: 517-528.
- Bhalme HN, Jadhav SK (1984) The Southern oscillation and its relation to the monsoon rainfall. J Climatol 4: 509-520.
- Ropelewski CF, Halpert MS (1989) Precipitation patterns associated with the high index phase of Southern Oscillation. J Climate 2: 268-284.
- Yasunari T (1990) Impact of Indian monsoon on the coupled atmospheric ocean system in the tropical Pacific. Meteorol Atmos Phys 44: 29-41.
- Webster PJ, Yang S (1992) Monsoon and ENSO: Selectively interactive systems. Quart J Roy Meteor Soc 118: 877-926.
- Blanford HF (1884) On the connexion of the Himalayan snow to the dry winds and season of droughts in India. Proc R Soc Lond 37: 232-234.
- Dickson RR (1984) Eurasian snow cover versus Indian monsoon rainfall - an extension of the Hahn-Shukla results. J Climatol Appl Meteor 23: 171-173.
- Krishnamurti TN, Thomas A, Simon A, Kumar V (2010) Desert Air Incursions, an Overlooked Aspect, for the Dry Spells of the Indian Summer Monsoon. J Atmos Sci 67: 3423-3441.
- Parthasarthy B, Munot AA, Kothawale DR (1995) Monthly and Seasonal Rainfall Series for All-India Homogenous Regions and Meteorological Sub-Divisions 1871-1994. Indian Institute of Tropical Meteorology 1-113.
- Xie P, Arkin P (1997) Global precipitation: A 17-Year Monthly Analysis Based On Gauge Observations, Satellite Estimates, and Numerical Model Outputs. Bull Amer Meteor Soc 78: 2539-2558.
- Uppala SM, Kallberg PW, Simmons AJ, Andrae U, Bechtold BDA, et al. (2005) The ERA-40 re-analysis. Quart J Roy Meteor Soc 131: 2961-3012.
- Liebmann B, Smith CA (1996): Description of a Complete (Interpolated) Outgoing Longwave Radiation Dataset. Bull Amer Meteor Soc 77: 1275-1277.
- Reynolds RW, Marsico DC (1993) An Improved Real-Time Global Sea Surface Temperature Analysis. J Climate 6: 114-119.
- Roxy MK, Ritika K, Terray P, Murutugudde R, Ashok K, et al. (2015) Drying of Indian subcontinent by rapid Indian Ocean Warming and a weakening land-sea thermal gradient. Nature Communications 1-10.
- Kumar V, Krishnan R (2005) On the association between the Indian summer monsoon and the tropical cyclone activity over the Northwest Pacific. Current Sci 88: 602-612.
- Krishnan R, Zhang C, Sugi M (2000) Dynamics of Breaks in the Indian Summer Monsoon. J Atmos Sci 57: 1354-1372.
- Saji NH, Goswami BN, Vinayachandran PN, Yamagata T (1999) A dipole mode in the tropical Indian Ocean. Nature 401: 360-363.
- Ashok K, Behera SK, Rao SA, H. Weng, Yamagata T (2007): El Niño Modoki and its possible teleconnection. J Geophys Res 112.
- Krishna Kumar K, Rajagopalan B, Hoerling M, Bates B, Cane M (2006) Unraveling the Mystery of Indian Monsoon Failure During El Niño. Science: 314: 115-119.
- Kulkarni JR, Kumar V, Satyan V (2002) The association of surface wind stresses over Indian Ocean and Monsoon rainfall. Met Atmos Phy 79: 231-242.
- Ding Q, Wang B (2007) Intraseasonal Teleconnection between the Eurasian Wave Train and Indian Summer Monsoon. J Climate 20: 3751-3767.
- Xavier PK, Marzin C, Goswami BN (2007) An objective definition of the Indian summer monsoon season and a new perspective on the ENSO–monsoon relationship. Quat J Royal Met Soc 133: 749-764.
- Palmer TN, Brankovic C, Vitervo P, Miller MJ (1992) Modelling Interannual Variations of Summer Monsoons. J Climate 5:399-417.
- Kumar KK, Rajagopalan B, Cane MA (1999) On the weakening relationship between the indian monsoon and ENSO. Science 284: 2156-2159.
- Allan RP, Soden BJ (2008) Atmospheric Warming and the Amplification of Precipitation Extremes. Science 321: 1481-1484.
- Naidu CV, Durgalakshmi K, Munikrishna K, Ramalingeswara Rao S, Satyanarayana GC, et al. (2009) Is summer monsoon rainfall decreasing over Indian in the global warming era? Journal of Geophysical Research 114.
- Goswami BN, Venugopal V, Sengupta D, Madhusoodanan MS, Xavier PK (2006) Increasing Trend of Extreme Rain Events Over India in a Warming Environment. Science 314: 1442-1445.
- Krishnamurti TN, Martin A, Krishnamurti R, Simon A, Thomas A, et al. (2013) Impacts of enhanced CCN on the organization of convection and recent reduced counts of monsoon depressions. Climate Dynamics 41: 117-134.
- Ghude SD, Jena C, Chate DM, Beig G, Pfister GG, et al. (2014) Reductions in India's crop yield due to ozone. Geophy Res Lett 41: 5685-5691.
- Sahu SK, Beig G, Parkhi N (2014) Critical Emissions from the Largest On-Road Transport Network in South Asia. Aerosol and Air Quality Research 14: 135-144.
- Sathiyamoorthy V, Shukla BP, Pal PK (2010) Increase in the pre-monsoon rainfall over the Indian summer monsoon region. Atmos Sci Let 11: 313-318.
- Overland JE, Wang M (2013) When will the summer Arctic be nearly sea ice free? Geophysical Research Letters 40: 2097-2101.
- Qian JH, Robertson AW, Moron V (2010) Interactions among ENSO, the Monsoon, and Diurnal Cycle in Rainfall Variability over Java, Indonesia. J Atmos Sci 67: 3509-3524.
- Stevens B, Feingold G (2009) Untangling aerosol effects on clouds and precipitation in a buffered system. Nature 461: 607-613.
- Madhura RK, Krishnan R, Revadekar JV, Mujumdar M, Goswami BN, (2015) Changes in western disturbances over the Western Himalayas in a warming environment. Climate Dynamics 44: 1157-1168.
Citation: Vinay Kumar, Kulkarni JR (2017) Observational Studies of Monsoonal Droughts and Large Scale Traits. J Atmos Earth Sci 1: 001.
Copyright: © 2017 Kumar V, et al. This is an open-access article distributed under the terms of the Creative Commons Attribution License, which permits unrestricted use, distribution, and reproduction in any medium, provided the original author and source are credited.