Occurrence and Occupational Risk of Polybrominated Diphenyl Ethers (PBDEs) and Dechloran Plus (DP) in a Formal E-Waste Recycling Plant, Northwest China
*Corresponding Author(s):
Hong GaoDepartment Of Environmental Pollution Prediction And Control, College Of Earth And Environmental Science, Lanzhou University, Lanzhou, China
Tel:+86 09318911843,
Fax:+86 9318911384
Email:caohm16@lzu.edu.cn/honggao@lzu.edu.cn
Abstract
To prevent widespread diffusion of toxic chemicals from e-waste recycling industry in southern and eastern China, a scaled e-waste recycling industry is being relocated to northwestern China. The present study examined the levels of several chemicals in a typical e-waste recycling plant in north western China. In the first phase of our field sampling campaign, we collected total 100 PM1.0, PM2.5, PM10 and gas phase samples about PBDEs and DP at three sampling sites. The ambient mean concentrations of ∑9PBDEs and ∑DP in particle and gas phase during the whole sampling period followed a sequence of indoor>outdoor>background. The highest level of ∑9PBDEs and ∑DP in particle phase were found in PM2.5 at the indoor site were 1978.58 pg/m3 and 155.50 pg/m3, respectively. The highest concentration of ∑9PBDEs in gas phase also appeared at the indoor site at 7.33 pg/m3, followed by the outdoor site (4.10 pg/m3), and the background site (0.70 pg/m3). DP concentrations in gas phase were 0.63 pg/m3 at the indoor site and 0.10 pg/m3 at outdoor site, respectively. BDE-209 was the dominant congener in all particles at the indoor site. PBDEs and DP were mainly adsorbed to the particulate phase, especially in PM2.5. The inhalation exposure risk assessment combined with the particle size distribution suggested that PM2.5-bounded PBDEs and DP exhibited the highest inhalation risk and deposition flux in the alveolar region and had the largest relative contribution to health risks.
Keywords
DP; E-waste; Gas phase; Particle phase; PBDE; Occupational exposure risk
INTRODUCTION
China has the world largest electronic waste (e-waste) recycling industry [1]. About 80% of e-wastes were exported to Asia, and nearly 90% of which was shipped to China legally or illegally [2]. China itself has been one of the largest consumers of appliances in the world, yielding huge amount of e-wastes. As a result, the e-waste recycling industry gained rapid development in China, such as Guyui in Guangdong Province in southern China and Taizhouin Zhejiang Province in eastern China, which were known as the e-waste recycling capitals in China and the globe [3,4]. The considerable amount of e-waste recycling and the lack of modern techniques in e-waste recycling in those e-waste recycling plants in southern and eastern China caused serious toxic pollution in the environment. On the one hand, given shallow level of groundwater, runoff due to high precipitation rate, and abundant surface water [5], and toxic chemicals in those e-wastes recycling sites are readily diffused and poured into the water environment. On the other hand, many such chemicals also undergo long-range atmospheric transport due to their persistence and volatility [6]. Extensive investigations to e-waste recycling industry in southern and eastern China revealed serious adverse effects of toxic chemicals on human health [6-9].
To prevent and remediate the environmental pollution and reduce human exposure risks from e-waste recycling in southern and eastern China, one of the important strategies taken by Chinese Environmental Administration was to relocate e-waste recycling industry to northwestern China. Featured by arid and semi-arid climate, lower precipitation, and higher elevation as compared to eastern and southern China, both groundwater and surface water resources are scarce in this part of China, which reduce the risk of environmental contamination from e-waste recycling activities. However, given the poor ecological environments, northwestern China are uniquely susceptible to atmospheric pollution [10]. Low precipitation (~100-300 mm/year), barren lands, and sparse vegetation coverage reduce considerably the elimination of contaminants from the air through precipitation washout and vegetation uptake. Concerns have been raised for the impacts of the future development of e-waste recycling industries on water resources by toxic chemicals which might worsen originally very limited water resources (only about 22% of the national mean), such as the Yellow River, the second largest river in China and the main source of water supply for the local and vast downstream regions in central and east China. Hence, there is an urgent need to assess the potential environmental consequences induced by the e-waste recycling activities which are projected to increase in forthcoming years.
Among many toxic chemicals, the disposal of e-waste has been demonstrated to be large sources of Polybrominated Diphenyl Ethers (PBDEs) and Dechlorane Plus (DP). As emerging chemicals and new persistent organic pollutants (POPs), PBDEs have been widely used as brominated flame retardants in electronics, electrical appliances, chemicals, transportation, building materials and other fields [11]. PBDEs are manufactured and applied in three technical mixtures: Penta-BDE, octa-BDE and deca-BDE. The former two mixtures have been restricted under the Stockholm Convention for POPs [12]. PBDEs have been detected in the air, water, sediment, soil, and biota due to their persistence and bio-accumulative nature [13-16]. Among these environmental compartments, the atmosphere is a primary pathway of PBDEs [11]. DP (C18H12Cl12) is an additive chlorinated flame retardant, which is manufactured as a substitute for Dechlorane (also called Mirex) since the 1970s [17]. Because of its typical physical and electrical properties, DP has been widely used in circuit boards, household appliances [18-20]. The occurrence of DP in the air and sediment around and in the Great Lakes and other pristine areas also indicated its potential for long-range atmospheric transport [18,21,22]. The detection of DP in serum, food web, surface soil, aquatic biota, and human hair in many e-waste recycling sites in southern China manifests strong associations between e-waste recycling activities and risks in the environment and human [23-27] and also suggested that e-waste recycling industry is a significant source of DP in the ambient environment.
While extensive field sampling studies have been carried out in many e-waste recycling sites in southern and eastern China, there are almost no field measurements ever conducted to examine the ambient pollution levels of PBDEs and DP as well as other persistent toxic chemicals releasing from e-waste dismantling industries in northwestern China, the future home of e-waste recycling industry in China. In this sense, the present study aimed to fill knowledge gaps in the influences of e-waste recycling activities on the dry and harsh environment and to provide a scientific support to the development of environmental friendly e-waste recycling industry in northwestern China, which is presently unclear. The major objectives of the present study are: (1) to measure the ambient air levels of PBDEs and DP as typical chemicals emitted from a formal e-waste recycling plant in the arid environment in northwestern China; (2) to examine compositional profiles, gas-particle partitioning, and dry deposition of the target chemicals; and (3) to assess potential human exposure risks to PBDEs and DP released from this formal e-waste recycling plant.
MATERIAL AND METHODS
Study location
The sampling study was conducted in a formal e-waste dismantling plant located in Gaolancountry (36°20′N, 103°57′E), Lanzhou City (Figure 1), Gansu Province (Figure 1) in northwestern China. The area of Gaolan is 2476 km2 with the population about 180,000. This plant was constructed under the guidance of the Chinese Ministry of Environment Protection (MEP) as a typical e-waste recycling plant for the future development of this type of industry in northwestern China, which was constructed to follow the regulations and the environmental protection law of China. There were 140 dismantling workers were employed in the plant. Three sampling sites were set to measure the pollution levels and compositional profiles of PBDEs and DP. Among these sites, the one site was set within indoor site (the E-Waste Dismantling Workshop, EWDW), and another one was at outdoor site (the Top Of Office Building, TOB), and the third one was set at a Rural Area (RA), 5 km up wind of thee-waste recycling plant (Figure 1). A detailed description of sampling sites is provided in the Supporting Information (SI).
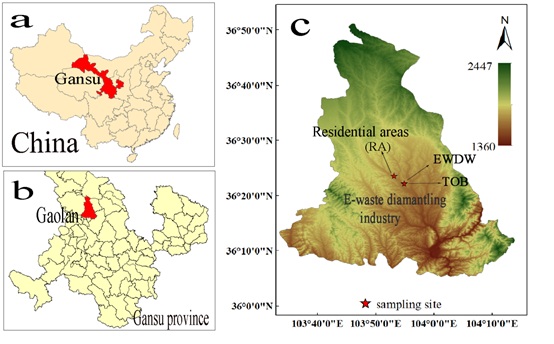 Figure 1: Sampling sites and geographical locations: (a) Gansu Province, Northwestern China; (b) Gaolan country in Lanzhou, the capital city of Gansu Province; and (c) three sampling sites, including indoor site (EWDW), outdoor site (TOB) and background site (RA).
Sample collection
Gas phase and particle phase including PM1.0, PM2.5, and PM10 were collected at the indoor (EWDW) and outdoor (TOB) sites from 17 to 26 November 2016. 30 samples (PM1.0, PM2.5, PM10) and 10 samples about gas phase were collected in EWDW and TOB, respectively. At the RA site, only gas phase (10 samples) and PM2.5 (10 samples) were sampled. Two high volume air samplers (Grase by Anderson) were used to collect PM2.5, PM1.0, respectively, and another brand high-volume air sampler (Tianhong Intelligent Instrument Plant, Wuhan, China) was used to sample PM10. PBDEs and DP in particle phase were extracted from these PM samples. Polyurethane Foam (PUF) cartridges with 6.5 cm in diameter × 7.5 cm in thickness (a density of 0.030 g/m3) were also used simultaneously to collect gas phase PBDEs and DP at the three sampling sites. The sampling flow rates at different sampling points (EWDW, TOB, RA) are 200L/min, 300L/min, 250L/min respectively. Particulate-associated contaminants were isolated from the atmosphere by drawing air through a quartz fiber filter (QFF, 20.3 cm × 25.4 cm, Whatman) for approximately 23 h of each day for 10 days.
Before sampling, PUF was soxhlet extracted with acetone and n-hexane for 72 h and dried in vacuum desiccators, and QFF was baked at 450°C and stored in sealed desiccators. After sampling, loaded QFF was wrapped with pre-baked Al foils and sealed with double-layer polyethylene bags. PUF cartridges were stored in solvent-cleaned glass jars with Al foil-lined lids. The samples were transported to the laboratory and stored at -20°C.
Extraction, clean-up, and analysis
PUF and QFF were spiked with 13C-PCB 141 as surrogate standards, and then were extracted using the Soxhlet-extractor with 200 ml mixture of acetone/hexane (1:1) for 72 h. The extract was rotary-evaporated to approximately 2 ml by a rotary evaporator, and then solvent-exchanged to n-hexane. Concentrated extracts were cleaned and fractionated on acid/basic/neutral multilayer silica gel/alumina columns, then eluted with 70 ml solvent mixture (hexane: Dichloromethane of 1:1). The final extracts were solvent-exchanged into hexane and concentrated to 200μl under a gentle N2 stream.
Sample analysis was performed with a Shimadzu Model 2010 Gas Chromatograph (GC) coupled with a Model QP 2010 Mass Spectrometer (MS) (Shimadzu, Japan) using Negative Chemical Ionization (NCI) in the Selected Ion Monitoring (SIM) mode. A 1μl extract of sample was injected automatically in split less mode. The initial oven temperature was maintained at 110°C for 5 min, programmed at a rate of 20°C /min to 200°C, held for another 4.5 min, then 10°C /min to 310°C, and then held for another 15 min. The determinations of BDE-28, -35, -47, -99, -100, -153, -154, -183 except for BDE-209 were performed by GC/MS-QP2010 equipped with a DB-XLB column (30 mx0.25 mm, 0.25μm film thickness). For BDE-209, a CP-Sil 13 CB (12.5mx0.25mm, 0.2µm film thickness) capillary column was used. The rest details of experimental steps were described in previous reports [6,28].
QA/QC
The Quality Assurance/Quality Control (QA/QC) measures of analysis process were performed including the simultaneous operation of QC control samples. One field QFF blank sample, one laboratory blank sample, one standard spiked blank sample, and one standard spiked matrix sample were performed for each batch of twelve samples for quality control. All samples were spiked with 13C-PCB-141 to assess the extraction efficiency and clean-up procedures. The recovery rates of the target compounds in the blank spike were less than 5%. To verify the recovery of target contaminants in each sample, recovery indicators such as PCB198, PCB30, PCB209 and TCMX were added. The recoveries of indicators in all samples ranged from 65% to 110%.
Gas-particle partitioning model
PBDEs are Semi Volatile Organic Compounds (SVOCs), and could be partitioned between the vapor and particle phases in the air. We examined the partition behaviors of measured PBDEs between the vapor and particle phases based on the sampled concentrations of PBDEs in gas phase and PM10. To better understand the environmental behavior of PBDEs emitted from an e-waste recycling plant in northwestern China under unique geographical environment and climate, and to provide scientific support to development of the e-waste dismantling plants, we calculated the gas-particle partitioning of target chemicals using Junge-Pankow partition/adsorption model described in SI.
Inhalation exposure risk assessment model
Generally, inhalation is one of the primary path ways of human exposure to PBDEs [29]. Flame retardants associated with airborne particles would pose a potential health risk to the exposed workers [30]. In this study, occupational workers exposure to PBDEs via inhalation was assessed based on monitored PBDEs concentrations and the exposure/ingestion factors recommended by the U.S.EPA. To evaluate the differences of human health risks of target pollutants with different particle sizes, International Commission on Radiological Protection (ICRP) model was used for inhalation exposure risk assessment in this study [4]. ICRP model was used to calculate the deposition flux of target pollutants in various organs of the respiratory system. The respiratory deposition flux was used as the daily intake and was substituted into the risk assessment model to calculate the hazard quotients. The ICRP model and the respiratory exposure risk assessment model are described in SI and the assessment results are elaborated below.
RESULT AND DISCUSSION
PBDEs
Levels of PBDEs concentration: 9 PBDE congeners were detected in gas and particle phase, as shown in Table S1 of SI and figure 2. Table 1 presented PBDEs concentration levels at different e-waste dismantling sites over the world, collected from literatures. As seen, PBDE concentrations differed greatly in different studies due to the difference in dismantling processes and complex emission mechanisms of PBDEs. In contrast to ambient PBDEs levels sampled in these field studies, especially in those places in China, the PBDE air concentrations collected in this study was lower, likely due to the adoption of more strict pollution control measures and new techniques in this regular-waste recycling following the guidance of Chinese MEP.
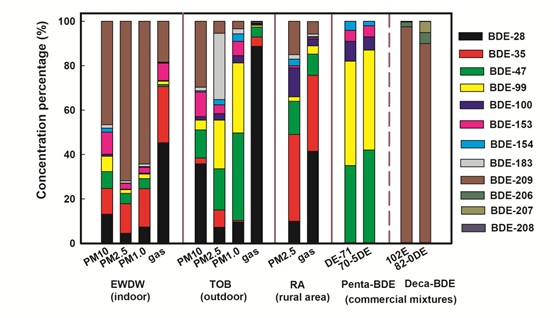 Figure 2: Average concentration percentage of PBDEs in PMs, gas, and commercial mixtures.
At EWDW site, the concentrations of ∑9PBDEs were 137.66±32 pg/m3in PM10, 1978.58±140 pg/m3in PM2.5, and 506.24±115 pg/m3in PM1.0, respectively. The ∑9PBDEs concentrations were 39.98±10 pg/m3 for PM10, 383.5±54 pg/m3 for PM2.5 and 268.88±97 ng/m3 for PM1.0 at the outdoor of TOB site. At the RA site, ∑9PBDEs concentrations were 24.53pg/m3in PM2.5. The results indicated that PBDEs were more easily absorbed to fine particles. At the TOB site, the ambient BDE-47, BDE-99, and BDE-153 levels in PM1.0 were higher than that in PM2.5.
Comparing the sampling results at EWDW and TOB (Figure 3), BDE-47, BDE-99, BDE-100, BDE-153, and BDE-154 at the TOB were higher than that at the EWDW, especially in PM1.0. However, these five congeners are the part of the industrial pentabromodiphenyl ether as shown in figure 2. Hence, the EWDW site may not be the only source of PBDEs contributing to their levels at the TOB site. Besides, some of the discarded electronic products were stacked in the open-air environment of the workshop before dismantling. The open storage and accumulation of obsolete electronics might also emit PBDEs into the atmosphere, resulting in PBDE contamination at the TOB site. Previous studies have reported high air concentration of PBDEs in warehouses where used electrical and electronic products were stored [31,32].
|
Sampling Site |
Pbde Congener Number |
Unit |
∑Pbdes Concentrations |
Reference |
|
E-waste dismantling workshops in Guiyu, China. |
20 congeners (TSP+Gas) |
ng/m3 |
27-2975 |
[6] |
|
TV dismantling workshops in Shanghai, China. |
12 congeners (PM10+Gas) |
pg/m3 |
6.78-2280 |
[31] |
|
An Electronics Recycling Plant in Sweden. |
9 congeners (particle) dismantling hall |
pg/m3 |
20.36-134.36 |
[30] |
|
|
|
|||
|
near the shredder |
pg/m3 |
257.38-312.13
|
||
|
At e-waste recycling house in Vietnamese. |
9 congeners |
pg/m3 |
620–720 |
[33] |
|
A WEEE recycling site in Finland. |
Deca-BDE |
ng/m3 |
21 to 2320 |
[34] |
|
Outside air in Pudong district, Shanghai. |
12 congeners (Particle) |
pg/m3 |
310 |
[35] |
|
In the vicinity of e-waste storage facilities in Thailand. |
10 congeners |
pg/m3 |
Indoor: 46-350 Outdoor: 8-150 |
[32] |
|
Indoor of dismantling workshop (EWDW). |
9 congeners |
pg/m3 |
PM10: 137.66 PM2.5: 1978.58 PM1.0: 506.24 Gas: 14.67 |
This study |
|
Outdoor of dismantling workshop (TOB). |
pg/m3 |
PM10: 268.88 PM2.5: 383.50 PM1.0: 39.98 Gas: 8.20 |
||
|
Control sites. |
pg/m3 |
PM2.5: 24.53 Gas: 1.40 |
Table 1: Comparison of concentrations of PBDEs in the ambient air in different areas in the world.
The highest concentration levels of PBDEs in gas phase were found at the EWDW site (14.67 pg/m3), followed by TOB site (8.20 pg/m3), and RA site (1.4 pg/m3), respectively. Guo et al. [31], have measured gas-phase concentrations of PBDEs ranging from 0.081to 291 ng/m3 at four sampling points in an e-waste recycling plant in Shanghai, China. Considerable high gas-phase concentrations of PBDEs were sampled at four sampling sites in Guiyu, ranging from 23 to 320 ng/m3 and reached 5-15 ng/m3 at the control sites [6]. Concentration of PBDEs in gas-phase in our study was three orders of magnitude lower than that sampled at the informale-waste recycling sites in southeastern China and southern China. It is likely that those informal e-waste recycling activities in southeastern and southern China were mostly in extraction of precious metals from e-wastes burning and heating, which released large amount of lower-brominated congeners. In our case, such high-temperature treatment processes were not adopted in this formal e-waste dismantling plant following the strict regulations in e-waste processing, which reduced efficiently the emissions of lower-brominated PBDEs.
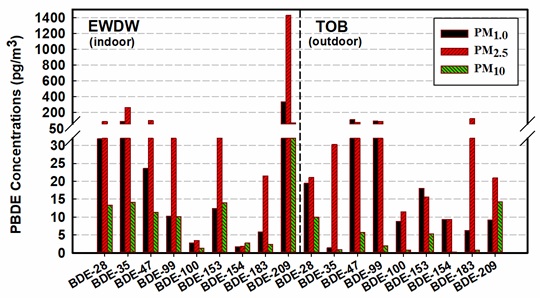 Figure 3: Predominant PBDE congeners detected in PMs at indoor and outdoor of workshop.
PBDEs emission at EWDW site: The total PBDE concentrations at different e-waste sites vary dramatically, attributable to the distance from the sampling sites to thee-waste recycling facilities and/or the recycling manners [3]. Low air concentration at the dismantling workshop in this study likely reflected low emissions. A simplified Gaussian dispersion model was used to estimate the emissions of toxic chemicals from the workshop. Results were used to compare with the release of PBDEs in southeast China. For a point source with instantaneous emissions, the simplified Gaussian model reads [36]:  Where C is air concentration (gas+particle) (ng/m3), e is the emission rate (g/day), ?y and ?z are a horizontal fetch (distance away from a sampling site) and the height of sampler above a ground surface, and u is a mean wind speed (m/s) at the sampling region. Outdoor TOB site was selected to estimate emission from indoor EWDW. According to the data from Kestrel 4500 Portable climate meter, the average wind speeds were range from 0.6- 0.76 m/s. In rural conditions, ratios of height to fetch vary from as small as 1:10 in unstable conditions to as large as 1:500 in stable cases [36]. Under low wind conditions and considering the neutral atmospheric stability, we selected a ratio of about 1:100 to calculate urban cases [37]. Since the sampler was mounted at the roof of a five-story office building, the sampling height was chosen as 20 m. This yields the horizontal fetch (radius of the point source) of 200 to 10000 m in the neutral atmospheric boundary-layer. Available data from open published article were collected to compare PBDE emission from e-waste dismantling operations between our studies and other field studies. Results are presented in table S6.
The EWDW site was regarded as a key PBDEs emission source to the TOB site. The estimated PBDEs daily emissions at the EWDW range from0.081 to 5.15 g/d, which were much lower than those emission sources associated with e-waste burning operations in southern China [3,38,39]. Nevertheless, lower emissions were also observed in Taizhou dismantling sites subject to increasingly stringent regulations on e-waste [40]. Detailed results are presented in Table S6. Comparing with the PBDE emissions caused by the electronic waste dismantling in southeastern China, low emission occurring in the formal e-waste dismantling plant in Gaolan is very likely attributed to the control of e-waste burning.
Congener profiles of PBDEs: Figure 2 shows that the composition of PBDE congeners differs greatly in the proportions of the different particles and the gas phase at the three sampling sites. In the gas phase, the proportion of lower-brominated congeners was greater than that of higher-brominated congeners in both indoor and outdoor environment. As vapor pressures of PBDEs increase with decreasing molecular weight and degree of bromination [41], lower-brominated PBDE congeners with great vapor pressure will easily be transferred to the gas phase. However, particle phase BDE-209 accounted for 50%-72% of total PBDEs at the EWDW site and therefore was the most abundant congener at this site. This is consistent with the fact that the Deca-BDE mixture is one of the most frequently used flame retardants across the world and China, especially in electronic/electric products [3,42,43]. Nevertheless, no other components of commercial Deca-BDE, such as BDE-206, 207, and 208, were detected in the present study. At the TOB site, BDE-47 and BDE-99 were the dominant congeners in PM1.0, and BDE-183 was the most abundant congener in PM2.5. The composition and proportion of PBDEs in PM1.0 at the TOB site were similar to that of commercial Penta-BDE. As aforementioned, the printed wiring board was produced decades ago, and commercial Penta-BDE products prevailed during that period. Complicated emission mechanism of PBDEs as well as dismantling processes might release other components of these two PBDE mixtures of commercial flame retardants, which were not discerned in this field study.
Gas-particle partitioning of PBDEs: The relative abundances of PBDEs at the sampling sites are shown in figure S1. The particle phase PBDE congeners were dominant at the EWDW and TOB sites, accounting for over 90% and 83% of ∑9PBDEs concentration, respectively. As SVOCs, the distribution of atmospheric PBDEs partitioning between gas and particle phase is an important factor controlling their environmental fate, such as migration, degradation, sedimentation, and human ingestion.
Figure 4 shows the log-log plots of KP versus PL for PBDEs measured in the present study. The mean ambient temperature averaged over each sampling period ranged from -13°C to 9°C. log PL of PBDEs were calculated using log PL=m/T + b, where m and b are related to physical and chemical properties of PBDEs which were obtained from literature [44]. Linear correlations obtained from r2 values between log Kp and log PL of PBDEs ranged from 0.626 to 0.797. All m values were greater than -0.6, ranging from -0.352 to -0.280, indicating that PBDEs congeners were dominated by the adsorption of organic matter onto particulate matter. Our results seem to differ from Chen et al. [11], likely due to significant change in the air temperature which is a dominate factor to influence on PL. In their case, the air temperature ranged from 27°C to 32°C whereas in our case, the air temperature was below 0°C. Lower temperature favors deposition of gaseous BFRs top articles [3]. There are uncertainties in the estimation of Kp and PL, partly from the replacement of TSP by PM10 in Kp calculation. Other ambient conditions such as precipitation and temperature, chemical reaction, evaporation of PBDEs from particle, and the non-equilibrium of gas/particle partitioning could all cause uncertainties.
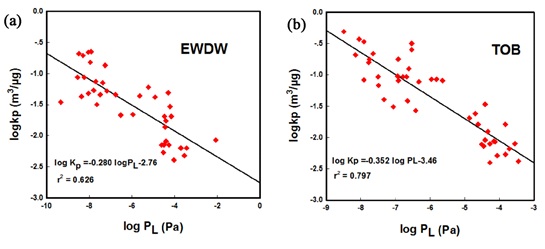 Figure 4: Plot of log KP (m3/μg) versus log PL (Pa) for PBDEs at the EWDW site (a) and TOB site (b).
As shown in figure 5, the J-P model tended to underestimate the sorption of high-bromine PBDEs. While ? values of lower-brominated PBDEs were overestimated by the J-P model at the EWDW and TOB site, agreeing with other studies [6,11,45]. The low-brominated PBDEs at the two sampling sites were mainly present in the particle phase compared with the gas phase. The main reason is likely that the effect of temperature on lower-brominated congeners was greater than higher-brominated congeners. Given that the mean temperature during the sampling period was below 0°C, the volatilization of lower-brominated congeners was limited to some extent.
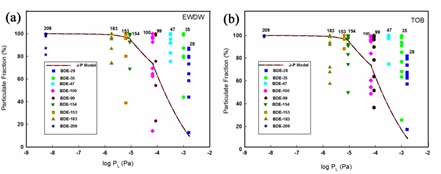 Figure 5: Measured particulate fractions (?×100%) and theoretical predictions using the Junge-Pankow model at the EWDW (a) and TOB sites (b).
DP
Concentration levels of DP: DP is globally ubiquitous as a potential candidate of POPs. As can be seen from table S2, two isomers of DP were detected in both gas phase and particle phase at the three sampling sites. The concentrations of ∑DP (sum of syn-and anti-DP) at the EWDW site were 89.28pg/m3in PM10, 155.5 pg/m3in PM2.5, and 67.92 pg/m3inPM1.0, which were mostly in particle phase with only 0.63 pg/m3 in gas phase. The result confirmed that the recycling of e-waste was an important source of DP. At the TOB site, concentrations of ∑DP were 6.74 pg/m3in PM10, 5.9 pg/m3 in PM2.5, and 13.8 pg/m3 in PM1.0, respectively. It was much lower than that at the EWDW site, as summarized in table S2. The concentrations of ∑DP at the RA site were 1.53pg/m3 in PM2.5 and 0.14pg/m3 in gas phase. These values were also lower than that measured at a background site of rural area [46]. At a background site lower DP was entirely due to source proximity [18,47].
Isomer profiles of DP: Generally, the fraction of anti-DP to the total DP isomers (Figure 6) has always been used to predict the environmental transport and fate of the two structural isomers [48]. The difference of solubility characteristics of DP isomer suggests that the environmental behavior of these two isomers is also different [49]. Two stereoisomers (syn-DP and anti-DP) of DP are mixed in a ratio of 1:3 in commercial products, namely anti-DP accounts for about 75% of ∑DP [50]. We calculated the ratio of anti-DP to summed anti- and syn-DP, defined by fanti=anti-DP/(anti-DP+syn-DP). Results are presented in table S2. The calculated fanti values PM1.0, PM2.5, and PM10 at the EWDW site were 0.83, 0.65, and 0.76, respectively. The gas phase fanti was 0.51. These values were consistent with the fanti values in PMs (0.75-0.8) of commercial DP products reported elsewhere [2,18] and 0.65 in gas phase [51]. For particle phase of technical DP product, fantivalues followed a sequence of PM10>PM2.5>PM1.0 at the TOB. Overall, the fanti values in the present study were higher than technical DP product value (0.65), manifesting again the dominance of local sources of PBDEs [52]. Different isomer ratio values in various field also indicated that the behavior of DP isomers depend on many factors. Partially, physical and chemical properties, such as water solubility, KOW, half-life, biodegradation rate, and environment factors such as atmospheric transport and deposition could all affect the changes in fanti [18,53].
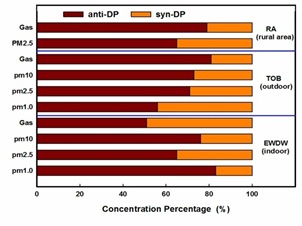 Figure 6: Average concentration percentage of DP isomers in particle phase and gas phase at three sampling sites.
INHALATION EXPOSURE RISK ASSESSMENT
Deposition flux of inhaled PBDEs and DP in the respiratory tract
The deposition fluxes of PBDEs and DP with different particle sizes in various organs of the respiratory system were presented in tables S3-S5. The mean deposition fluxes of Σ9PBDEs and DP with different particle size in different organs of human respiratory system were in sequence of Head Regions (HR)> Alveolar Regions (AR)> Tracheobronchial Regions (TR), is in line with the results obtained by Zhang et al, [40]. The total deposition fluxes of target pollutants with different particle sizes follow a sequence of PM2.5>PM1.0 >PM10, indicating that fine particles tend to pose higher health risks than coarse particles due to greater capability of absorbing toxic chemicals of fine particles. Figure 7 illustrates relative contributions of individual PBDE congener with different particle size in the alveolar regions of human respiratory system at the EWDW and TOB sites. Contaminants entering the alveolar area can cause direct harm to the human body. At the EWDW site, deca-BDE congener (BDE-209) exhibited the largest deposition flux, showing 611.41 pg/h in PM2.5, 64.83 pg/h in PM1.0, and 28.49 pg/h in PM10. In addition, the deposition flux of tribromo congeners accounted for 17.5%-23.1% of the total flux. At the TOB site, the lower- brominated congeners (Tribromo to pentabromodiphenyl ether) were associated with smaller particle size prone to deposit in the alveolar region. Decabromodiphenyl ether was shown to be prone to lower-brominated congeners in the environment by de-bromination, and lower-brominated congeners were more toxic and persistent [6,54,55]. Hence, the toxicity risk caused by lower-brominated congeners to occupational workers should not be overlooked.
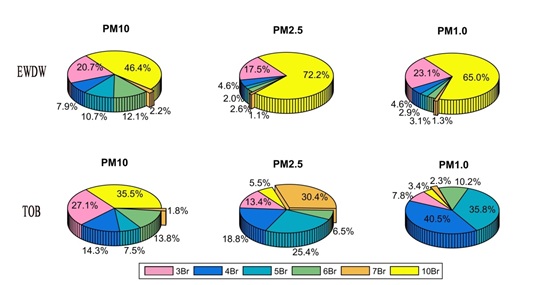 Figure 7: Relative contributions of individual PBDE with different particle size in the alveolar regions to human respiratory system for both EWDW and TOB sites.
Inhalation exposure risk to PBDEs and DP subject to different particle size
Daily inhalation intake of PBDEs and DP: Figure 8 displays the respiratory exposure and Hazard Quotient (HQ) values of the target pollutants combined with the particle size distribution. At the EWDW site, the total daily inhalation intake of ∑9PBDEs and∑DP were 9.35 pg/kg/d and 6.50 pg/kg/d for PM10; 130.27 pg/kg/d and 10.24 pg/kg/d for PM2.5; and 15.32 pg/kg/d and 2.04 pg/kg/d for PM1.0, respectively. At the TOB site, the total daily inhalation intake of ∑9PBDEs and ∑DP were 2.35 pg/kg/d and 0.40 pg/kg/d for PM10, 22.72 pg/kg/d and 29.13 pg/kg/d for PM2.5, and 4.03 pg/kg/d and 0.9 pg/kg/d for PM1.0, respectively. Respiratory exposure is not only determined by the concentration of the contaminant, but also by the particle size distribution. As a result, PBDEs and DP in PM2.5 exhibited the biggest exposure dose at both sampling sites.
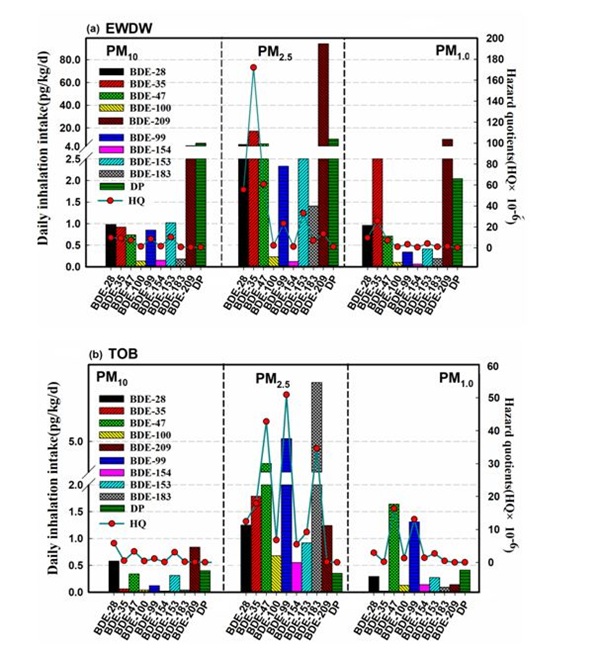 Figure 8: Daily inhalation intake and hazard quotients of particle-bound PBDE congeners and DP at EWDW and TOB site.
Overall, the daily inhalation intake at the EWDW site was greater than that at the TOB site. The inhalation exposure dose of different congeners of PBDEs and DP were associated significantly with particle size distribution. At the EWDW, the main contribution of total exposure does in PM10 to the inhalation intake was DP, followed by BDE-209. In PM2.5 and PM1.0, BDE-209 and BDE-35 were the dominant congeners in the inhalation exposure dose. At the TOB site, BDE-209 and BDE-28 in PM10 were the main contributors to the inhalation exposure dose whereas DP and BDE-183 in PM2.5 were the dominant contributors, and BDE-47 and BDE-99 in PM1.0 were the main contributors to the inhalation exposure dose.
Hazard quotients and exposure risk of PBDEs and DP: HQ is the ratio of the potential exposure to a substance and the level at which no adverse effects are expected. If the HQ value is greater than 1, then adverse health effects are possible. In our study, the HQ of target pollutants in PM2.5 was the largest at the EWDW and TOB sites with the values for ∑9PBDEs and ∑DP at the EWDW were 3.68x10⁻⁴ and 1.00x10⁻⁶, respectively. The HQ of the ∑9PBDEs and ∑DP at the TOB was 1.80x10⁻⁴ and 2.28×10⁻⁶, respectively. The HQ values related to the inhalation exposure of the target pollutants at the EWDW and TOB were lower than the critical value (1.0) specified by the US EPA, indicating that occupational workers had a relatively low risk of respiratory exposure to PBDEs and DP. Generally, the total hazard quotients of PBDE in respiratory system exposure at the EWDW were greater than that at the TOB. But HQ of DP at the EWDW was lower than that at the TOB. The main contribution of the target contaminants to the HQ at the EWDW and TOB was lower-brominated congeners. BDE-35 in PM2.5 yielded the highest HQ at the EWDW, followed by BDE-47 and BDE-28 in PM2.5, respectively. BDE-99, BDE-183, and BDE-47 in PM2.5 led to the highest HQ at the TOB. Although the assessment results showed a relatively low risk of respiratory exposure in our case, the amount of contaminants deposited and accumulated in the lungs increased which enhanced exposure risk of the occupational workers to the target contaminants. The metabolism and transformation mechanisms of individual congener of PBDE in humans were unknown yet.
CONCLUSION
The results presented in the present study revealed that PBDEs and DP containing in the obsolete electronic products were emitted into both indoor and outdoor ambient air environment during e-waste dismantling process. Comparing with other field measurement studies conducted in southern and southeastern China, the levels of PBDEs and DP collected in our field sampling campaign were low in ambient air, which is likely due to strict control measures taken in this formal e-waste recycling plant in our case. Such control measures are essential for protecting the rigorous environment in northwestern China from the relocation of e-waste recycling industry from well-developed southern and eastern China. The gas-particle partitioning calculation indicated that PBDE congeners and DP were mainly adsorbed to particle phase, especially to fine particles. BDE-209 was the predominant PBDE congener at the indoor of EWDW site, and BDE-47 and BDE-99 were dominant congeners at the outdoor of TOB site. The inhalation exposure risk assessment combined with the deposition fluxes of target pollutants with different particle sizes onto various organs of the respiratory system suggested that PM2.5-bounded PBDEs and DP exhibited the highest inhalation risk and deposition flux in the alveolar region which would has the largest relative contribution to health risks. It is worthwhile to point that the present study only focused on the risk assessment of respiratory exposure. Further research is needed to examine the influences of other exposure pathways such as skin exposure and dietary exposure on the health risks of occupational workers in this formal e-waste recycling industry in northwestern China.
ACKNOWLEDGMENT
This work was supported by the National Science Foundation of China (Grantsnumbers41701582 and 41671460), the National Key Technology Research and Development Program of the Ministry of Science and Technology of China (Grants number 2017YFC0212002).
REFERENCES
- Krikke J (2008) Recycling e-waste: The sky is the limit. IEEE, Piscataway, New Jersey, USA. Pg no: 50-55.
- Hileman B (2002) Electronic waste. Chem Eng News 80: 15-18.
- Tian M, Chen Sj, Wang J, Zheng Xb, Luo X, et al. (2011) Brominated flame retardants in the atmosphere of E-waste and rural sites in southern China: Seasonal variation, temperature dependence, and gas-particle partitioning. Environ Sci Technol 45: 8819-8825.
- Zhang K, Zhang BZ, Li SM, Wong CS, Zeng EY (2012) Calculated respiratory exposure to indoor size-fractioned polycyclic aromatic hydrocarbons in an urban environment. Sci Total Environ 431: 245-251.
- Zhao XB, Zhong HP, Huang CS (2008) Existed Problems and Counter measures for Development and Utilization of Groundwater in South China (in Chinese). Ground Water 30: 40-43.
- An T, Zhang D, Li G, Mai B, Fu J (2011) On-site and off-site atmospheric PBDEs in an electronic dismantling workshop in south China: Gas-particle partitioning and human exposure assessment. Environ Pollut 159: 3529-3535.
- Yuan J, Chen L, Chen D, Guo H, Bi X, et al. (2008) Elevated serum polybrominated diphenyl ethers and thyroid-stimulating hormone associated with lymphocytic micronuclei in Chinese workers from an E-waste dismantling site. Environ Sci Technol 42: 2195-2200.
- Zhang J, Jiang Y, Zhou J, Wu B, Liang Y, et al. (2010) Elevated Body Burdens of PBDEs, Dioxins, and PCBs on Thyroid Hormone Homeostasis at an Electronic Waste Recycling Site in China. Environ Sci Technol 44: 3956-3962.
- Zhao YX, Qin XF, Li Y, Liu PY, Tian M, et al. (2009) Diffusion of polybrominated diphenyl ether (PBDE) from an e-waste recycling area to the surrounding regions in Southeast China. Chemosphere 76: 1470-1476.
- Ma JZ, Wang XS, Edmunds WM (2005) The characteristics of ground-water resources and their changes under the impacts of human activity in the arid Northwest China-a case study of the Shiyang River Basin. Journal of Arid Environments 61: 277-295.
- Chen LG, Mai BX, Bi XH, Chen SJ, Wang XM, et al. (2006) Concentration levels, compositional profiles, and gas-particle partitioning of polybrominated diphenyl ethers in the atmosphere of an urban city in South China. Environ Sci Technol 40: 1190-1196.
- Ding N, Wang T, Chen SJ, Yu M, Zhu ZC, et al. (2016) Brominated Flame Retardants (BFRs) in indoor and outdoor air in a community in Guangzhou, a megacity of southern China. Environ Pollut 212: 457-463.
- Ter Schure AF, Larsson P, Merila J, Jonsson KI (2002) Latitudinal fractionation of polybrominated diphenyl ethers and polychlorinated biphenyls in frogs (Rana temporaria). Environ Sci Technol 36: 5057-5061.
- Litten S, Mcchesney Dj, Hamilton Mc, Fowler B (2003) Destruction of the World Trade Center and PCBs, PBDEs, PCDD/Fs, PBDD/Fs, and chlorinated biphenylenes in water, sediment, and sewage sludge. Environ Sci Technol 37: 5502-5510.
- Farrar NJ, Smith KE, Lee RG, Thomas GO, Sweetman AJ, et al. (2004) Atmospheric emissions of polybrominated diphenyl ethers and other persistent organic pollutants during a major anthropogenic combustion event. Environ Sci Technol 38: 1681-1685.
- Sellstrom U, Kierkegaard A, de Wit C, Jansson B (1998) Polybrominated diphenyl ethers and hexabromocyclododecane in sediment and fish from a Swedish river. Environ Toxicol Chem 17: 1065-1072.
- Kaiser K (1978) The rise and fall of mirex. Environ. Sci. Technol 12: 520-528.
- Hoh E, Zhu L, Hites Ra (2006) Dechlorane plus, a chlorinated flame retardant, in the Great Lakes. Environ. Sci. Technol 40: 1184-1189.
- Sverko E, Tomy GT, Reiner EJ, Li YF, Mccarry BE, et al. (2011) Dechlorane plus and related compounds in the environment: A review. Environ Sci Technol 45: 5088-5098.
- Xian Q, Siddique S, Li T, Feng YL, Takser L, et al. (2011) Sources and environmental behavior of dechlorane plus--a review. Environ Int 37: 1273-1284.
- Qiu X, Marvin Ch, Hites RA (2007) Dechlorane plus and other flame retardants in a sediment core from Lake Ontario. Environ Sci Technol 41: 6014-6019.
- Qiu X, Hites RA (2008) Dechlorane plus and other flame retardants in tree bark from the northeastern United States. Sci. Technol 42: 31-36.
- Ren G, Yu Z, Ma S, Li H, Peng P, et al. (2009) Determination of Dechlorane Plus in serum from electronics dismantling workers in South China. Environ sci Technol 43: 9453-9457.
- Wu JP, Zhang Y, Luo XJ, Wang J, Chen SJ, et al. (2010) Isomer-specific bioaccumulation and trophic transfer of Dechlorane Plus in the freshwater food web from a highly contaminated site, South China. Environ Sci Technol 44: 606-611.
- Yu Z, Lu S, Gao S, Wang J, Li H, et al. (2010) Levels and isomer profiles of Dechlorane Plus in the surface soils from e-waste recycling areas and industrial areas in South China. Environ Pollut 158: 2920-2925.
- Zhang Y, Luo XJ, Wu JP, Liu J, Wang J, et al. (2010) Contaminant pattern and bioaccumulation of legacy and emerging organhalogen pollutants in the aquatic biota from an e-waste recycling region in South China. Environ Toxicol Chem 29: 852-859.
- Zheng J, Wang J, Luo XJ, Tian M, He LY, et al. (2010) Dechlorane Plus in human hair from an e-waste recycling area in South China: comparison with dust. Environ Sci Technol 44: 9298-9303.
- Mai B, Chen S, Luo X, Chen L, Yang Q, et al. (2005) Distribution of polybrominated diphenyl ethers in sediments of the Pearl River Delta and adjacent South China Sea. Environ Sci Technol 39: 3521-3527.
- Harrad S, Hazrati S, Ibarra C (2006) Concentrations of polychlorinated biphenyls in indoor air and polybrominated diphenyl ethers in indoor air and dust in Birmingham, United Kingdom: implications for human exposure. Environ Sci Technol 40: 4633-4638.
- Sjodin A, Carlsson H, Thuresson K, Sjolin S, Bergman A, et al. (2001) Flame retardants in indoor air at an electronics recycling plant and at other work environments. Environ Sci Technol 35: 448-454.
- Guo J, Lin K, Deng J, Fu X, Xu Z (2015) Polybrominated diphenyl ethers in indoor air during waste TV recycling process. Journal of hazardous materials 283: 439-446.
- Muenhor D, Harrad S, Ali N, Covaci A (2010) Brominated flame retardants (BFRs) in air and dust from electronic waste storage facilities in Thailand. Environ int 36: 690-698.
- Tue NM, Takahashi S, Suzuki G, Isobe T, Viet PH, et al. (2013) Contamination of indoor dust and air by polychlorinated biphenyls and brominated flame retardants and relevance of non-dietary exposure in Vietnamese informal e-waste recycling sites. Environ Int 51: 160-167.
- Rosenberg C, Hameila M, Tornaeus J, Sakkinen K, Puttonen K, et al. (2011) Exposure to flame retardants in electronics recycling sites. Ann Occup Hyg 55: 658-665.
- Yu Z, Liao R, Li H, Mo L, Zeng X, et al. (2011) Particle-bound Dechlorane Plus and polybrominated diphenyl ethers in ambient air around Shanghai, China. Environ Pollut 159: 2982-2988.
- Cheng Y, Shoeib M, Ahrens L, Harner T, Ma J (2011) Wastewater treatment plants and landfills emit volatile methyl siloxanes (VMSs) to the atmosphere: Investigations using a new passive air sampler. Environ Pollut 159: 2380-2386.
- Oke TR (2004) Siting and exposure of meteorological instruments at urban sites. Nato-Chal M 17: 615-631.
- Chen D, Bi X, Zhao J, Chen L, Tan J, et al. (2009) Pollution characterization and diurnal variation of PBDEs in the atmosphere of an E-waste dismantling region. Environ pollut 157: 1051-1057.
- Deng WJ, Zheng JS, Bi XH, Fu JM, Wong MH (2007) Distribution of PBDEs in air particles from an electronic waste recycling site compared with Guangzhou and Hong Kong, South China. Environ Int 33: 1063-1069.
- Zhang T, Huang YR, Chen SJ, Liu AM, Xu PJ, et al. (2012) PCDD/Fs, PBDD/Fs, and PBDEs in the air of an e-waste recycling area (Taizhou) in China: current levels, composition profiles, and potential cancer risks. J Environ Monit 14: 3156-3163.
- United States Environmental Protection Agency (2010) An Exposure Assessment of Polybrominated Diphenyl Ethers. United States Environmental Protection Agency, Washington, D.C., USA.
- de Wit CA, Herzke D, Vorkamp K (2010) Brominated flame retardants in the Arctic environment--trends and new candidates. Sci Total Environ 408: 2885-2918.
- Birnbaum LS, Staskal DF (2004) Brominated Flame Retardants: Cause for Concern? Environ Health Perspect 112: 9-17.
- Wong A, Lei YD, Alaee M, Wania F (2001) Vapor pressures of the polybrominated diphenyl ethers. J Chem Eng Data 46: 239-242.
- Li Y, Jiang G, Wang Y, Wang P, Zhang Q (2008) Concentrations, profiles and gas-particle partitioning of PCDD/Fs, PCBs and PBDEs in the ambient air of an E-waste dismantling area, southeast China. Chinese Science Bulletin 53: 521-528.
- Ren N, Sverko E, Li Yf, Zhang Z, Harner T, et al. (2008) Levels and isomer profiles of dechlorane plus in Chinese air. Environ. Sci. Technol 42: 6476-6480.
- Venier M, Hites RA (2008) Flame retardants in the atmosphere near the Great Lakes. Environ Sci Technol 42: 4745-4751.
- Syed JH, Malik RN, Li J, Wang Y, Xu Y, et al. (2013) Levels, profile and distribution of Dechloran Plus (DP) and Polybrominated Diphenyl Ethers (PBDEs) in the environment of Pakistan. Chemosphere 93: 1646-1653.
- Kong XH (2011) Distribution and fate of high chlorinated flame retardant dechlorane plus in environment. Acta Agriculturae Jiangxi 23: 156-158.
- Gong N, Shao Ks, Jia Hl, Zhang H, Zhao L, et al. (2013) Concentration and bioaccumulation of chlorinated flame retardant dechlorane plus in intertidal zone of Yellow Sea? Marine environment science 23: 674-678.
- Tomy Gt, Pleskach K, Ismail N, Whittle DM, Helm PA, et al. (2007) Isomers of dechlorane plus in Lake Winnipeg and Lake Ontario food webs. Environ Sci Technol 41: 2249-2254.
- Sun H, Li Y, Wang P, Zheng S, Matsiko J, et al. (2016) Atmospheric levels and distribution of Dechlorane Plus in an E-waste dismantling region of East China. Science China Chemistry 60: 305-310.
- Tomy GT, Thomas CR, Zidane TM, Murison KE, Pleskach K, et al. (2008) Examination of isomer specific bioaccumulation parameters and potential in vivo hepatic metabolites of syn- and anti-Dechlorane Plus isomers in juvenile rainbow trout (Oncorhynchus mykiss). Environ Sci Technol 42: 5562-5567.
- Rahman F, Langford Kh, Scrimshaw MD, Lester JN (2001) Polybrominated diphenyl ether (PBDE) flame retardants. Sci Total Environ 275: 1-17.
- Mcdonald TA (2002) A perspective on the potential health risks of PBDEs. Chemosphere 46: 745-755.
SUPPORTING INFORMATION
Sampling site detail
kEWDW: kEWDW is a dismantling workshop mainly based on manual dismantling. CRT TVs, discarded desktop computers, washing machine enclosures, etc. were dismantled here. Computer host was placed on the workbench, and manually opened the side cover, and the data cable, power supply, hard drive, fan, and motherboard were removed. LCD TVs, computers, and laptops were manually opened at the bottom of the machine, and parts such as housings, circuit boards, and LCD screens were manually dismantled. The washing machine was transported from the material storage area to the dismantling area by a cart, and the washing machine was manually placed on the dismantling operation table, the bottom cover of the machine was opened, and the relevant parts were manually taken.
TOB: TOB is at the roof of a five-story office building located 20 meters downwind from the dismantling plant. The office building mainly involves civilian activities. We set it as a sampling point for collecting PBDE gas and particle phase concentrations in outdoor environments.
RA: RA is located in a rural village 5 km upwind away from the e-waste dismantling plant. Several households are located, and the rest of the areas are farmlands. RA site is considered as the background site.
Details about commercial Penta-BDE and Deca-BDE:
The “penta” formulation, commercially known as DE-71 and Bromkal 70-5DE [1], as shown in figure 2; The dominant congeners in penta-BDE (percent weight basis in parenthesis) are BDE-99 (35-50%), BDE-47(25-37%), BDE-100 (6-10%), BDE-153 (3-5%), and BDE-154 (2-4%) [2].
The formulations of commercial deca-BDE product (102E and 82-0DE) were shown in figure 2 [1]. The deca formulation is dominated by BDE 209 (97.5%), with the remainder being BDE 206 (2.2%), BDE 207 (0.24%), and BDE 208 (0.06%) [2].
Table S1: Average concentrations of PBDEs in particle phase and gas phase at three sampling sites (pg/m3).
|
Target PBDE |
EWDW (indoor) |
TOB (outdoor) |
RA rural area? |
|||||||
|
PM1.0 |
PM2.5 |
PM10 |
Gas |
PM1.0 |
PM2.5 |
PM10 |
Gas |
PM2.5 |
Gas |
|
|
BDE-28 |
31.88 |
84.34 |
13.34 |
6.64 |
19.44 |
21.04 |
9.96 |
7.27 |
2.02 |
0.58 |
|
BDE-35 |
85.90 |
261.28 |
14.10 |
3.70 |
1.42 |
30.26 |
0.94 |
0.35 |
9.60 |
0.48 |
|
BDE-47 |
23.56 |
92.04 |
11.38 |
0.14 |
108.98 |
72.20 |
5.74 |
0.37 |
3.72 |
0.13 |
|
BDE-99 |
10.18 |
35.36 |
10.14 |
0.21 |
87.40 |
85.92 |
2.02 |
0.07 |
3.36 |
0.05 |
|
BDE-100 |
2.80 |
3.50 |
1.36 |
0.06 |
8.78 |
11.48 |
0.74 |
0.04 |
0.47 |
0.04 |
|
BDE-153 |
12.44 |
50.22 |
14.04 |
1.13 |
18.04 |
15.56 |
5.32 |
0.02 |
0.77 |
0.01 |
|
BDE-154 |
1.70 |
1.78 |
2.76 |
0.03 |
9.34 |
9.28 |
0.26 |
0.01 |
0.20 |
0.01 |
|
BDE-183 |
5.84 |
21.48 |
2.40 |
0.05 |
6.28 |
116.84 |
0.74 |
0.04 |
0.58 |
0.02 |
|
BDE-209 |
333.94 |
1428.60 |
68.16 |
2.70 |
9.20 |
20.92 |
14.26 |
0.02 |
3.81 |
0.08 |
|
∑9PBDEs |
506.24 |
1978.58 |
137.66 |
14.67 |
268.88 |
383.50 |
39.98 |
8.20 |
24.53 |
1.40 |
Table S2: Average concentrations of DP in particle phase and gas phase at different sampling sites (pg/m3).
|
|
EWDW (indoor) |
TOB (outdoor) |
RA (Rural Area) |
|||||||
|
|
PM1.0 |
PM2.5 |
PM10 |
Gas |
PM1.0 |
PM2.5 |
PM10 |
Gas |
PM2.5 |
Gas |
|
Anti-DP |
56.10 |
101.12 |
67.52 |
0.32 |
7.70 |
4.18 |
4.9 |
0.08 |
1.00 |
0.11 |
|
Syn-DP |
11.82 |
54.38 |
21.76 |
0.31 |
6.10 |
1.72 |
1.84 |
0.02 |
0.53 |
0.03 |
|
∑2DP |
67.92 |
155.5 |
89.28 |
0.63 |
13.80 |
5.9 |
6.74 |
0.10 |
1.53 |
0.14 |
|
fanti |
0.83 |
0.65 |
0.76 |
0.51 |
0.56 |
0.71 |
0.73 |
0.80 |
0.65 |
0.79 |
fanti = Concentration of anti-DP/concentration of the total DP.
Table S3: deposition Fluxes (F, pg/h) of individual PBDEs divided by the number of Br in the Head Region (HR), Tracheobronchial Region (TR), and Alveolar Region (AR), and the Total Deposition Fluxes (TDF) and Total Deposition Efficiencies (TDE, %) of individual PBDEs divided by the number of Br with different particle size (PM10, PM2.5, PM1.0) at EWDW.
|
Numbers of Br |
Particle size |
F-HR |
F-TB |
F-RA |
TDF |
|
3 Br |
PM10 |
11.81 |
0.22 |
0.29 |
12.32 |
|
PM2.5 |
118.81 |
10.49 |
18.61 |
147.91 |
|
|
PM1.0 |
15.11 |
1.44 |
6.45 |
23.00 |
|
|
4 Br |
PM10 |
4.61 |
0.09 |
0.11 |
4.81 |
|
PM2.5 |
31.63 |
2.79 |
4.95 |
39.37 |
|
|
PM1.0 |
3.02 |
0.29 |
1.29 |
4.60 |
|
|
5 Br |
PM10 |
6.11 |
0.12 |
0.15 |
6.38 |
|
PM2.5 |
13.35 |
1.18 |
2.09 |
16.62 |
|
|
PM1.0 |
1.89 |
0.18 |
0.81 |
2.88 |
|
|
6 Br |
PM10 |
7.35 |
0.14 |
0.17 |
7.66 |
|
PM2.5 |
17.88 |
1.57 |
2.80 |
22.25 |
|
|
PM1.0 |
2.04 |
0.20 |
0.87 |
3.11 |
|
|
7 Br |
PM10 |
1.10 |
0.02 |
0.03 |
1.15 |
|
PM2.5 |
7.38 |
0.65 |
1.16 |
9.19 |
|
|
PM1.0 |
0.83 |
0.08 |
0.35 |
1.26 |
|
|
Numbers of Br |
Particle size |
F-HR |
F-TB |
F-RA |
TDF |
|
10 Br |
PM10 |
27.33 |
0.51 |
0.65 |
28.49 |
|
PM2.5 |
491.16 |
43.34 |
76.91 |
611.41 |
|
|
PM1.0 |
42.59 |
4.06 |
18.18 |
64.83 |
Table S4: Deposition Fluxes (F, pg/h) of individual PBDEs divided by the number of Br in the Head Region (HR), Tracheobronchial Region (TR), and Alveolar Region (AR), and the Total Deposition Fluxes (TDF) of individual PBDEs divided by the number of Br with different particle size (PM10, PM2.5, PM1.0) at TOB.
|
Numbers of Br |
Particle size |
F-HR |
F-TB |
F-RA |
TDF |
|
3 Br |
PM10 |
3.98 |
0.08 |
0.09 |
4.15 |
|
PM2.5 |
15.87 |
1.40 |
2.49 |
19.76 |
|
|
PM1.0 |
1.34 |
0.13 |
0.57 |
2.04 |
|
|
4 Br |
PM10 |
2.10 |
0.04 |
0.05 |
2.19 |
|
PM2.5 |
22.34 |
1.97 |
3.50 |
27.81 |
|
|
PM1.0 |
6.99 |
0.67 |
2.98 |
10.64 |
|
|
5 Br |
PM10 |
1.01 |
0.02 |
0.02 |
1.05 |
|
PM2.5 |
30.14 |
2.66 |
4.72 |
37.52 |
|
|
PM1.0 |
6.17 |
0.58 |
2.63 |
9.38 |
|
|
6 Br |
PM10 |
2.03 |
0.04 |
0.05 |
2.12 |
|
PM2.5 |
7.68 |
0.67 |
1.20 |
9.55 |
|
|
PM1.0 |
1.76 |
0.17 |
0.75 |
2.68 |
|
|
7 Br |
PM10 |
0.27 |
0.01 |
0.01 |
0.29 |
|
PM2.5 |
36.15 |
3.19 |
5.66 |
45.00 |
|
|
PM1.0 |
0.40 |
0.04 |
0.17 |
0.61 |
|
|
10 Br |
PM10 |
5.21 |
0.10 |
0.12 |
5.43 |
|
PM2.5 |
6.47 |
0.57 |
1.01 |
8.05 |
|
|
PM1.0 |
0.59 |
0.06 |
0.25 |
0.90 |
Table S5: Deposition Fluxes (F, pg/h) of DP in the Head Region (HR), Tracheobronchial Region (TR), and Alveolar Region (AR), and the Total Deposition Fluxes (TDF) with different particle size (PM10, PM2.5, PM1.0) at EWDW and TOB.
|
|
Particle size |
EWDW (indoor) |
TOB (outdoor) |
||||||
|
|
|
F-HR |
F-TB |
F-RA |
TDF |
F-HR |
F-TB |
F-RA |
TDF |
|
DP |
PM10 |
40.54 |
0.76 |
0.97 |
42.27 |
0.38 |
0.01 |
0.01 |
0.40 |
|
PM2.5 |
53.45 |
4.72 |
8.37 |
66.54 |
0.28 |
0.03 |
0.04 |
0.35 |
|
|
PM1.0 |
8.71 |
0.83 |
3.72 |
13.26 |
0.27 |
0.02 |
0.11 |
0.40 |
|
Note: particle phase was replaced by PM2.5
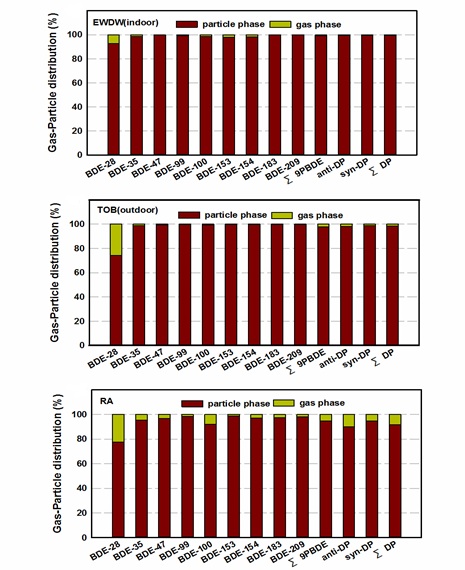 Figure S1: Composition of PBDEs and DP in gas and particle phase.
Emission and simplified Gaussian model
Outdoor TOB site was selected to estimate emission from indoor EWDW. According to the data from Kestrel 4500 Portable climate meter, the average wind speed were range from 0.6-0.76 m/s. In rural conditions, ratios of height to fetch vary from as small as 1:10 in unstable conditions to as large as 1:500 in stable cases Cheng et al. 2011. Under low wind conditions and considering the neutral atmospheric stability, we selected a ratio of about 1:100 to calculate urban cases Oke 2007. Since the sampler was mounted at the roof of a five-story office building, the sampling height was chosen as 20 m. This yields the horizontal fetch (radius of the point source) of 200 to 10000 m in the neutral atmospheric boundary-layer. Available data from open published article were collected to compare PBDE emission from e-waste dismantling operations between our studies and other field studies. Results are presented in Table S6.
Table S6: Estimation for PBDEs emission from e-waste dismantling and recycling sites.
|
Sampling site |
Year |
C(ng/m3) |
U (m/s) |
?Z (m) |
?Y (m) |
Emission (g/d) |
Description |
Reference |
|
Outdoor of e-waste dismantling workshop (TOB) |
2016 Winter |
0.392 |
0.60 -0.76 |
20 |
1SC:200 2UC:10000 |
0.081- 5.15 |
Root of Five-story building No burning or heating operations |
This study |
|
Various locations involved in dismantling e-waste in Taizhou City |
2011 Winter |
0.541 |
33.79 |
15-20 |
1500-2000 |
3.986- 7.090 |
An industrial zone site located in a formal e-waste recycling center |
[3] |
|
0.162 |
1 |
100 |
0.005 |
A manually dismantled e-waste site |
||||
|
0.409 |
1 |
100 |
0.013 |
A historical recycled Site |
||||
|
an E-waste dismantling site (Guiyu) |
2005 Autumn
|
11.742 (day) |
2.78 |
3 (average height of a bungalow) |
1SC:30 2UC:1500 |
0.254-12.69 |
Heating over a grill |
[4] |
|
4.830 (night) |
1.67 |
0.063-3.140 |
Burning take place in middle of night |
|||||
|
an E-waste dismantling site (Guiyu) |
2004 Summer |
16.575 |
42.40 |
12 |
1SC:120 2UC:6000 |
4.949- 247.46 |
Three-story building; open burning operations there |
[5] |
|
an E-waste dismantling site (Guiyu) |
2007-2008 Summer |
0.109-17.900 |
1.20 - 7.60 |
2 |
1SC:20 2UC:1000 |
0.005-23.508 |
Open burning there |
[6] |
1SC = Stable Conditions 2UC = Unstable Conditions 33.79 was gotten from historical monitored data 42.40 = perennial average wind speed.
Particle partitioning and adsorption
The Junge-Pankow partition/adsorption model (J-P model) is the most commonly used method to estimate the atmospheric gas-particle partitioning of SVOCs associated with aerosols [7], defined by
Kp= (F / TSP) / A (1)
where F and A are the particulate and gas-phase concentrations, respectively, and TSP is the total concentration of suspended particulate (μg/m3). Since the sample of atmospheric particulate collected in this study was PM10, the TSP in equation (1) is replaced by PM10. So the formula (1) has the following deformation:
Kp= (F / PM10) / A (2)
Lee and Tsay (1992) [8] replaced TSP with PM10 for gas particle distribution studies. Similar approach has been also used in other studies [9,10]. It should be noted that Kp calculated from TSP and PM10 are different. We shall follow this approach because PM10 concentrations were directly measured in the present study. It should be noted that the replacing TSP by PM10 might yield bias in the computation of Kp [9].
Pankow [11] has derived a log-linear relationship between Kp and PL, defined by:
log Kp= mr log PL + br (3)
where PL is the analytic’s sub cooled liquid vapor pressure, m is the slope, b is the intercept. In general, the slope m should be close to -1 [11]. In reality, even in an equilibrium state mr value could be deviated from -1 [12,13]. Under certain conditions, the value of m can be regarded as an indicator for adsorption or absorption when determining the gas-particle partitioning of SOCs [12]. The temperature dependent PL values of PBDE congeners were calculated using the regression parameters by [14].
The Junge-Pankow adsorption (PL-based) model has been conventionally used to predict the fraction of SOCs in particles, which is related to the sub cooled liquid vapor pressure (PL) of the compound and the particle surface area per unit volume of air (θ), given by:
φ=cθ / (PL + cθ) (4)
The constant c (Pa cm) is related to the heat of condensation and chemical surface properties. An empirical value of 17.2 Pa cm is often used [15]. θ=1.1×10⁻⁵ cm2/cm3 for urban air and 4.2-35×10-7 cm2/cm3 for rural air [7].
Only the PBDE congeners with detectable concentrations in a given sample were accounted for in our study. Based on the value of m and b [16] and the temperature during sampling period, we estimated PL value. PL value for BDE-209 was not available as BDE-209 was present only in the particle phase in most cases. The PL value of BDE-209 was predicted based on literature [17] in a QSPR model.
Figure 6 Compares the percent (?×100%) of PBDEs in the particle phase predicted by the Junge-Pankow adsorption model (using c=17.2 Pa cm and θ=1.1×10⁻⁵ cm2/cm3) with the average measured values. Each measured ? value was calculated by the amount of the chemical in the particle phase (F) divided by the total amount of the chemical (F+A) [18,19].
ICRP Model
To assess the deposition flux of inhaled PBDEs and DP in the human respiratory system, this study uses the simplified ICRP model provided by the International Commission on Radiological Protection (ICRP) [20,21]. Inhaled particulate matter is presumed mainly in the nasal cavity of the human respiratory system (Head Regions; HR; including nose, mouth, pharynx and larynx), Tracheobronchial Region (TR) and Alveolar Region (abbreviated) AR). The formula for calculating the Sedimentation Fraction (DF) of different pollutants in different organs of the human respiratory system is as follows?

where, is the deposition flux of the particles in the i-th particle size range at the j-th part of respiratory system; is the deposition coefficient of the i-th particle size segment at the j-th part; Since the calculation process is complicated, is only given the calculation formula in the present study. The details of the other two deposition sites are referred to as Bair [21]. is the concentration of pollutants subject to different particle sizes, ng/m3. is the breathing rate of normal adults, taken as 0.45 m3/h. is inhalable part of the particulate matter and is the particle size of the particles (μm).
Respiratory Exposure Risk Assessment
Exposure risk was assessed by deposition flux of PBDEs and DP in various organs of the respiratory system. The non-cancer risk of respiratory exposure to particle-bound PBDE and DP is estimated by the Hazard Quotient (HQ), defined by: 
where, and are the daily intake (pg/d), calculated by deposition flux (D, pg/h) and daily exposure time (h/d), BW is body weight. According to the results of a questionnaire survey conducted by the professional workers in the dismantling workshop, the average weight of the workshop workers is 65 kg and exposure time is taken as 10 h. is a reference dose [2].
References
- LA Guardia MJ, Hale RC, Harvey E (2006) Detailed polybrominated diphenyl ether (PBDE) congener composition of the widely used penta-, octa-, and deca-PBDE technical flame-retardant mixtures. Environmental Science & Technology 40: 6247-6254.
- United States Environmental Protection Agency (2010) An Exposure Assessment of Polybrominated Diphenyl Ethers. United States Environmental Protection Agency, Washington, D.C., USA.
- ZHANG T, HUANG YR, CHEN SJ, LIU AM, XU PJ, LI N, QI L, REN Y, ZHOU ZG AND MAI BX. 2012. PCDD/Fs, PBDD/Fs, and PBDEs in the air of an e-waste recycling area (Taizhou) in China: current levels, composition profiles, and potential cancer risks. Journal of environmental monitoring : JEM 14: 3156-3163.
- Chen D, Bi X, Zhao J, Chen L, Tan J, et al. (2009) Pollution characterization and diurnal variation of PBDEs in the atmosphere of an E-waste dismantling region. Environ pollut 157: 1051-1057.
- Deng WJ, Zheng JS, Bi XH, Fu JM, Wong MH (2007) Distribution of PBDEs in air particles from an electronic waste recycling site compared with Guangzhou and Hong Kong, South China. Environ Int 33: 1063-1069.
- Tian M, Chen Sj, Wang J, Zheng Xb, Luo X, et al. (2011) Brominated flame retardants in the atmosphere of E-waste and rural sites in southern China: Seasonal variation, temperature dependence, and gas-particle partitioning. Environ Sci Technol 45: 8819-8825.
- Bidleman TF (1988) Atmospheric processes: Wet and dry deposition of organic compounds are controlled by their vapor-particle partitioning. Environmental Science & Technology 22: 361-367.
- Lee WMG, Tsay LY (1992) Partitioning model of polycyclic aromatic hydrocarbons between the gas and particulate phases in urban atmosphere. Journal of the Chinese Institute of Engineers 15: 67-75.
- LI W, Shen G, Yuan C, Wang C, Shen H, et al. (2016) The gas/particle partitioning of nitro- and oxy-polycyclic aromatic hydrocarbons in the atmosphere of northern China. Atmospheric Research 172-173: 66-73.
- Guo J, Lin K, Deng J, Fu X, Xu Z (2015) Polybrominated diphenyl ethers in indoor air during waste TV recycling process. Journal of hazardous materials 283: 439-446.
- Pankow JF (1994) An absorption-model of gas-particle partitioning of organic-compounds in the atmosphere. Atmos Environ 28: 185-188.
- Goss KU, Schwarzenbach RP (1998) Gas/Solid and gas/liquid partitioning of organic compounds: Critical evaluation of the interpretation of equilibrium constants. Environmental Science & Technology 32: 2025-2032.
- Simcik M, Franz T, Zhang AH, Eisenreich S (1998) Gas-particle partitioning of PCBs and PAHs in the chicago urban and adjacent coastal atmosphere: States of equilibrium. Environ. Sci. Technol. 32: 251-257.
- Tittlemier SA, Halldorson T, Stern GA, Tomy GT (2002) Vapor pressures, aqueous solubilities, and Henry's law constants of some brominated flame retardants. Environ Toxicol Chem 21: 1804-1810.
- Pankow JF (1987) Review and comparative-analysis of the theories on partitioning between the gas and aerosol particulate phases in the atmosphere. Atmos Environ 21: 2275-2283.
- Wong A, Lei YD, Alaee M, Wania F (2001) Vapor pressures of the polybrominated diphenyl ethers. J Chem Eng Data 46: 239-242.
- Huiying X, Jianying Z, Yanhua W, Li L (2008) QSPR studies on the physicochemical properties of polybrominated diphenyl ethers using theoretical descriptors derived from electrostatic potentials on molecular surface (in chinese). Environmental Science 29: 398-408.
- An T, Zhang D, Li G, Mai B, Fu J (2011) On-site and off-site atmospheric PBDEs in an electronic dismantling workshop in south China: Gas-particle partitioning and human exposure assessment. Environ Pollut 159: 3529-3535.
- Chen LG, Mai BX, Bi XH, Chen SJ, Wang XM, et al. (2006) Concentration levels, compositional profiles, and gas-particle partitioning of polybrominated diphenyl ethers in the atmosphere of an urban city in South China. Environ Sci Technol 40: 1190-1196.
- HINDS WC (1999) Aerosol technology : Properties, behavior, and measurement of airborne particles. Journal of Aerosol Science 31: 1121-1122.
- BAIR WJ (1989) Human respiratory tract model for radiological protection: 0041 revision of the ICRP Dosimetric Model for the Respiratory System. Health Phys 57: 249-252.
Citation: Cao H, Li Y, Li Z, Zhao L, Mao X, et al. (2019) Occurrence and Occupational Risk of Polybrominated Diphenyl Ethers (Pbdes) and Dechloran Plus (DP) in a Formal E-Waste Recycling Plant, Northwest China. J Environ Sci Curr Res: S2001.
Copyright: © 2019 Hongmei Cao, et al. This is an open-access article distributed under the terms of the Creative Commons Attribution License, which permits unrestricted use, distribution, and reproduction in any medium, provided the original author and source are credited.