Prolonged Exposure to Ultrafine Black Carbon (UBC) in Combination with Microbial Proxies Trigger Oxidative, Proliferative, and Innate Immune Perturbations in Pulmonary Lung-Derived Cells
*Corresponding Author(s):
M Esther SalinasDepartment Of Biological Sciences, Border Biomedical Research Center, University Of Texas At El Paso, 500 West University Avenue, El Paso, Texas, United States
Tel:+33 0178651141,
Email:MARIAESTHER.SALINAS@PENNMEDICINE.UPENN.EDU
Abstract
Particulate Matter (PM), one of the main criteria pollutants identified by the US-EPA, consists of particles produced from the incomplete combustion of burning fuels. Ultrafine particles comprise a substantial proportion of outdoor PM, including ultrafine black carbon or UBC (<100nm). Upon inhalation, UBC weaken lung health due to their minute size, their ability to enter the respiratory tract, and their capacity to translocate across distant, secondary targets. Data acknowledging cytotoxic carbonaceous nanoaerosol effects on pulmonary-immune cell behavior is indeed lacking. We hypothesized that prolonged in vitro exposure to nanocarbon contributes to cellular stress, impairs cell-cycle activity, and significantly elicits a counter-response to short-term microbial proxies. Human (A549) and murine (LA4) epithelial lung cells, human THP1 monocytes, and murine RAW264.7 phagocytes were seeded on day zero then given UBC (at 0.3, 1.0, and 3.0μg/mL) on days 1, 4, and 7. For this set of assays, multiple markers of oxidative damage and proliferative activity were measured after continuous UBC insult. This showed an imbalance of cellular anti-oxidant/pro-oxidant levels, modification to inner mitochondrial membrane potential, and abnormal cell-cycle activity. In addition, UBC-treated cells were succumbed to three microbe-like mimics on day 9. All extracellular measurements for the second section of our study were performed on day 10. Cumulative administrations to different microorganisms (LPS, Poly I: C, and Zymosan) following exposure to 3.0μg/mL-UBC generated disproportionate oxidant trends and increased cytokine production depending on cell type. To conclude, microbial challenges in the presence of UBC caused an observable shift for cellular behavior, suggesting that continuous ultrafine-PM exposure can potentially alter inflammatory function in vitro.
Keywords
Ambient nanosized aerosol; Cell-cycle analysis; Cytokine production; Mitochondrial health; Oxidative stress; Phagocytosis; Reactive oxygen species; Ultrafine black carbon
ABBREVIATIONS
ELISA: Enzyme-Linked Immunosorbent Assay
GSH: Reduced glutathione tripeptide of L-glutamine, L-cysteine, and glycine
IFN: Interferon
IL: Interleukin
NAAQS: National Ambient Air Quality Standards
PAMP: Pathogen-Associated Molecular Pattern
PM: Particulate Matter
RNS: Reactive Nitrogen Species
ROS: Reactive Oxygen Species
TCEQ: Texas Commission on Environmental Quality
TGF: Transforming Growth Factor
TLR: Toll-Like Receptor
TNF: Tumor Necrosis Factor
UBC: Ultrafine Black Carbon
US-EPA: United States-Environmental Protection Agency
INTRODUCTION
The Texas Commission on Environmental Quality (TCEQ) requires that emissions from both “point” (a single, identifiable source) and “non-point” sources should be calculated and properly reported to the public. TCEQ’s air quality division maintains that emissions originating from on-road mobile sources such as combustion-related emissions from tailpipes must be identified at the state level [1]. At the federal level, the National Ambient Air Quality Standards (NAAQS) were set as part of the Clean Air Act legislation several decades ago. The NAAQS statute established primary and secondary national air quality standards; particulate matter or PM is included as one of six criteria air pollutants. As stated by the United States Environmental Protection Agency (US-EPA), these outdoor pollutants are known to harm the environment and negatively affect public health [2,3]. Fine (<2.5µm in diameter) and coarse (<10µm diameter) PM is closely monitored and regulated across the US by this agency [2]; moreover, exposure to a combination of these particles causes a number of nanoparticle-influenced illnesses of the lung [4]. Furthermore, no standards are currently in place for ultrafine PM, <100nm in diameter, or PM0.1 [2], so it remained compulsory to devise an investigation using the effects of, specifically, nanocarbon particles.
Inhaling PM0.1 inflicts severe risks to a given population, where the lung is the primary target organ [5]. Pollution from PM at this aerodynamic diameter can easily pass through the throat and into the deeper cavities of the lung [6]. PM0.1 or nanoaerosol fractions of pollutants can originate from natural sources such as forest fires and from human activities like agricultural practices and transport emissions [7,8]. A study focusing on the El Paso air shed, proximate to the Bridge of the Americas (BOTA), found that ultrafine particles represent 95% of the total particulates at the border crossing between Ciudad Juarez, Chihuahua, Mexico and Texas [9], pinning local residents at higher risks of exposure [10-12]. Particle surface area directly relates to the gravity of health-related conditions affecting residents in proximity to economically advancing and developing regions. Compromised functionality of the lung was reported by people living less than 100 meters away from heavy-traffic metropolitan areas [4].
Numerous research-based evidence using in vitro experiments stress the importance of exploring the harmful effects from nanoparticle exposure and linking these with declining human health. It has been reported previously that the majority of combustion by-products are comprised of UBC [6,13,14]. Ultrafine black carbon monomers (~14nm) and carbon black aggregates (<260nm) have been tested on macrophages and monocytes; only UFP are known to induce oxidative damage, cause nuclei deformation/shrinkage, and aggregation of chromatin structures seen in vitro [15,16]. Research concerning inhalable aerosol pollution provides insight whereby these may cause deleterious lung health [17-25]. Both metal oxide nanoparticles and urban UFP can easily access, transport across the blood barrier, and remain in the tissues/organs even after 24hr [26]; alarmingly, these materials may even reappear at different locations via macrophage-mediated transport [27].
The World Health Organization (WHO) stated that air pollution-related deaths are closely linked to exposures to Particulate Matter (PM), described as a mixture of carcinogens, carbon compounds, and other “health-harming substances” [28,29]. Carbon black or Ultrafine Black Carbon (UBC) is a soot-like PM that encompasses a significant percentage of PM, with primary particles sized less than 100nm [30]. Black carbon materials are in high demand for numerous industrial applications including the production of rubber, tires, and printing inks [31]. Black carbon interactions have shown that ambient particulate pollution, precisely from UBC exposure, can lead to serious health effects [32]. Moreover, in vitro and in vivo models have demonstrated that accumulation of UBC causes toxicity as well as mitochondrial dysfunction and DNA damage [31,33,34]. Since UBC is largely found suspended in the atmosphere, the most common health risks associated with UBC are often lung diseases [35,36]. Inhalation of PM leads to pulmonary inflammation can subsequently spread to systemic inflammation [37,38]. [39], inflammation is characterized by pain, redness, swelling, and loss of function. Pulmonary inflammation, essential to the immune response, mainly triggers biochemical reactions from negative conditions affecting the airways. Common respiratory illnesses such as acute lung irritation and asthma involve inflammation in the lungs leading to shortness of breath, cough, and wheezing [39].
According to the Canadian Centre for Occupational Health and Safety, there are four ways particulates deposit in the lungs when inhaled [40]. Particles sized 0.5µM or less are more commonly deposited in the bronchial region of the lungs through sedimentation. Smaller particles, on the other hand, can be transported by diffusion to the alveoli due to their extremely fine size [40]. Cells found in these regions can mediate several inflammatory responses in the presence of an irritant. Macrophages, or professional phagocytic cells, found in the lung include pulmonary alveolar macrophages play a role in maintaining lung immunity [41]. The presence of antigens or particulates in the lung leads to the activation of innate immunity, which is the first line of defense against a variety of dangers stemming from exterior origins [42]. Both inflammation and oxidative stress contribute greatly to the injurious effects from air pollution on the respiratory system [27]. Innate immunity must be closely evaluated since chronic insult from external materials in the airways may impair pulmonary function.
Moreover, in vitro studies suggest that pulmonary fibrosis and carcinogenesis can be due to chronic inflammation brought upon by stress to internal cellular components [43-45]. This stress may contribute to a notable imbalance of antioxidants/pro-oxidants and measurable cell-cycle disturbances and are attributed to interactions with nano-or UFP [46,47]. The above in vitro models have detailed stress-induced generation of Reactive Oxygen Species (ROS) and subsequent oxidative damage from particle deposition while suggesting that they could impact downstream lung function. Nonetheless, the research mentioned above reported the detrimental effects at much shorter time frames (10-72 hours) and higher concentrations of nanocarbon exposures (10-500μg/mL) in comparison to our present work.
Long-term (>7 days), low-dose (<10μg/mL) in vitro studies investigating industrial activity, pulmonary pathology, and long-term Ultrafine Black Carbon (UBC) remain understudied. We predicted that sustained exposure from low-level concentrations of carbonaceous nanoparticles alter cellular function by affecting mitochondrial fitness and modifying cellular life-cycle. An in vitro regimen was used herein to obtain a closer estimation of cellular responses from contact to ultrafine aerosol by investigating cellular behavior upon additive exposure to nanocarbon particles at low doses. Human pulmonary epithelial cells (A549), THP1 human peripheral-blood monocytes (macrophage precursors), murine macrophages (RAW264.7), and murine pulmonary epithelial cell (LA4) lines were analyzed. The four different cell types were individually exposed to increasing amounts of UBC suspended in cell culture media (0.3, 1.0, and 3.0μg/mL) to the completion of 10 days. Oxidative stress indicators, such as ROS accumulation, free intracellular glutathione levels, mitochondrial membrane potential, as well as, proliferative activity (cell-cycle analyses) were conducted to address our conjecture. Results showed that the three low-dose concentrations of UBC administered over a 9-day period induced oxidative damage at a moderate rate and provoked a change to cell-cycle activity. GSH (reduced or free glutathione) levels severely increased compared to the untreated control yet decreased in a pollutant-dependent manner for all cell lines. Mitochondrial membrane health yielded depolarization across both human lung epithelial cells and monocytes; murine phagocytes remained in a hyperpolarized state (no significant damage to RAW264.7 mitochondrial fitness seen). These results indicated that sub toxic UBC availability disturbed intracellular health by causing moderate responses against anti-oxidant stress (intracellular GSH) and mitochondrial membrane health alterations (JC-1 staining). Significant perturbations compared to normal cell-cycle profiles were found for all cell types. This 9-day exposure approach demonstrated that UBC particles adversely and subtly deter normal mammalian cell behavior; each cell line responded uniquely.
The authors aimed to determine whether UBC alone or UBC plus combined microbial proxy treatments affected the immune response. Long-term UBC burden in conjunction with short-term microbial stimulation were assessed to understand how pulmonary-immune function was modified. This part of the project was conducted to investigate innate immune function following cumulative impact from UBC in combination with varied microbe-like challenges. The cells were exposed to a 3.0μg/mL nanocarbon suspension every third day up to day 9. Three different microbial stimulants were administered to UBC-treated cells for a period of 24hr (from the 9th-10th day). Indicator markers of innate immunity, such as extracellular nitric oxide or NO2-(a stable nitrite metabolite), reactive oxygen species, cytokine production (pro-and anti-inflammatory), and phagocytosis analyses were assessed following the additive UBC “plus” microbes (defined as UBC+M). Data indicated that continuous, sub toxic dosages of UBC in combination with microbe-like proxies administered from day 9 to day 10 affected oxidant and cytokine production compared to the untreated cell control. In addition, phagocytic activity was severely compromised across the RAW264.7 macrophage line.
MATERIALS AND METHODS
Nanocarbon material
Black carbon (Vulcan XC-72) purchased from Cabot Corporation (Billerica, MA) was used for all assays. Carbon nanoparticles, or UBC, have been characterized by Soto et al., by Transmission Electron Microscopy (TEM) using a Hitachi H-8000 analytical TEM operated at 200kV accelerating potential fitted with a goniometer-tilt stage and a Noran Energy Dispersive (X-Ray) Spectrometer (EDS) [48]. For this study, nanocarbon suspensions of 10mg/mL were sonicated in warm 1X PBS (Fisher Scientific, Pittsburgh, PA) and diluted to 100µg/mL. These were further diluted in complete cell culture media and subsequently re-homogenized prior to cell administration in order to lessen particle aggregation.
Cell culture conditions
Cell lines (A549, LA4, THP1, and RAW264.7) were purchased from the American Type Culture Collection (ATCC, Manassas, VA). The adherent epithelial human A549 and murine LA4 lung cells were cultured in F-12K Media (Kahn’s), supplemented with 10% Fetal Bovine Serum (FBS) and 1% penicillin-streptomycin (Fisher Scientific, Pittsburgh, PA). Adherent murine macrophages RAW264.7 were grown in Dulbecco’s Modified Eagle Media (DMEM), supplemented with 10% FBS, 100U/mL penicillin and 100µg/mL streptomycin, 1mM sodium pyruvate, 3.7g/L sodium bicarbonate, and 2mM glutamine (GlutaMAX) (Fisher Scientific, PA). Non-adherent THP1 monocytes were cultured in Roswell Park Memorial Institute (RPMI 1640) media, supplemented with 0.05% β-mercaptoethanol, 10% FBS, 100U/mL penicillin and 100µg/mL streptomycin, 1mM sodium pyruvate, and 2mM glutamine (GlutaMAX) (Fisher Scientific, PA). The incubation conditions were maintained at 37°C and a 5% CO2 environment for all cells.
Exposure regimen
6-well plates (Fisher Scientific, Pittsburgh, PA) were used to seed at a density of 1,500 cells per well on day “0” and allowed to attach for 24hr prior to UBC-particle treatments. Depending on the assay type, the following groups consist of: [A] (1) untreated cells; (2) H2O2-treated cells; (3) 0.3µg/mL UBC-treated cells; (4) 1.0µg/mL UBC-treated cells; and (5) 3.0µg/mL UBC-treated cells or [B] (1) untreated cells; (2) 3.0µg/mL UBC-treated cells; (3) 3.0µg/mL UBC+M1 cells; (4) 3.0µg/mL UBC+M2 cells; and (5) 3.0µg/mL UBC+M3 treated cells. On day 1, the cells were either treated with all three UBC concentrations where two groups per cell type remained untreated to serve as controls for set [A] or treated with the highest concentration of UBC where one group remained untreated to serve as a “media only” control for set [B]. It follows for set [A]: experimental wells were replenished with UBC (0.3, 1.0, and 3.0µg/mL) on days “4” and “7” and untreated groups received only fresh media. On the 9th day, one set of untreated wells was exposed to hydrogen peroxide (10mM H2O2) as a positive control for toxicity unless otherwise indicated. On the 10th day, all 5 groups were harvested, centrifuged, and re-suspended in 1-2mL of ice-cold 1X PBS for subsequent assays. For set [B]: experimental wells received sustained UBC (at 3.0µg/mL) on days “4” and “7” where untreated control groups received fresh media. On the 9th day, one set of wells was exposed to 10mM H2O2 as a positive control for toxicity unless otherwise noted. The microbial stimuli section below describes the additive administrations of 3.0µg/mL UBC in detail with three different microbe-like (M1, M2, or M3) infections. On the 10th day, all groups were harvested, centrifuged, and re-suspended in 1mL of ice-cold 1X PBS to conduct experiments. Aliquots involving only supernatant studies were stored at -20ºC immediately after collection; these were assayed within 4-5 weeks.
Microbial stimuli
Following nine days of sustained UBC treatments, the cells were treated with three Toll-like receptor (or TLR) ligands. The different TLRs were administered to the UBC-treated cells for 24hr (from day 9 to day 10). The following were used as proxies to mimic microbial contaminants suspended in phenol-red free compete DMEM: lipopolysaccharide to simulate a bacterial-like infection (or LPS); polyinosinic-polycytidylic acid to mimic a viral-like infection (or Poly I: C); Zymosan (Zymo) of yeast origin to simulate a fungal-like infection (Fisher Scientific, PA). The treatments for these microbes were handled at the following final concentrations: 0.5X LPS, 500µg/mL Poly I: C, and 250µg/mL Zymo. The TLR ligands that were targeted include TLR-2, 3, and 4, where LPS binds TLR-4, Poly I: C interacts with TLR-3, and Zymo targets TLR-2. All TLRs in this study are found to be membrane-bound, while only Poly I: C can be internalized into cellular phagosomes as well. Every microbial stimulus is labeled and written throughout the manuscript, as indicated: M1(LPS), M2(Poly I: C), and M3(Zymo).
ROS detection using confocal imaging
Reactive Oxygen Species (ROS) generation was qualitatively presented using a fluorescent dye-based assay. Digital high-resolution fluorescence images were captured by using a confocal microscope equipped with an EC Plan-Neofluar 40x magnification/1.30 oil DIC objective (LSM 700 confocal microscope, Zeiss, New York, NY). For each sample, two fluorescence channels were utilized with excitation/emission wavelengths of 358⁄461 for DAPI and ~644/665nm for CellROX. For this series of experiments, all images were equally handled and analyzed by using the ZEN 2009 Software (Zeiss, New York, NY). The CellROX Deep Red reagent (Thermo-Fisher Scientific) is cell-permeable and non-fluorescent while in the reduced state. Following 9 days of treatment (Exposure regimen section), the cells were collected, washed, and transferred to conical tubes (Fisher Scientific, Pittsburgh, PA). A 1mL volume of 1X DMEM (phenol-red free) was used to wash the samples. A 500µL aliquot from this cell suspension was mixed with a 500µL aliquot of the CellROX Deep Red reagent to achieve a final concentration of 5µM. The samples were first stained for 30min using dark-incubated conditions at 37ºC then washed with 1ml of 1X PBS. Subsequently, the cells were counterstained with 500µL of 10µg/mL 4′, 6-diamidino-2-phenylindole (DAPI, 5µg/mL final concentration), fixed with 500µL of 2% paraformaldehyde (PFA, 1% final concentration), and re-plated after 10 min on black walled 96-well plates suitable for microscopy (Falcon, Corning Inc. Corning, NY). Co-localization is visible.
Intracellular oxidative damage
The content of intracellular stress by reduced glutathione (free GSH) depletion after exposure to nanocarbon particles was conducted via GSH-Glo Glutathione Assay (Promega Corporation, Madison, WI). The luminescent-based method determined the level of free GSH from cells in suspension and directly measured anti-oxidants produced in response to oxidative stress. After 9 days of UBC treatment (see Exposure regimen), the cells were harvested and transferred to white wall 96-well plates (Fisher Scientific, Pittsburgh, PA). According to the manufacturer’s instructions, the first component (GSH-Glo) was added and the plates incubated at Room Temperature (RT) for 30min. The second component (luciferin detection reagent) was added to the wells and incubated at RT for an additional 10-15min. The samples were read via Luminoskan Ascent Software v2.6 (Thermo Fisher Scientific Ascent Luminometer v2.5). Free GSH concentrations (in µM) were determined by interpolation from a generated GSH standard curve. Experimental samples along with associated controls were assessed in parallel.
Mitochondrial membrane health
Analysis of mitochondrial health after exposure to nanocarbon was conducted via MitoProbe JC-1 Assay Kit (Life Technologies Corporation, Carlsbad, CA) and flow cytometry. This quick-stain method determined the percentage of cells in suspension with damaged mitochondrial membranes or depolarized profiles. Following 9 days of UBC treatment (from Exposure regimen above), the cells were harvested and transferred to flow cytometry tubes (Fisher Scientific, Pittsburgh, PA) in triplicates. 2.0µL of JC-1 (5’,6,6’-tetrachloro-1,1’,3,3’-tetraethylbenzimidazolylcar-bocyanine iodide) cationic dye was added to each sample for a final concentration of 2.5µM and then incubated at 37ºC with 5% CO2 for 30min. The cells were rinsed in 1X PBS and read immediately via flow cytometry (Beckman Coulter FC500 Flow Cytometer Cytomics Analyzer System). Approximately 10,000 to 100,000 events (cells) were acquired per sample and analyzed by utilizing CXP software (Beckman Coulter). Each experimental sample along with the associated controls were performed in parallel.
Cytometric proliferative analysis
Perturbations to normal cellular cycle progression were assessed using a Nuclear Isolation Medium (NIM) containing the DNA intercalating agent, DAPI, and flow cytometry. The NIM-DAPI reagent stains and cross-links cell nuclei allowing the quantification of DNA content in a cell population. Lung-derived cells (1,500 cells/well) were treated with different concentrations of UBC for 9 days (see Exposure regimen). The cells were harvested on day 10 and rinsed in 1mL of 1X PBS. 100µL of re-suspended cells in 1X DMEM (phenol-red free) and 200µL of nuclear isolation medium and 4',6-diamidino-2-phenylindole solution (NIM-DAPI; Beckman Coulter) were gently mixed in flow-cytometry tubes (Fisher Scientific, Pittsburgh, PA) just before measurement using a Gallios Flow Cytometer (Beckman Coulter). NIM-DAPI-stained cells were read after excitation. About 1x10⁴ to 1x10⁵ events were collected and analyzed per sample using the Kaluza Flow Cytometer Software (Beckman Coulter). Experimental samples along with associated controls were similarly examined. RAW264.7 murine macrophage cycle distributions are shown: Hypodiploid, diploid, hyperdiploid, and tetraploid.
Extracellular oxidative stress
The production of a stable nitrite metabolite (NO2-) using the Griess Reagent System (Promega Corporation, Madison, WI) was measured spectrophotometrically (Molecular Devices). The sulfanilamide and N-1-Napthylethylenediamine Dihydrochloride (NED) colorimetric assay is used to detect the extracellular production of the NO2- stress marker. Following 9 days of UBC treatment (see Exposure regimen), the cells were exposed to three microbes for 24hr. After, the supernatants were collected and re-plated on 96-well plates (Fisher Scientific, PA). As per the manufacturer’s instructions, sulfanilamide and NED solutions were added to all samples. A color change was seen after the addition of NED. A microplate reader was used to analyze the samples at 540nm (SPECTRA Max190 Microplate Spectrophotometer). NO2- levels were calculated (in µM) from a sodium NO2- ladder provided by the system. Each experimental sample along with associated controls were simultaneously examined.
ROS monitored via carboxy-H2DCF-DA
ROS accumulation was measured using the fluorescence-based 6-carboxy-2', 7'-dichlorodihydrofluorescein diacetate or carboxy-H2DCF-DA (Fisher Scientific, PA) fluorescein analog reagent. The carboxy-H2DCF-DA reagent is transformed intracellularly by esterases into a green fluorescent form (carboxydichlorofluorescein) upon oxidation. Negative charges impede any leakage of this fluorescent molecule. Following 9 days of UBC treatment (see Exposure regimen section), the cells were further treated with three distinct microbes for 24hr. After incubation, the samples were collected, washed, and transferred to black wall 96-well plates (Fisher Scientific, PA). Each experimental sample and corresponding control (untreated cells) were simultaneously evaluated. The suspensions were gently mixed and read via Fluoroskan Ascent Software v2.6 (Thermo-Fisher Scientific Ascent Fluorimeter, v2.5) at 490nm excitation and 520nm emission wavelengths. ROS generation) was determined by continuously scanning the plates over a 12hr period (collected at time points 240, 360, 480, 600, and 720min) while the incubation temperature inside the Fluorimeter remained constant at 37°C. The left panel shows linear curves for Fluorimeter Units (FU) over 720min, and the right panel further expresses this data as the sum of area under the curve or Σ AuC (FU*min).
Cytokine analyses
Pro-inflammatory and anti-inflammatory cytokines were both assessed via commercially available Enzyme-Linked Immunosorbent Assay (ELISA) kits (BD Biosciences Pharmingen, CA and R&D Systems, MN). Interleukin-1 beta and tumor necrosis factor alpha (IL-1β and TNF-α) as well as interleukin-4 and transforming growth factor-1 beta (IL-4 and TGF-1β) were measured. ELISA analyses were performed according to manufacturer protocols. In brief, clear ELISA plates (Fisher Scientific, PA) were coated overnight with the corresponding capture antibody at 4°C. The wells were blocked at room temperature; the cultured supernatants from all the 3.0µg/mL UBC-treated cells containing individual microbes (M1, M2, and M3) were added. In addition, the plates were incubated alongside a biotin-conjugated anti-cytokine antibody followed by a streptavidin-horseradish peroxidase conjugate (HRP-label). The TMB chromogenic substrate solution- containing 3.3', 5.5'-tetramethylbenzidine- was used to develop a colorimetric output after 15-30min (Fisher Scientific, PA). A microplate reader was then used to measure absorbance at a wavelength of 450nm (SPECTRA Max190 Microplate Spectrophotometer). Individual cytokine concentrations were concurrently calculated (in µM) from a cytokine standard provided by each of the ELISA kits. Untreated controls along with all experimental groups were analyzed in parallel.
Phagocytic/endocytic activity
Cellular phagocytic activity (ability to engulf other particles) was determined using the Vybrant Phagocytosis Assay (Life Technologies Inc., NY). This method measures bioparticles’ engulfment using a fluorescent label. The fluorescently labeled particles are directly proportional to the amount of phagocytosis or internalization activity detected across the cell samples. Cells were seeded at a density of 1x10⁴ per well (or 100µL from a 1x10⁵ cells/mL solution) in 96-well black-walled plates (Fisher Scientific, PA) and incubated for 2hr with fluorescein-labeled Escherichia coli Bio Particles (K-12 strain) at 37°C. The cells containing bioparticles were subsequently treated with try pan blue in order to quench any E. coli bioparticles that were not internalized for 1min (fluorescent particles engulfed by the cells are exclusively measured). The solutions were vacuum aspirated from each well; the plates were analyzed immediately using the Fluoroskan Ascent Software v2.6 (Thermo Fisher Scientific Ascent Fluorimeter, v2.5) at 490nm excitation and 520nm emission wavelengths. A media control, a 10mM H2O2 control, and three respective experimental (0.3-3.0µg/mL UBC) treatments were studied concurrently.
Statistical approach
Significant differences between control groups (untreated control or toxicity control) and experimental groups were evaluated using R Project for Statistical Computing by applying a one-way ANOVA with a post-hoc Tukey Kramer test at a significance level of *p
RESULTS
Excess oxidative damage can promote the generation of Reactive Oxygen Species (ROS), cause stress, and elicit responses that may impact cellular health. Consequently, ROS was determined qualitatively using microscopy and the CellROX Deep Red dye, which generates red ROS fragments for visualization. Following 9 days of UBC treatment, all cells were prepared and confocal images were acquired on the tenth day. Untreated cells, 10mM H2O2-treated cells, and the highest UBC-treated groups for each cell type are shown/as seen in figure 1 (A-L). Red species appear to be heavy in some regions and absent in others. Human epithelial line (A549) and monocytic (THP1) media control groups show background ROS fragments indicative of long-term incubation. The murine epithelial line (LA4) showed a higher amount of ROS staining for the UBC experimental group relative to the untreated control. On the other hand, murine RAW264.7 macrophages had relatively equal ROS species across both control groups (media control and H2O2 control) along with the UBC experimental sets.
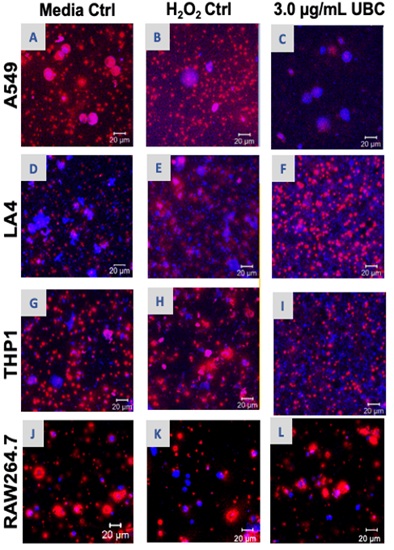
Figure 1: Continuous, low level UBC administered over 9 days may protect certain cell lines from excessive damage as portrayed by confocal imaging.
Note: Images captured upon UBC treatments at the day 10 mark as described in Materials and Methods across all the various cell types in this study. These were recorded by confocal microscopy using an LSM 700 Confocal Microscope System (LSM 700-generation systems, Carl Zeiss) and observed with Zeiss Zen software program at a 40X magnification: Media “untreated” control, 10mM H2O2 control, and the highest 3.0µg/mL UBC-treated cells are shown across all cells: A549 (A-C), LA4 (D-F), THP1 (G-I), and RAW264.7 (J-L). Confocal images represent a minimum of 2-3 experiments.
Reduced glutathione or free GSH levels were quantified to measure intracellular damage as a result of 9 days of continuous UBC exposures. All samples were prepared for free GSH bioluminescent analysis on the tenth day. Media only (untreated) cells, 10mM H2O2-treated cells, and all three UBC-treated groups across all cell lines are depicted in figure 2 (A-D). Free GSH levels were between 2 and 12.5µM for human A549 cells and between 2.5 and 15µM for the murine LA4 cells; between 1.0 and nearly 3.0µM for the THP1 monocytes; and finally between 0.4 and almost 0.8µM for the RAW264.7 murine macrophages. Significant values showing differences between the untreated and the UBC-treated groups were reported for the following cell lines: A549 (low-UBC level), LA4 (low-UBC level), THP1 (low- and mid-UBC levels), and for murine RAW264.7 macrophages (low-UBC level). Both A549 and LA4 samples showed about the same range of free GSH content (<15µM); the THP1 and RAW264.7 yielded less than 3.0µM GSH. Refer to table 1 for additional GSH quantitation.
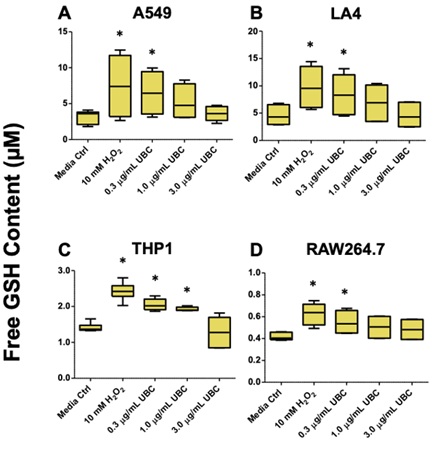
Figure 2: Intracellular GSH depletion was observed across all cell lines as quantified by the bioluminescent based glutathione assay.
Note: On day 10, the cells were harvested and analyzed via bioluminescent-based glutathione assay (A-D). Free GSH concentrations were calculated. Tukey graphs display the mean of 6-8 replicates. Data represent two independent experiments. Statistical significance displayed as *p≤0.05 compared to media control. A 1-way Anova was conducted across all cell lines.
|
Cell Type |
Treatments |
GSH (µM) |
|
A546 |
Media Ctrl |
3.12±0.33 |
|
H2O2 Ctrl (10mM) |
7.47±1.56* |
|
|
0.3µg/mL UBC |
6.51±1.12* |
|
|
1.0µg/mL UBC |
5.26±0.83 |
|
|
3.0µg/mL UBC |
3.59±0.37 |
|
|
LA4 |
Media Ctrl |
4.64±0.66 |
|
H2O2 Ctrl (10mM) |
9.78±1.42* |
|
|
0.3µg/mL UBC |
8.50±1.30* |
|
|
1.0µg/mL UBC |
6.87±1.26 |
|
|
3.0µg/mL UBC |
4.64±0.82 |
|
|
THP1 |
Media Ctrl |
1.41±0.04 |
|
H2O2 Ctrl (10mM) |
2.42±0.08* |
|
|
0.3µg/mL UBC |
2.05±0.06* |
|
|
1.0µg/mL UBC |
1.93±0.02* |
|
|
3.0µg/mL UBC |
1.29±0.17 |
|
|
RAW264.7 |
Media Ctrl |
0.42±0.01 |
|
H2O2 Ctrl (10mM) |
0.63±0.04* |
|
|
0.3µg/mL UBC |
0.55±0.04* |
|
|
1.0µg/mL UBC |
0.50±0.04 |
|
|
3.0µg/mL UBC |
0.48±0.03 |
Table 1: Free intracellular Glutathione (GSH, µM) via bio-luminescent activity across cells.
To assess further cellular fitness after nine days of incubation, mitochondrial health was evaluated. Mitochondrial health can be assessed using several approaches; JC-1 dye was used to examine UBC effects on mitochondrial membrane potential or ΔΨm. ΔΨm is commonly measured using cationic dyes, which accumulate at the negatively charged mitochondrial matrix. As shown in figure 3 (A-D), the extent of mitochondrial depolarization (damage) profiles fluctuated across the cells. In comparison to the matched untreated controls, a statistically significant increase in mitochondrial damage was seen for A549 epithelial cells across all concentrations of UBC (Figure 3A); no change was observed for LA4 epithelial cells (Figure 3B). For the human THP1 monocytes, a significant increase in mitochondrial damage was seen at the highest UBC level (Figure 3C). The extent of health was inversely related to toxicant concentration (Figure 3D) for murine macrophages. Refer to table 2 for additional mitochondrial potential information.
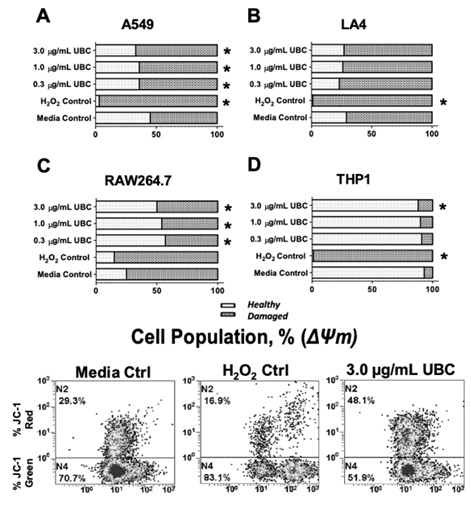
Figure 3: UBC impacted mitochondrial health for all cell lines as measured by cytometric based mitochondrial membrane potential analysis.
Note: On day 10, the cells were harvested and their mitochondrial membrane potential was analyzed via fluorescent JC-1 staining and flow cytometry. About 1x10⁴ to 1x10⁵ events were collected and analyzed per sample using the CXP Software. Cell populations (%) with healthy versus damaged mitochondria are shown for each line (A-D). Percentages were split accordingly between JC-1 singlets (emitting a green fluorescent signal) and JC-1 aggregates (red fluorescent signal) displayed as the mean of 6 replicates. Data represent three independent experiments. Statistically significant at *p≤0.05 in contrast to their corresponding untreated media control. A non-parametric KW was conducted for THP1 monocytes; 1-way Anova conducted for all other cell types.
|
Cell Type |
Treatments |
Mitochondrial Health |
|
A546 |
Media Ctrl |
45.17±1.42 |
|
H2O2 Ctrl (10mM) |
3.34±0.21* |
|
|
0.3µg/ml UBC |
35.83±1.35* |
|
|
1.0µg/Ml UBC |
36.00±0.77 |
|
|
3.0µg/Ml UBC |
32.83±1.60* |
|
|
LA4 |
Media Ctrl |
28.50±5.88 |
|
H2O2 Ctrl (10mM) |
2.00±0.00* |
|
|
0.3µg/ml UBC |
23.00±1.88* |
|
|
1.0µg/Ml UBC |
26.33±2.51 |
|
|
3.0µg/Ml UBC |
27.17±2.30 |
|
|
THP1 |
Media Ctrl |
92.83±0.17 |
|
H2O2 Ctrl (10mM) |
1.00±0.00* |
|
|
0.3µg/ml UBC |
90.67±0.28* |
|
|
1.0µg/Ml UBC |
90.17±0.11* |
|
|
3.0µg/Ml UBC |
87.83±0.25 |
|
|
RAW264.7 |
Media Ctrl |
24.67±1.38 |
|
H2O2 Ctrl (10mM) |
15.00±1.67* |
|
|
0.3µg/ml UBC |
57.00±2.73* |
|
|
1.0µg/Ml UBC |
54.00±3.52* |
|
|
3.0µg/Ml UBC |
49.83±2.73* |
Table 2: Mitochondrial membrane potential (Healthy population, %) across each cell type.
Total cell cycle distribution was investigated to evaluate any changes to cellular conditions potentially induced by low-dose, additive UBC. The nuclear isolation medium containing DAPI, a DNA intercalator, was used after 9 days of contaminant exposure in cells treated with three different concentrations of UBC (0.3, 1.0, and 3.0µg/mL). This examined the progression of each cell-cycle phase by quantifying nuclear DNA content via NIM-DAPI fluorescent signal. Cells emitting low levels of DAPI-DNA fluorescent signal converge with cells undergoing apoptosis potentially carrying fragmented DNA or a sub-G0/G1 cell subpopulation. Cells with high DAPI-fluorescence represented cells experiencing mitosis. In a single-parameter flow cytometry histogram, using an FL-9 detector and 405nm excitation laser for DAPI, the sub-G0/G1 (hypodiploid) subpopulation is located to the left side of the G0/G1 phase. Each dataset (per cell line) was bar plotted to depict cell counts (y-axis) and distributed using four cell-cycle subpopulations across five groups (x-axis), see figure 4 (A-D).
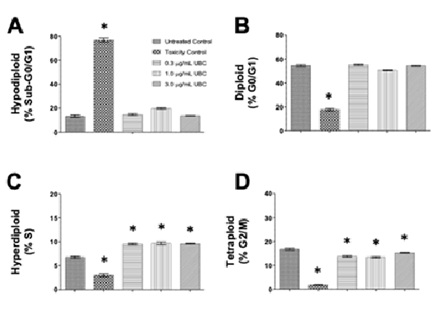
Figure 4: Nanocarbon distorted normal cell-cycle distributions as depicted by cytometry in a dose-dependent mode in the RAW264.7 macrophages.
Note: On day 10, the cells were harvested and their proliferative activity was analyzed. Using the NIM-DAPI protocol, all samples were evaluated for cell cycle profiles via flow cytometry. About 1x10⁴ to 1x10⁵ events were collected and analyzed per sample using the Kaluza Flow Cytometer Software. Datasets are one of 3 independent experiments performed in duplicates, n=6. Statistical significance shown by *p≤0.05 in comparison to untreated controls. Bar graphs indicate the four cytometry gates representing the distribution of cells in each phase of the cycle as: (A) sub-G0/G1 or hypodiploid, (B) G0/G1 or diploid, (C) S or hyperdiploid, and (D) G2/M or tetraploid cell subpopulations. Cell frequency was plotted along the y-axis and the groups were labeled on the x-axis. RAW264.7 murine macrophages are shown here. A 1-way Anova conducted for RAW264.7 at the G2/M phase of this study.
The following DNA proliferation analyses compared the experimental UBC-treated cells against non-treated cells of normal cycling profile consistently across all tested samples. After RAW264.7 cells were exposed long-term to UBC (0.3, 1.0 and 3.0µg/mL), changes in the sub-G0/G1 and G0/G1 phases were imperceptible at all the UBC concentrations tested figure 4 (A,B,D). In contrast, the percentage of RAW264.7 cells in the S phase presented significant increments for all UBC groups whereas a significant drop was depicted across all UBC groups in the G2/M phase (Figure 4C). Additionally, the UBC-exposed A549 cells displayed a dose-dependent increase of the sub-G0/G1 population significantly different at the highest UBC treatment; a significant decrease in the G0/G1 population at the highest dose was also observed. No modification was detected in the S phase. However, the G2/M subpopulation was significantly lower at the 1.0µg/mL and 3.0µg/mL UBC concentrations for the A549 cells in Supplemental Information 1 or SI 1. Moreover, the UBC-treated LA4 cells exhibited a similar tendency, where the sub-G0/G1 subpopulation was increased in a dose-dependent manner, significant at the 3.0µg/mL UBC. No significant changes to the S and G2/M phases were observed for LA4 (SI 2). The UBC-treated THP1 macrophage precursors displayed a significant increment in the sub-G0/G1 phase at the highest UBC concentration (SI 3). Monocytes elicited a significant decrease in the G0/G1 subpopulation at the highest UBC concentration; no significant changes to the S and G2/M phases were observed. The highest UBC dose at 3.0µg/mL caused a significant increased shift in the sub-G0/G1 and G0/G1 phases for the A549, LA4, and THP1 cells (SI 1-3) but not the murine RAW264.7 (Figures 4). Across these, UBC induced significant anti-proliferative activity as evidenced by an arrest in the S phase (Figure 4).
Since immune mediators initiate biochemical signaling, the extracellular presence of nitrite or NO2-was quantitated to evaluate innate immunity. After 9 days of cumulative UBC treatments, the samples were treated with three different microbial products (3.0µg/mL UBC-treated+M1-3 groups); supernatants were collected for nitrite content analysis on the tenth day. Untreated, 3.0µg/mL UBC-treated, and the highest UBC treated +microbe groups are shown for each of the cell lines in figure 5 (A-D). Extracellular NO2- levels were between 2.0 and 3.5µM for A549 cells and between 2.0 and 15µM for LA4 cells; between 0.2 and 0.6µM for human THP1 monocytes; and between 4.0 and 10µM for the murine RAW264.7 macrophages. Statistically significant values between the media control and experimental UBC +microbe treatments were found for the murine LA4 (M1-and M2-UBC groups) and the murine RAW264.7 (M1, M2, M3-UBC groups). Both LA4 and RAW264.7 showed a 5 to 10-fold increase in the production of NO2- (Figure 5B and 5D). A549 and THP1 cell lines did not show statistical differences compared to the corresponding untreated controls (Figure 5A and 5C).
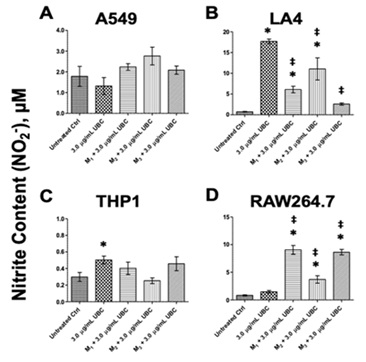
Figure 5: UBC +microbial proxies induced extracellular nitric oxide content as indicated by the colorimetric based nitrite assay.
Note: Upon day 10, the cell supernatants were collected and the by-product of oxidative damage was examined via the Griess Reagent System (A-D). Stable nitrite metabolite content in µM was calculated. The data is displayed as the mean of 8-10 replicates, representative of at least 2 experiments completed independently. Statistical significance displayed as ∗p≤0.05 in comparison to untreated media control. Statistical significance displayed as ‡p≤0.05 in comparison to UBC-treated group only. One-way Anova conducted for both A549 and RAW264.7; KW for the other cells.
Reactive Oxygen Species (ROS) were quantitatively assessed to show the potential impact on innate immunity from UBC using the carboxy-H2DCF-DA assay where Fluorimeter Units (FU) indicated ROS. After 9 days of continuous exposure to UBC, the cells were prepared for ROS analysis on the tenth day. Untreated, 3.0µg/mL UBC-treated, and 3.0µg/mL UBC +microbe groups for each cell line are shown in figure 6 (A-D). ROS indicator units designated the level of cellular stress steadily increasing over a period of 12hr (720min). ROS reached almost 800 FU after the 720min readings for all cells. The data was further analyzed to depict the summation of all areas under the curve (Σ of AuC) to assess statistical differences between every experimental group against the untreated control. As seen on the right panel of figure 6, the AuC analysis found: Significant decrease in A549 for one of the UBC +microbes group; an increase in LA4 for one of the UBC +microbes group; no significant effects were found for THP1; finally, a significant increase in the RAW264.7 lines for two UBC +microbe groups. All Σ AuC calculations indicated elevated ROS at specific experimental samples compared to the untreated control as time progressed.
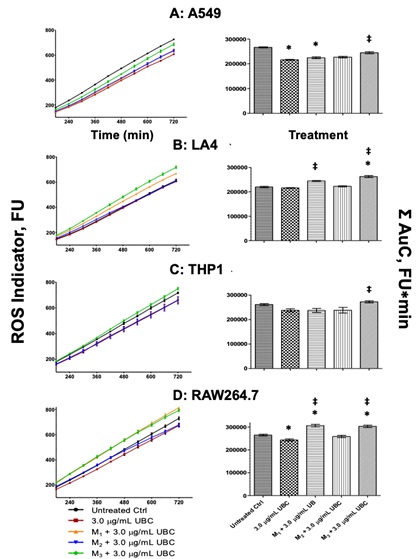
Figure 6: UBC + microbial proxies provoked intracellular reactive oxygen species as shown by the fluorescent based carboxy-H2DCF-DA assay.
Note: On day 10, the cells were harvested and monitored for Reactive Oxygen Species (ROS) over a period of 12hr via fluorescent-based intracellular oxidative damage. Datasets were determined as the mean of 6 duplicates, representative of 3 independent experiments. Statistical significance displayed as ∗p≤0.05 in comparison to media control (untreated cells). Statistical significance displayed as ‡p≤0.05 in comparison to the UBC-treated groups. ROS indicator levels (fluorimeter units, FU) shown for each cell line on the left panel. The sum (Σ) of the AuC (in FU∗min) upon treatment with the highest UBC concentration (3.0µg/mL UBC) shown on right panel. One-way Anova were conducted for THP1 and RAW264.7; non-parametric KW for the other cells.
Inflammatory cytokine levels were evaluated as a third innate immune biomarker. After 9 days of cumulative UBC treatments, the cells were treated with three different microbial proxies (3.0µg/mL UBC-treated +M1-3 groups); accordingly, the corresponding supernatants were collected for cytokine content assessments following the tenth incubation day. Untreated (media only), 3.0µg/mL UBC-treated, and the highest UBC treated +M1-3 groups are shown for each of the cell lines in figure 7 (A-D) and figure 8 (A-D). Figure 7 depicts cytokine concentrations (in µM) that were induced by all cell lines in response to the highest UBC concentration. Neither human A549 nor murine LA4 epithelial lung cells showed significant effects in cytokine production (neither IL-1β nor TNF-α) compared to the media control. THP1 monocytes expressed a significant increase in the Th1 cytokine TNF-α (pro-inflammatory) with no change to TGF-β; RAW264.7 expressed a significant increase in the Th2 cytokine IL-4 (anti-inflammatory) only. Next, cytokine presence was further assessed testing media control groups against the 3.0µg/mL UBC +microbial proxies (M1-3). Figure 8 depicts cytokine induction across all lines in response to 3.0µg/mL UBC-treated +microbe stimulus. The A549 epithelial cells exposed to the 3.0µg/mL UBC treated +M1-3 groups showed a significant increase compared to the media control for IL-1β; no change was observed for TNF-α. The LA4 epithelial cells exposed to the 3.0µg/mL UBC treated +M1-3 groups showed a significant increase compared to the control for both IL-1β (M1) and TNF-α cytokines (M1). THP1 monocytes exposed to the 3.0µg/mL UBC treated +M1-3 groups indicated significant increments compared to the control for IL-1β (M2,3) and TNF-α cytokines (M1,2); no change was evident for TGF-β. RAW264.7 phagocytes exposed to the 3.0µg/mL UBC treated +M1-3 groups indicated significant increments compared to the control for TNF-α (M1,3) and IL-4 (all) cytokines; no change was evident for IL-1β.
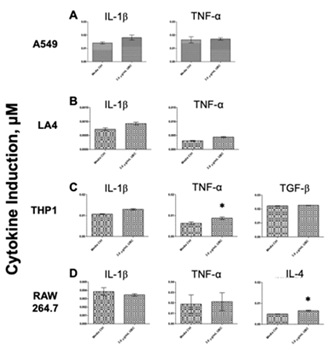
Figure 7: UBC affected cytokine accumulation in both the THP1 and the RAW264.7 as quantitated by ELISA.
Note: Upon day 10, the cell supernatants were collected and cytokine levels were measured via spectrometric ELISA assays (A-D). Cytokine content in µM was calculated and the data is displayed as the mean of 4-6 replicates. Data represent at least 2 experiments completed independently. Statistical significance displayed as ∗p≤0.05 in comparison to media control. See Appendix A for additional information.
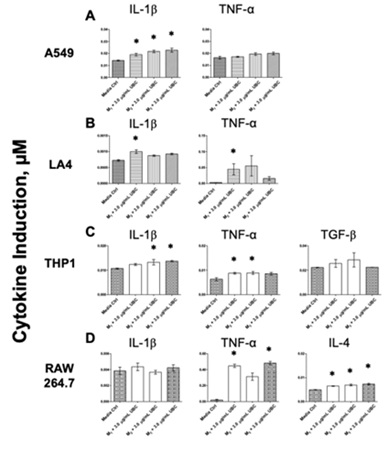
Figure 8: UBC + microbial stimuli altered Th1 and Th2 cytokine levels across all cells as produced by ELISA.
Note: Upon day 10, the cell supernatants were collected and cytokine levels were quantified via ELISA colorimetric assays (A-D). Cytokine content in µM was calculated and the data is displayed as the mean of 4-6 replicates. Data represent at least 2 experiments completed independently. Statistical significance displayed as ∗p≤0.05 in comparison to untreated control. See Appendix A for more details.
Phagocytosis or endocytosis is a process whereby a cell internalizes extracellular material by drawing the material inward while engulfing around it. Therefore, as a final measure of UBC impact on innate immunity, cellular capability to phagocytose material was determined following UBC administrations. Following 9 days of cumulative UBC exposure, the cells were prepared for phagocytic activity (endocytosis in epithelial lines) on the tenth day. Untreated cells, 10mM H2O2-treated cells, and UBC-treated cells are shown in Supplemental Information 4 (SI 4). No significant modifications to phagocytic/endocytic behavior were observed across A549, LA4, or the THP1 monocytes. All UBC groups yielded a statistical decrease in phagocytosis for RAW264.7.
DISCUSSION
The preferred carbon nanomaterial suspensions were chosen to depict dose-responses and were based on previously published data, where the low concentrations approximated potential pollutant presence in the lung [49]. The cumulative doses were at least one log lower in reference to other in vitro respiratory immune models; hence, these findings contribute to understanding how nano-pollutant impacts lung-derived immortalized cells [49]. Nine days of exposure maximized potential UBC impact while minimizing effects from extended incubation. This experimental design consisted of controlled administrations of UBC at low concentrations (0.3-3.0µg/mL) compared to high doses reported prior to this project (10-500µg/mL). Additionally, the following work was conducted over a longer duration unlike existing literature showing acute treatments (10-72 hours). The cell lines tested were chosen because epithelial cells and leukocytes are the first in contact with inhaled particulate matter; both contribute to stress and inflammation in pulmonary tissues [50]. Of importance, airway epithelial cells are essential health defense against infections, participating in innate immunity [51]; macrophages are the most abundant immune cells of the lung, essential for systemic immune responses [52]. The lungs are continuously exposed to a diverse array of microbes and organic/inorganic particulate materials [53]. To find if continuous exposure of lung-derived immortalized cells to UBC alters innate immune function, several immune parameters were measured following a 9-day in vitro regimen of either UBC alone or UBC in combination with microbial challenges. In the second half of this study, cellular innate immunity as a function of oxidative impact, ROS accumulation, cytokine production, and phagocytosis in response to accumulating UBC in the presence or absence of an additional pathogen-like proxy were evaluated. This part of the study consisted of controlled dosages of UBC at 3.0µg/mL “plus” short-term pathogen-mimics to assess cell performance from cumulative exposure to UBC on the tenth day of this experimental design.
Under homeostasis, ROS is continuously produced mainly in the mitochondria but its balance is controlled by several scavenging enzymatic systems [54]. For decades, ROS was identified as harmful to cells; however, they also function as second messengers regulating a number of signaling physiological pathways [55,56]. Elevated levels of ROS results in oxidative stress leading to senescence, lipid peroxidation, and DNA damage, concurrently contributing to several human degenerative illnesses, like chronic inflammation, aging, and cancer [15,57]. It was reported that the mechanism of action used by urban ambient air (PM) eliciting DNA damage was mainly oxidative stress [58,59,60]. In addition, a previous study indicated that the UFP (57 nm soot fraction) from vehicle emissions provoked systemic oxidative stress and DNA damage [61]. We sought to analyze intracellular ROS levels in cells exposed to UBC by using the CellRox Deep Red fluorescent probe and confocal microscopy (Figure 1). Upon oxidation, a red fluorogenic signal indicating oxidative stress was emitted and a visual ROS staining pattern was recorded. The red species reflect where ROS are more heavily concentrated inside the cell, as opposed to cytosolic dispersal. UBC resulted in significant stress in the murine LA4 epithelial line as evidenced by the visible fluorescent species. Neither human A549 epithelial cells nor THP1 monocytes were greatly affected by ROS upon exposure to long-term UBC. Their corresponding UBC-treated groups showed less red species; the cells appear to contain a lower concentration of ROS fragments. This might suggest that the two cell lines could be protected by the compounded UBC exposure following our extended protocol. The present study exhibited that UBC has the ability to induce pro-oxidants mainly for the LA4 line. These epithelial cells originate from the thin layer of the protective barrier in airway cells, cover the surface of the lungs, and provide structural integrity. In contrast, after the UBC insult on the immune system line, RAW264.7, ROS levels were not dramatically altered. Macrophages and neutrophils increase the production of ROS after detection of pathogens [62], and use ROS as critical antimicrobial mediators (pro-oxidants) to eliminate bacteria [63]. Our speculation remained that the macrophages used in this study seemed unable to recognize UBC as potential pathogens and, therefore, do not accentuate ROS production under pollutant presence. Again, this was a qualitative analysis whereby ROS fragments were recorded visually; additional experimentation portrayed support of these images further in this study, where it appears that anti-oxidant levels were promulgated to offset UBC damage in cells.
Despite the minimal toxicity of UBC across most cell lines, we surmised that UBC could deleteriously affect cellular production of oxidants due to ultrafine black carbon’s extremely small size. Intracellular damage was assessed by measuring the level of reduced GSH. Glutathione balance is essential to the function of normal biological mechanisms, although an imbalance in overall glutathione ratios contributes to DNA damage and apoptosis [64]. A change in free glutathione concentration is of importance when assessing toxicological responses; this antioxidant biomarker induces ROS accumulation and potentially nanomaterial-mediated cell death [65,66]. Oxidative injury as a function of antioxidant production from cells exposed to UBC was measured by the bioluminescent activity of intracellular glutathione. Reduced glutathione is an antioxidant metabolite capable of preventing or neutralizing damage caused by ROS. More than 90% of the total glutathione pool exists in healthy tissues in its reduced form (GSH) and less than 10% in its disulfide form (GSSG) [67,68]. Oxidative stress prompts intracellular glutathione production and is essential to keep an overall balance to the redox status and protect intra- and extracellular environment. Certain levels of oxidative stress and subsequent glutathione depletion serve as triggers for increased glutathione production (to replace antioxidant activity) while addressing redox imbalance. Thus, increased levels of free GSH suggests ongoing cellular oxidative stress. Figure 2 indicated that human (A) and murine epithelials (B) and phagocytes (D) were all significantly higher due to UBC interactions after nine days, notably at the lowest level of UBC, 0.3µg/mL. Only the human THP1 monocytic line (C) showed a significant increase in free GSH concentration compared to the untreated control for both 0.3 µg/mL and 1.0µg/mL UBC treatments. While GSH content was higher compared to the media control groups across all cells (except at the highest 3.0µg/mL-toxicant dose), GSH depletion is observed prominently and is directly related to increasing UBC levels. The highest UBC level showed an equal background GSH amount as the untreated cell control for each line. These patterns demonstrate that UBC inflicts a special phenotype across the immortalized cell lines that might suggest less susceptibility or resistance against long-term toxicant insult across all lung-derived cells for the highest 3.0µg/mL-UBC concentration. This modification is not entirely favorable considering the alterations imposed on cell-cycle progression (below) and induction of cellular senescence [69], in response to UBC accumulation. UBC-induced oxidative damage did not seem to supersede the cells’ innate ability to neutralize ROS downstream and could suggest a unique aspect concerning maintenance of a steady-state redox balance.
Although UBC was not found to be particularly cytotoxic for the immortalized cell lines, it remained possible that intrinsic cell health was negatively impacted. Cumulative exposure of epithelial cells and (pre)- phagocytes following UBC exposure were conducted to evaluate mitochondrial membrane potential (or ΔΨm). Mitochondria are important organelles in all eukaryotic cells and play a crucial role as regulators in the control of cellular homeostasis [70]. ΔΨm should be relatively stable; often, alterations reflecting normal physiological activity may be present. Sustained ΔΨm fluctuations in a cell, however, may be injurious [71-74]. An enduring rise or fall of ΔΨm vs. normal background levels may lead to loss of viability causing an increment in various detrimental pathologies downstream [75]. As an indicator for ΔΨm, the membrane-permeant JC-1 polychromatic fluorescent probe is widely used to assess mitochondrial health and to monitor cells with depolarized (damaged) mitochondria via flow cytometry [76]. The JC-1 approach highlighted that LA4 cells are not significantly affected by the nanocarbon particles (Figure 3A). Dissimilarly, the human epithelial cells, murine macrophages, and human monocytes were all compromised figure 3 (A, C, and D). The A549 and THP1 lines showed a nominal increase in mitochondrial depolarization with high UBC; the RAW264.7 macrophages showed an inverse dose-dependent alteration to mitochondrial health upon UBC exposure. The data indicated that only three cell lines presented a significant change in ΔΨm, particularly at the highest concentration of UBC. These findings supported that UBC induced significantly adverse dose-dependent increase to mitochondrial mechanisms (more damage to membrane potential) for both A549 human epithelial line and non-adherent THP1 monocytes compared to the control. An unexpected increase in mitochondrial health was seen for the adherent murine RAW264.7 macrophages compared to the control for all concentrations of black carbon. Interestingly, an inverse dose-dependent increase compared to each experimental UBC-treatment was observed for RAW264.7. Literature suggests that some cells are capable of partially recovering from previously depolarized states [77]; the study showed that mitochondrial damage (or depolarization) in neurons could return to a healthy state and appeared to be highly dependent on ion (Na+/Ca2+) channel flux. This particular phenotype substantially minimizes toxicity in culture and intracellular receptors [77]. Mitochondrial health trends showed significant modifications in all cell types except LA4 compared to the control (Figure 3B). Based on this investigation, it was imperative to report that the highest UBC dose significantly distressed subcellular compartments across most of the cells used in this study. The murine macrophages seemed to recuperate or supersede mitochondrial damage after 9 days of nanocarbon insult.
A meticulous analyses of the cell-cycle profiles affected by long-term exposure to UBC help identify additional effects of nanoparticles on cultured cells. Controlled cell proliferation is fundamental for the development and homeostasis of multicellular organisms [78,79]. Therefore, proliferative analyses serve as key indicators of cellular fitness and can assist in the identification of certain proteins and pathways involved in the potential death or survival of cells after exposure to cytotoxic agents [80]. Formerly, it has been shown that UFP such as TiO2, elemental carbon, commercial black carbon, diesel exhaust-PM, and urban dust cause cytoskeletal toxicity in vitro in macrophages, which led to an impaired cell proliferation, and compromised phagocytic activity [81-83]. Additionally, carbon nanomaterials induce cellular cycle arrest in G1 phase, conveying a loss of cell viability through DNA damage/apoptosis in fibroblasts [84]. In the present study, UBC treatments were administered and cell-cycle progression were evaluated through the quantification and concurrent analysis of cellular DNA content via flow cytometry. Overall, these assays demonstrated that UBC inflicted unexpected alterations to cell-cycle profiles after 9 days of treatment across the diverse cells in this study. The RAW264.7 murine macrophage cell line displayed an anti-proliferative effect indicated by an arrest (or increase) in the hyperdiploid S phase shown in figure 4 (A-D), and consequently a decrease in the tetraploid G2/M subpopulation. This confirms that UBC interferes with cellular synthesis. Murine macrophages were the only cell types to display this trend in our studies and potentially supported that the G2/M checkpoint involving Cdk1/Cyclin B within the mammalian cell cycle’s regulatory machinery is affected [85]. In contrast to the phagocytes, the murine LA4 lung cells along with the human A549 lung cells and THP1 monocytes displayed a dose-dependent increment in the sub-G0/G1 apoptotic subpopulation as well as a significant decrease in the diploid G0/G1 phase in both A549 and THP1 cells (SI). An increment of sub-G0/G1 and G0/G1 are indicative of DNA fragmentation and a synthesis inhibitory effect, respectively. The A549, LA4, and THP1 lines showed no change to the S phase at all the UBC concentrations tested. A549 cells showed a significant dose-response decline in the G2/M subpopulation. As expected, when comparing the untreated control cells with Camptothecin-(CPT) treated cells, a positive control for cytotoxicity, significant changes to normal cell-cycle trends were induced across almost all the cell-cycle facets of the cell lines reviewed. Altogether, these results indicated that UBC shifted normal cycle distributions and provoked distinct alterations across each cell type. The most remarkable changes were for the anti-proliferative tendency (an arrest in the S phase) observed for the RAW264.7 macrophages and a dosage-response increment to DNA fragmentation/apoptotic profiles detected across the A549, LA4, and THP1 monocytes (SI, 1-4). This behavior could potentially indicate that the G1/S checkpoint involving Cdk2/Cyclin E of the cell-cycle machinery might be disturbed or the Anaphase-Promoting Complex (APC) at the spindle checkpoint could be targeted [85], a component for future research.
A comprehensive examination assessed the impact on lung-derived immortalized cells after nano-pollutant +microbial challenges based on a 10-day post-exposure model. The innate immune system consists of soluble proteins that bind leukocytes to microbial products migrating through the bloodstream to inflammation sites, where they may ingest and kill particulates [86]. Innate immune responses were measured after UBC “plus” TLR-ligand treatments as a function of ROS, NO2- (a form of RNS), and inflammatory cytokines. The TLR ligands included in this project were: M1 (LPS), M2 (Poly I: C), and M3 (Zymosan or Zymo). The highest UBC concentration (3.0µg/mL) plus three types of microbial proxies (microbe-like groups M1-3) were given to the cells; experiments were conducted on the tenth day post-incubation. A 3.0µg/mL UBC concentration was selected to identify conjoined effects from microbial stimuli upon respiratory cells, as follows: [1] ROS levels (depicted as collective Σ AuC) were higher for continuous UBC +M1-3 treatments; [2] NO2-content was statistically induced for UBC plus the microbe-mimics across most cell types; [3] cytokine production was also significantly increased compared to the untreated control; [4] phagocytic activity showed a significant dose-dependent decline for RAW264.7. UBC +M1-3 presence altered cellular conditions by significantly increasing ROS (carboxy-H2DCF-DA), elevating oxidative stress (NO2-), and causing notable alterations to cytokine production (Th1 vs. Th2). These findings indicated that UBC impaired mammalian cell function, with each species responding differently to individual microbial challenges, subsequently provoking phagocytic decline across RAW264.7. Stress to external cellular environment was detected using the extracellular NO2-marker. A change in nitrite content is relevant when assessing toxicological responses, since it is a stress marker induced by ROS to stimulate nanomaterial-mediated cell death [65,66]. As shown in figure 5, in comparison to the untreated control, epithelial murine LA4 cells and human THP1 monocytes provoked secretion of NO2-after continuous exposure to 3.0µg/mL UBC alone, while epithelial human A549 cells and murine RAW264.7 macrophages did not. To determine whether exposure to UBC could exacerbate or inhibit NO2-by microbial ligands, the UBC-treated cells were additionally challenged with pathogen-associated molecular patterns or PAMPs: M1, M2, or M3. Induction of NO2-by cells following UBC varied with cell lines and across PAMP type. In the presence of M1, M2, or M3, no significant changes were observed for two lines compared to the control. A549 responded to all three microbial stimuli in the presence of UBC, minimally and insignificantly, UBC +microbes did not impede reactivity of the cells to produce nitrite. LA4 responded to LPS (M1) and Poly I: C (M2) in the presence of UBC, giving a significant increase in nitrite levels. This could predict a close interaction between the nanocarbon pollutant and PAMP presence. All three UBC +microbe challenges were significantly lower compared to the UBC-treated group, as portrayed by double daggers for LA4. In the leukocyte profiles, THP1 monocytes responded to all microbial stimulants but to a lesser degree in contrast to the 3.0µg/mL UBC alone; RAW264.7 phagocytes generated a statistical increase in NO2-concentration following all three infections even in the presence of UBC compared to the untreated groups. The LPS (M1) and Zymo (M3) groups for these murine macrophages yielded a statistical induction of the nitrite metabolite compared to the 3.0µg/mL UBC alone, as indicated by double daggers. Thus, the UBC+PAMP co-exposure promoted innate immunity as a function of nitrite production, mainly for the murine-specific immortalized cells and appears to modulate NO2-responses to TLR-2, 3, and 4 across individual cell types. NO2-is known to control either the replication or elimination of intracellular microbial pathogens [87,88]. Although primarily generated by macrophages to kill bacteria and parasites, nearly every type of cell produces NO2-in the body. Nitric Oxide Synthase (NOS) is a calcium-dependent enzyme that may catalyze the release of nitric oxide in the pulmonary airway and induce pro-inflammatory cytokines [89]; pro-oxidants amplify inflammatory responses by provoking cellular dysfunction under this state termed “nitrosative stress” agent [90]. An exposure to a nanosized pollutant and subsequent infection with a pathogen-like proxy could endanger and impair antimicrobial defenses as observed in vivo [91], due to a decreased expression of nitric oxide and phagocytic activity in alveolar macrophages. Cumulative and additive insults of UBC +microbes prompt extracellular stress together, yet human-derived cells could be capable of adjusting to increasing levels of UBC. The lack of significant NO2-metabolite in the A549 and THP1 cells might hint that an anti-oxidative effect occurred likely due to continuous aggregation of the pollutant [91]. A study suggesting arginine bioavailability (a marker of NO synthetic capacity) also associated with markers of inflammation [92]. The production of NO may activate/amplify inflammatory circuits by modifying protein structure and gene expression; this could in turn deplete arginine and arginase causing parasite death, for example [93]. Recently, research showed that the diffusion of NO induced an effective parasite killing ability from bystander cells and NO-producing cells alike [93]. NO and consequently NOS may not be targeted by the human cells, yet the murine cells (LA4 and THP1) seem to be under greater stress in the presence of UBC +microbial stimuli. Every cell type was able to produce nitric oxide following cumulative nanocarbon and microbial exposures, suggesting the cells are not inhibited by UBC in their capacity to signal an innate immune response.
ROS can elicit extreme biological damage by modifying DNA, proteins, and lipids. Nonetheless, ROS also play beneficial roles including involvement in innate immunity. The classic example of this antimicrobial activity is the destruction of microorganisms occurring in phagolysosome structures of innate immune cells when superoxide converts to a potent cytotoxic molecule, hypochlorous acid [94]. To assess whether continuous exposure to UBC could exacerbate or inhibit ROS in response to microbial presence, 3.0µg/mL UBC-treated cells were challenged using TLR ligands. Particularly, intracellular formation of pro-oxidants was evaluated, where a non-fluorescent indicator converted into a green-fluorescent form when intracellular esterases remove an acetate group (ROS activity). Fluorescent products remain intracellular due to negative charges that impede leakage. Figure 6 (A-D) represents ROS formation by the cells 12hr following immediate harvesting of the cells protocol (left panel). The data was analyzed to determine the sum of the areas under the curve or Σ AuC in FU∗min (right panel) to evaluate ROS in cells over a 720min period. The results varied by cell line and gave significant values depending on distinct treatment types. The Σ AuC reached almost 300,000 FU∗min across all cell types. The human pulmonary cells (A549) produced significantly less ROS in response to 3.0µg/mL UBC alone and UBC in combination with LPS (M1 group) compared to the untreated group (Figure 6A); the murine pulmonary cells (LA4) produced significantly more ROS when treated with UBC +Zymo (M3 group) relative to the untreated control (Figure 6B); no significant differences to ROS production by human monocytes (THP1) compared to media-only group were found (Figure 6C). The most noticeable ROS response stemmed from the RAW264.7 macrophages, where the 3.0µg/mL UBC-treated group significantly reduced ROS production relative to the media control. The microbial M1 group and M3 (LPS, Zymo) stimulants yielded significant increase in ROS in comparison to the untreated control (Figure 6D). Each cell type was able to generate oxidative species following both UBC and microbial challenges; this assessment found that the exposure did not inhibit cellular activity to signal innate immune function. The data demonstrate that cumulative administrations of the highest UBC concentration over a 9-day period had little effect on oxidant production (THP1) and may help neutralize (A549 and RAW264.7) cell damage relative to the media control. However, when UBC exposure is combined with one type of TLR ligand (LPS, Poly I: C, or Zymo), the generation of oxidative species might be impeded (no effect compared to control) or otherwise increase normally. This behavior might signal against a deleterious defense mechanism from particle-media interactions between the UBC aggregates, microbial stimulants, and the cells [95,96]. Due to black carbon’s adsorptive properties, UBC might act as an antioxidant supplement, whereby the negative impact from oxidative species could be bypassed or even neutralized [97,98]. Black carbon’s physiochemical properties yield energetically favorable, hydrophobic, and non-soluble particle formation (nonpolar interactions); free radicals are interestingly scavenged by nano-aggregate formations [95,96]. This behavior could explain the observed protection against radical species for the UBC +microbe groups in the A549 cells and the THP1 monocytes.
A balance between Th1 and Th2 is crucial for immune control; abnormal responses may lead to a variety of inflammatory conditions, like chronic bronchitis and asthma [99]. Cytokines fulfill biological effects including cell proliferation and death; they have been implicated with inflammatory response, immunological conditions, and in diseases such as cancer [85]. To evaluate the potential pro-inflammatory activity of UBC, the production of IL-1β and TNF-α were assessed by ELISA. As shown in figure 7, the 9-day exposure to continuous UBC did not provoke an innate cytokine response from the A549 or LA4 cells. A statistically significant increase in TNF-α production was induced in THP1 cells by UBC alone, see figure 7. A possible anti-inflammatory response was tested by measuring the production of both IL-4 and TGF-β. As shown in figure 7D, only the RAW264.7 were provoked to secrete IL-4, an anti-inflammatory cytokine, in response to cumulative UBC exposure. Moreover, cytokine production by lung-derived cells was evaluated to discover the effects of UBC in combination with TLR-2, 3, and 4 ligands, see figure 8. A549 produced IL-1β in response to all three PAMPs but did not produce TNF-α (Figure 8A). LA4 produced both IL-1β and TNF-α but only in response to LPS (Figure 8B). THP1 generated IL-1β in response to Poly I: C and Zymo and TNF-α in response to LPS and Poly I: C. No significant effect observed for the TGF-β cytokine (Figure 8C). Lastly, RAW264.7 produced only a TNF-α in response to the LPS and Zymo PAMPs. All microbes induced the generation of IL-4 after M1, M2, and M3 challenges; no effect was observed for the IL-1β cytokine for RAW264.7 (Figure 8D). Cumulative 3.0µg/mL UBC induced a cytokine response by both leukocytes. In addition, all cell types showed high levels of cytokines following UBC treatment +microbial challenges, hinting that they are not modified or inhibited by UBC in their ability to function as innate immune cells. Together, these results portrayed increased pro-inflammatory cytokine production and increased anti-inflammatory cytokine production in RAW264.7 macrophages after the combined exposures to both UBC (long-term) and PAMPs (short-term).
Internalization of foreign materials upon long-term, additive UBC doses was measured in this final study. Although a primary function of monocytes and macrophages, phagocytosis can be performed by non-professional phagocytes, like epithelial cells [100,101]. Therefore, as a final measure of UBC impact on innate immunity, the ability of cells to phagocytize additional material was investigated (Supplemental Information, SI 4). No significant values were calculated for either epithelial lines, although there was a slight increase on phagocytic activity upon increasing UBC treatments for both. THP1 monocytes yielded a minimal downward shift in phagocytic activity. In contrast, the measurements showed the RAW264.7 professional phagocytes significantly diminish in a dose-dependent trend. (Almost a 50% reduction in phagocytic activity occurred relative to the media control.) Thus, the most phagocytic cell line in this analysis exceptionally inhibited ingesting additional foreign material after UBC internalization. Even though our culture techniques were conducted using an adherent macrophage line, specific mechanisms describing UBC engulfment remain unknown. Other work indicates that most NPs may be internalized by macropinocytosis if the particle is about 50nm in size [91]. This uptake occurred concomitant to generation of pro-inflammatory mediators: If an infection compromises this activity, cellular impairment follows and antimicrobial responses prevented. Since phagocytic activity decreased, so could production of extracellular NO. Finally, this dataset proposes that low nanoparticle uptake (phagocytic activity in macrophages) coincides with a senescent phenotype observed previously [69].
In the present investigation, low-dose, prolonged 9-day UBC exposure caused moderate ROS protection by the cells (determined by confocal imaging) and induced oxidative damage according to each metabolite-oxidative stress measurement. Murine LA4 and human (A549 and THP1) cells appeared to be prone to damage from toxicant exposure determined by JC-1, whereas mitochondrial membrane health was not severely compromised in murine RAW264.7 macrophages. Interestingly, the cells used in this study may be adapting to a new hyperpolarized state. In comparison to the untreated control, RAW264.7 also indicated an S phase arrest and significant depletion to G2/M subpopulation as validated by cell-cycle cytometry. Assays observing insult from other ultrafine nanomaterials done in vitro showed that cells could potentially benefit upon elevating ROS levels from baseline ROS (9-15%) to higher ROS content (29-33%); a counter-response was produced within the cells’ machinery that prolongs proliferation and increases cell differentiation [15,46]. Moreover, ROS could impact intracellular signal transduction processes by promoting moderate pro-oxidant species, increasing liferating cell nuclear antigen, and elevating cellular subpopulation within the S phase [46]. Thus, this study is in agreement with a currently atypical phenotype observed only for RAW264.7 phagocytes following a nine-day contamination period [69]. This characteristic discovery is not entirely favorable considering the negative alterations imposed from diminished enzyme activity [69], in response to long-term UBC. The complete toxicant effects provide insight into in vitro impacts after nano-pollutant aggregate formation, where: Damage was moderately high across epithelial cells; minimal low-level oxidative stress was present; damage to mitochondrial membrane (ΔΨm) with increasing UBC was observed in human cells; and non-uniform permutations to individual cell-cycle trends were also reported. UBC-induced damage did not seem to supersede their innate ability to neutralize ROS suggesting a unique aspect concerning maintenance of a steady-state redox across human cell lines. No overt prevention to the innate cytokine response was exhibited in the presence of cumulative 3.0µg/mL UBC and subsequent 24hr compounded TLR ligations (M1, M2, or M3 infections). Further, our studies found that the combined effects originating from UBC and microbe-like exposures did not hinder ROS generation. This work highlighted that native, terminally differentiated tissue cells may not ultimately elicit the same responses due to a modified upwards arginase activation and a lowered pathogen-killing capacity of the cells in question (mainly macrophages). If both ROS and NOx levels increase yet lessen phagocytosis, then the balance between both Th1 and Th2 markers is greatly compromised [91,102,103]. Arginine and by consequence the bio-available level of arginase are both of special interest and further experimentations remain [104-110].
The authors originally postulated that sustained UBC +microbial treatments might incapacitate the cells from distinguishing pathogenic infections as potential dangers and consequently disable stress responses from the combined effects of the aforementioned irritants. However, the compilation of these measurements helped reveal unique perspectives concerning how chronic and extensive exposure to airborne irritants may elicit impairment across various cell lines in a non-monotonic manner. Overall, UBC in combination with microbe-like proxies may not only trigger local inflammatory reactions in vitro but further initiate detrimental complications in lung tissues and consequently systemic extrapulmonary maladies.
ACKNOWLEDGMENT
Authors acknowledge the support and assistance provided by the following investigators at the University of Texas - El Paso: Drs. Robert A. Kirken, Bruce Cushing, Renato J. Aguilera, Giulio Francia, and Manuel Miranda-Arango. MES thanks Sharavana Gurunathan for his contribution to this manuscript.
DISCLOSURE STATEMENT
No potential conflict of interest was reported by the authors.
FUNDING
The University of Texas at El Paso, Department of Biological Sciences, Border Biomedical Research Center (BBRC 226141297A). The Cytometry, Screening and Imaging Core and the Biomolecule Analysis Core Facilities, and the National Institutes of Health (NIH) - Research Centers for Minority Institutions Pilot Grant No. 5G12MD007592 from NIH-NIMHD-RCMI. In addition, MES thanks support from the University Of Texas- El Paso Graduate School’s Dodson Research Grant and the College of Science’s Environmental Science & Engineering Doctoral Program.
REFERENCES
- TCEQ (2018) Sources of air emissions. Texas Commission on Environmental Quality. Texas, USA.
- EPA (2017) Particulate Matter (PM) pollution. Environmental Protection Agency. Washington, D.C., USA.
- EPA (2019) National Ambient Air Quality Standards (NAAQS). Environmental Protection Agency. Washington, D.C., USA.
- Pacheco-Blandino I, Vanner R, Buzea C (2012) Toxicity of nanoparticles. In Toxicity of building materials. Woodhead Publishing, Cambridge, UK. Pg no: 427-475.
- Terzano C, Di Stefano F, Conti V, Graziani E, Petroianni A (2010) Air pollution ultra fine particles: Toxicity beyond the lung. Eur Rev Med Pharmacol Sci14: 809-821.
- Garza KM, Soto KF, Murr LE (2008) Cytotoxicity and reactive oxygen species generation from aggregated carbon and carbonaceous nanoparticulate materials. Int J Nanomedicine 3: 83-94.
- Murr LE, Garza KM (2009) Natural and anthropogenic environmental nanoparticulates: Their microstructural characterization and respiratory health implications. Atmospheric environment43: 2683-2692.
- Olvera HA, Lopez M, Guerrero V, Garcia H, Li WW (2013) Ultrafine particle levels at an international port of entry between the US and Mexico: Exposure implications for users, workers, and neighbors. J Expo Sci Environ Epidemiol 23: 289-298.
- Raysoni AU, Sarnat JA, Sarnat SE, Garcia JH, Holguin F, et al. (2011) Binational school-based monitoring of traffic-related air pollutants in El Paso, Texas (USA) and Ciudad Juárez, Chihuahua (México). Environ Pollut159: 2476-2486.
- Raysoni, A.U. etal. (2013) Characterization of traffic-related air pollutant metrics at four schools in El Paso, Texas, USA: Implications for exposure assessment and siting schools in urban areas. Atmospheric environment80: 140-151.
- Zora JE, Sarnat SE, Raysoni AU, Johnson BA, Li WW, et al. (2013) Associations between urban air pollution and pediatric asthma control in El Paso, TexasSci Total Environ 448: 56-65.
- Brauer M, Freedman G, Frostad J, van Donkelaar A, Martin RV, et al. (2015) Ambient air pollution exposure estimation for the global burden of disease 2013. Environ Sci Technol50: 79-88.
- Wang K, Zhang T, Dong Q, Nice EC, Huang C, et al. (2013) Redox homeostasis: The linchpin in stem cell self-renewal and differentiation. Cell Death Dis4: 537.
- Stone V, Tuinman M, Vamvakopoulos JE, Shaw J, Brown D, et al. (2000) Increased calcium influx in a monocytic cell line on exposure to ultrafine carbon black. Eur Respir J15: 297-303.
- Chaudhuri I, Fruijtier-Pölloth C, Ngiewih Y, Levy L (2018) Evaluating the evidence on genotoxicity and reproductive toxicity of carbon black: A critical review. Crit Rev Toxicol 48: 143-169.
- de Haar C, Hassing I, Bol M, Bleumink R, Pieters R (2005) Ultrafine carbon black particles cause early airway inflammation and have adjuvant activity in a mouse allergic airway disease model. Toxicol Sci 87: 409-418.
- Horie M, Kato H, Fujita K, Endoh S, Iwahashi H (2011) In vitro evaluation of cellular response induced by manufactured nanoparticles. Chem Res Toxicol 25: 605-619.
- Jackson P1, Hougaard KS, Boisen AM, Jacobsen NR, Jensen KA, et al. (2012) Pulmonary exposure to carbon black by inhalation or instillation in pregnant mice: Effects on liver DNA strand breaks in dams and offspring. Nanotoxicology, 6: 486-500.
- Liu Y, Xu J, Chen D, Sun P, Ma X (2019) The association between air pollution and preterm birth and low birth weight in Guangdong, China. BMC public health19:
- Porter DW, Hubbs AF, Chen BT, McKinney W, Mercer RR, et al. (2012) Acute pulmonary dose-responses to inhaled multi-walled carbon nanotubes. Nanotoxicology 7: 1179-1194.
- Yamashita K, Yoshioka Y, Higashisaka K, Morishita Y, Yoshida T, et al. (2010) Carbon nanotubes elicit DNA damage and inflammatory response relative to their size and shape. Inflammation 33: 276-280.
- Yang M, Flavin K, Kopf I, Radics G, Hearnden CHA, et al. (2013) Functionalization of carbon nanoparticles modulates inflammatory cell recruitment and NLRP3 inflammasome activation. Small9: 4194-4206.
- Zhu Y, et al. (2014) Cellular senescence and the senescent secretory phenotype age-related chronic diseases. Current Opinion in Clinical Nutrition & Metabolic Care17: 324-328.
- Khanna P, Ong C, Bay BH, Baeg GH (2015) Nanotoxicity: An interplay of oxidative stress, inflammation and cell death. Nanomaterials5: 1163-1180.
- Møller P, Danielsen PH, Karottki DG, Jantzen K, Roursgaard M, et al. (2014) Oxidative stress and inflammation generated DNA damage by exposure to air pollution particles. Mutat Res Rev Mutat Res762: 133-166.
- Krzy?anowski M, Kuna-Dibbert B, Schneider J (2005) Health effects of transport-related air pollution. WHO Regional Office Europe, København, Denmark.
- WHO (2019) Health and sustainable development: Air pollution. World Health Organization, Geneva, Switzerland.
- Zhang R, Zhang X, Gao S, Liu R (2019) Assessing the in vitro and in vivo toxicity of ultrafine carbon black to mouse liver. Science of the total environment655: 1334-1341.
- Kyjovska ZO, Jacobsen NR, Saber AT, Bengtson S, Jackson P, et al. (2015) DNA damage following pulmonary exposure by instillation to low doses of carbon black (Printex 90) nanoparticles in mice. Environ Mol Mutagen 56: 41-49.
- Highwood EJ, Kinnersley RP (2006) When smoke gets in our eyes: The multiple impacts of atmospheric black carbon on climate, air quality and health. Environ Int 32: 560-566.
- Gao X, Xu H, Shang J, Yuan L, Zhang Y, et al. (2017) Ozonized carbon black induces mitochondrial dysfunction and DNA damage. Environ Toxicol 32: 944-955.
- Zhang R, Dai Y, Zhang X, Niu Y, Meng T, et al. (2014) Reduced pulmonary function and increased pro-inflammatory cytokines in nanoscale carbon black-exposed workers. Part Fibre Toxicol 11:
- Laeremans M, Dons E, Avila-Palencia L, Carrasco-Turigas G, Orjuela JP, et al. (2018) Short-term effects of physical activity, air pollution and their interaction on the cardiovascular and respiratory system. Environment international117: 82-90.
- Pun VC, Ho KF (2019) Blood pressure and pulmonary health effects of ozone and black carbon exposure in young adult runners. Sci Total Environ 657: 1-6.
- Brook RD, Franklin B, Cascio W, Hong Y, Howard G, et al. (2004) Air pollution and cardiovascular disease: A statement for healthcare professionals from the Expert Panel on Population and Prevention Science of the American Heart Association. Circulation109: 2655-2671.
- Brown DM, Stone V, Findlay P, MacNee W, Donaldson K (2000) Increased inflammation and intracellular calcium caused by ultrafine carbon black is independent of transition metals or other soluble components. Occup Environ Med57: 685-691.
- Medzhitov R (2010) Inflammation 2010: New adventures of an old flame. Cell140: 771-776.
- Canadian Centre for Occupational Health and Safety (2019) How do particulates enter the respiratory system? Canadian Centre for Occupational Health and Safety, Canada.
- Harmsen AG, Muggenburg BA, Snipes MB, Bice DE (1985) The role of macrophages in particle translocation from lungs to lymph nodes. Science230: 1277-1280.
- Pelka K, De Nardo D (2018) Emerging concepts in innate immunity. Methods Mol Biol 1714: 1-18.
- Bourdon JA, Saber AT, Jacobsen NR, Jensen KA, Madsen AM, et al. (2012) Carbon black nanoparticle instillation induces sustained inflammation and genotoxicity in mouse lung and liver. Part Fibre Toxicol 9: 5.
- Landskron G, De la Fuente M, Thuwajit P, Thuwajit C, Hermoso MA (2014) Chronic inflammation and cytokines in the tumor microenvironment. J Immunol Res 2014: 149185.
- Wang D, DuBois RN (2015) Immunosuppression associated with chronic inflammation in the tumor microenvironment. Carcinogenesis36: 1085-1093.
- Duan X, Peng D, Zhang Y, Huang Y, Liu X, et al. (2018) Sub-cytotoxic concentrations of ionic silver promote the proliferation of human keratinocytes by inducing the production of reactive oxygen species. Front Med 12: 289-300.
- Rim KT, Kim SJ, Han JH, Kang, MG, Kim JK, et al. (2011) Effects of carbon black to inflammation and oxidative DNA damages in mouse macrophages. Molecular & cellular toxicology7: 415-423.
- Soto KF, Carrasco A, Powell TG, Garza KM, Murr LE (2005) Comparative in vitro cytotoxicity assessment of some manufactured nanoparticulate materials characterized by transmission electron microscopy. Journal of nanoparticle research 7: 145-169.
- Oberdörster G, Castranova V, Asgharian B, Sayre P (2015) Inhalation exposure to Carbon Nanotubes (CNT) and Carbon Nanofibers (CNF): Methodology and dosimetry. J Toxicol Environ Health B Crit Rev18: 121-212.
- Espinosa V, Rivera A (2016) First line of defense: Innate cell-mediated control of pulmonary aspergillosis. Front Microbiol 7: 272.
- Hiemstra PS, McCray PB, Bals R (2015) The innate immune function of airway epithelial cells in inflammatory lung disease. Eur Respir J 45: 1150-1162.
- Mitchell LA, Gao J, Wal RV, Gigliotti A, Burchiel SW, et al. (2007) Pulmonary and systemic immune response to inhaled multiwalled carbon nanotubes. Toxicol Sci100: 203-214.
- Martin TR, Frevert CW (2005) Innate immunity in the lungs. Proc Am Thorac Soc 2: 403-411.
- Shadel GS, Horvath TL (2015) Mitochondrial ROS signaling in organismal homeostasis. Cell163: 560-569.
- Dan Dunn J, Alvarez LA, Zhang X, Soldati T (2015) Reactive oxygen species and mitochondria: A nexus of cellular homeostasis. Redox Biol 6: 472-485.
- Ursini F, Maiorino M, Forman HJ (2016) Redox homeostasis: The golden mean of healthy living. Redox Biol8: 205-215.
- Zhang W, Yan L, Li M, Zhao R Yang X, et al. (2015) Deciphering the underlying mechanisms of oxidation-state dependent cytotoxicity of graphene oxide on mammalian cells. Toxicology letters237: 61-71.
- Risom L, Møller P, Loft S (2005) Oxidative stress-induced DNA damage by particulate air pollution. Mutat Res592: 119-137.
- Sanchez VC, Jachak A, Hurt RH, Kane AB (2011) Biological interactions of graphene-family nanomaterials: An interdisciplinary review. Chem Res Toxicol25: 15-34.
- Zerbi G, Barbon A, Bengalli R, Lucotti A, Catelani T, et al. (2017) Graphite particles induce ROS formation in cell free systems and human cells. Nanoscale9: 13640-13650.
- Bräuner EV, Forchhammer L, Møller P, Simonsen J, Glasius M, et al. (2007) Exposure to ultrafine particles from ambient air and oxidative stress-induced DNA damage. Environ Health Perspect 115: 1177-1182.
- van der Heijden J, Bosman ES, Reynolds LA, Finlay BB (2015) Direct measurement of oxidative and nitrosative stress dynamics in Salmonella inside macrophages. Proc Natl Acad Sci U S A112: 560-565.
- Slauch JM (2011) How does the oxidative burst of macrophages kill bacteria? Still an open question. Mol Microbiol 80: 580-583.
- Li N, Kim S, Wang M, Froines J, Sioutas C, et al. (2002) Use of a stratified oxidative stress model to study the biological effects of ambient concentrated and diesel exhaust particulate matter. Inhal Toxicol 14: 459-486.
- Gong J, Zhu T, Kipen H, Wang G, Hu M, et al. (2014) Comparisons of ultrafine and fine particles in their associations with biomarkers reflecting physiological pathways. Environ Sci Technol 48: 5264-5273.
- Xin L, Wang J, Wu Y, Guo S, Tong J (2015) Increased oxidative stress and activated heat shock proteins in human cell lines by silver nanoparticles. Hum Exp Toxicol 34: 315-323.
- Halprin KM, Ohkawara A (1967) The measurement of glutathione in human epidermis using glutathione reductase. J invest dermatol48: 149-152.
- Pompella A, Corti A (2015) The changing faces of glutathione, a cellular protagonist. Frontiers in pharmacology6: 98.
- Salinas ME, et al. (2019) Continuous exposure to low doses of Ultrafine Black Carbon (UBC) reduces the vitality of immortalized lung-derived cells and activates senescence. Under revision.
- Kasahara A, Scorrano L (2014) Mitochondria: From cell death executioners to regulators of cell differentiation. Trends Cell Biol 24: 761-770.
- Robles-Escajeda E, Lerma D, Nyakeriga AM, Ross JA, Kirken RA, et al. (2013) Searching in mother nature for anti-cancer activity: Anti-proliferative and pro-apoptotic effect elicited by green barley on leukemia/lymphoma cells. PloS One8: 73508.
- Iglesias-Figueroa BF, Siqueiros-Cendón TS, Gutierrez DA, Aguilera RJ, Espinoza-Sánchez EA, et al. (2019) Recombinant human lactoferrin induces apoptosis, disruption of F-actin structure and cell cycle arrest with selective cytotoxicity on human triple negative breast cancer cells. Apoptosis 24: 562-577.
- Robles-Escajeda E, Das U, Ortega NM, Parra K, Francia G, et al. (2016) A novel curcumin-like dienone induces apoptosis in triple-negative breast cancer cells. Cell Oncol 39: 265-277.
- Villanueva PJ, Martinez A, Baca ST, DeJesus RE, Larragoity M, Contreras L, et al. (2018) Pyronaridine exerts potent cytotoxicity on human breast and hematological cancer cells through induction of apoptosis. PLoS one13: 0206467.
- Zorova LD, Popkov VA, Plotnikov EY, Silachev DN, Pevzner IB, et al. (2018) Mitochondrial membrane potential. Anal Biochem 552: 50-59.
- Santiago-Vázquez Y, Umashankar Das, Armando Varela-Ramirez, Sarah T. Baca, Yoshira Ayala-Marin, et al. (2016) Tumor-selective cytotoxicity of a novel pentadiene analogue on human leukemia/lymphoma cells. Clin Cancer Drugs3: 138-146.
- White RJ, Reynolds IJ (1996) Mitochondrial depolarization in glutamate-stimulated neurons: An early signal specific to excitotoxin exposure. J Neurosci 16: 5688-5697.
- Cecchini MJ, Amiri M, Dick FA (2012) Analysis of cell cycle position in mammalian cells. J Vis Exp
- Matson JP, Cook JG (2017) Cell cycle proliferation decisions: The impact of single cell analyses. FEBS J 284: 362-375.
- Adan A, Kiraz Y, Baran Y (2016) Cell proliferation and cytotoxicity assays. Curr Pharm Biotechnol 17: 1213-1221.
- Bahadar H, Maqbool F, Niaz K, Abdollahi M (2016) Toxicity of nanoparticles and an overview of current experimental models. Iran Biomed J 20: 1-11.
- Möller W, Hofer T, Ziesenis A, Karg E, Heyder J (2002) Ultrafine particles cause cytoskeletal dysfunctions in macrophages. Toxicol Appl Pharmacol 182: 197-207.
- Möller W, Brown DM, Kreyling WG, Stone V (2005) Ultrafine particles cause cytoskeletal dysfunctions in macrophages: Role of intracellular calcium. Part Fibre Toxicol 2: 7.
- Patlolla A, Patlolla B, Tchounwou P (2010) Evaluation of cell viability, DNA damage, and cell death in normal human dermal fibroblast cells induced by functionalized multiwalled carbon nanotube. Mol Cell Biochem 33: 225-232.
- Raven P, Johnson G, Mason K, Losos J, Singer S (2017) Biology. McGraw-Hill, New York, United States.
- Beutler B (2004) Innate immunity: An overview. Mol Immunol 40: 845-859.
- Bogdan C, Röllinghoff M, Diefenbach A (2000) The role of nitric oxide in innate immunity. Immunol Rev 173: 17-26.
- Bogdan C (2015) Nitric oxide synthase in innate and adaptive immunity: An update. Trends Immunol36: 161-178.
- Ricciardolo FL (2003) Multiple roles of nitric oxide in the airways. Thorax58: 175-182.
- Ricciardolo FL, Sterk PJ, Gaston B, Folkerts G (2004) Nitric oxide in health and disease of the respiratory system.Physiol Rev 84: 731-765.
- Arancibia S, Barrientos A, Torrejón J, Escobar A, Beltrán CJ (2016) Copper oxide nanoparticles recruit macrophages and modulate nitric oxide, proinflammatory cytokines and PGE2 production through arginase activation. Nanomedicine (Lond) 11: 1237-1251.
- Bersani FS, Wolkowitz OM, Lindqvist D, Yehuda R, Flory J, et al. (2016) Global arginine bioavailability, a marker of nitric oxide synthetic capacity, is decreased in PTSD and correlated with symptom severity and markers of inflammation. Brain Behav Immun 52: 153-160.
- Predonzani A, Calì B, Agnellini AH, Molon B (2015) Spotlights on immunological effects of reactive nitrogen species: When inflammation says nitric oxide. World J Exp Med 5: 64-76.
- Klebanoff SJ (2005) Myeloperoxidase: Friend and foe. J Leukoc Biol 77: 598-625.
- Galano A (2008) Carbon nanotubes as free-radical scavengers. J Phys Chem C 112: 8922-8927.
- Galano A (2010) Carbon nanotubes: Promising agents against free radicals. Nanoscale2: 373-380.
- Boland S, Hussain S, Baeza-Squiban A (2014) Carbon black and titanium dioxide nanoparticles induce distinct molecular mechanisms of toxicity. Wiley Interdiscip Rev Nanomed Nanobiotechnol 6: 641-652.
- Niranjan R, Thakur AK (2017) The toxicological mechanisms of environmental soot (Black carbon) and carbon black: Focus on Oxidative stress and inflammatory pathways. Front Immunol 8: 763.
- Moldoveanu B, Otmishi P, Jani P, Walker J, Sarmiento X, et al. (2009) Inflammatory mechanisms in the lung. J Inflamm Res 2: 1-11.
- Freeman SA, Grinstein S (2016) Phagocytosis: How macrophages tune their non-professional counterparts. Curr Biol26: 1279-1282.
- Monks J, Rosner D, Geske FJ, Lehman L, Hanson L, et al. (2005) Epithelial cells as phagocytes: Apoptotic epithelial cells are engulfed by mammary alveolar epithelial cells and repress inflammatory mediator release. Cell Death differ 12: 107-114.
- Clark RT, Hope A, Lopez-Fraga M, Schiller N, Lo DD (2009) Bacterial particle endocytosis by epithelial cells is selective and enhanced by tumor necrosis factor receptor ligands. Clin vaccine immunol 16: 397-407.
- Gustafson HH, Holt-Casper D, Grainger DW, Ghandehari H (2015) Nanoparticle uptake: The phagocyte problem. Nano Today 10: 487-510.
- American Academy of Allergy Asthma & Immunology (2019) Allergy statistics. American Academy of Allergy Asthma & Immunology, Milwaukee, USA.
- Beck-Schimmer B, Schimmer RS, Pasch T (2004) The airway compartment: Chambers of secrets. News Physiol Sci 19: 129-132.
- Center for Climate and Energy Solutions (2018) Climate Basics. Center for Climate and Energy Solutions, Virginia, USA.
- Kreyling WG, Semmler M, Erbe F, Mayer P, Takenaka S, et al. (2002) Translocation of ultrafine insoluble iridium particles from lung epithelium to extrapulmonary organs is size dependent but very low. J Toxicol Environ Health A 65: 1513-1530.
- Li N, Sioutas C, Cho A, Schmitz D, Misra C, et al. (2003) Ultrafine particulate pollutants induce oxidative stress and mitochondrial damage. Environ Health Perspect111: 455-460.
- National Center for Health Statistics (US) (2017) Health, United States, 2016: With Chartbook on Long-term Trends in Health. 109. National Center for Health Statistics (US), Maryland, United States.
- Park SK, O’Neill MS, Vokonas PS, Sparrow D, Schwartz J (2004) Effects of air pollution on heart rate variability: The VA normative aging study. Environ Health Perspect 113: 304-309.
SUPPLEMENTARY FILE
Supplemental Information 1
Nanocarbon distorted normal cell-cycle distributions as depicted by cytometry for human A549 cells: A549 epithelial lung cells were seeded on day zero then treated with various concentrations of UBC as stated in Materials and Methods. On day 10, the cells were harvested and their proliferative activity was analyzed. Datasets are one of 3 independent experiments performed in duplicates, n=6. Statistical significance shown by *p ≤ 0.05 in comparison to untreated controls. Bar graphs indicate the four cytometry gates representing the distribution of cells in each phase of the cycle as: (A) sub-G0/G1 or hypodiploid, (B) G0/G1 or diploid, (C) S or hyperdiploid, and (D) G2/M or tetraploid cell subpopulations. Cell frequency was plotted along the y-axis and the groups were labeled on the x-axis. Human-derived epithelial cells are shown. A 1-way Anova conducted for A549 at G2.
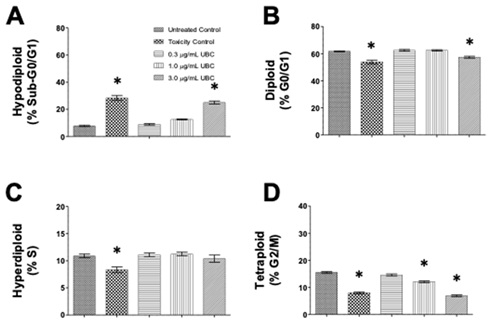
Supplemental Information 2
Nanocarbon altered normal cell-cycle distributions as depicted by cytometry in murine LA4 line: LA4 epithelial lung cells were seeded on day zero then treated with various concentrations of UBC as stated in Materials and Methods. On day 10, the cells were harvested and their proliferative activity was analyzed. Datasets are one of 3 independent experiments performed in duplicates, n=6. Statistical significance shown by *p ≤ 0.05 in comparison to untreated controls. Bar graphs indicate the four cytometry gates representing the distribution of cells in each phase of the cycle as: (A) sub-G0/G1 or hypodiploid, (B) G0/G1 or diploid, (C) S or hyperdiploid, and (D) G2/M or tetraploid cell subpopulations. Frequency was plotted along the y-axis and the groups are labeled on the x-axis. Murine-derived epithelial cells are shown. 1-way Anova conducted for LA4 at G2.

Supplemental Information 3
Nanocarbon affected normal cell-cycle distributions as depicted by cytometry in the human THP1 monocytes: Human monocytes were seeded on day zero then treated with various concentrations of UBC as stated in Materials and Methods. On day 10, the cells were harvested and their proliferative activity was analyzed. Datasets are one of 3 independent experiments performed in duplicates, n=6. Statistical significance shown by *p ≤ 0.05 in comparison to untreated controls. Bar graphs indicate the four cytometry gates representing the distribution of cells in each phase of the cycle as: (A) sub-G0/G1 or hypodiploid, (B) G0/G1 or diploid, (C) S or hyperdiploid, and (D) G2/M or tetraploid cell subpopulations. Frequency plotted along the y-axis and groups labeled on the x-axis. Human peripheral-blood monocytes are shown. 1-way Anova conducted for THP1 at G2.
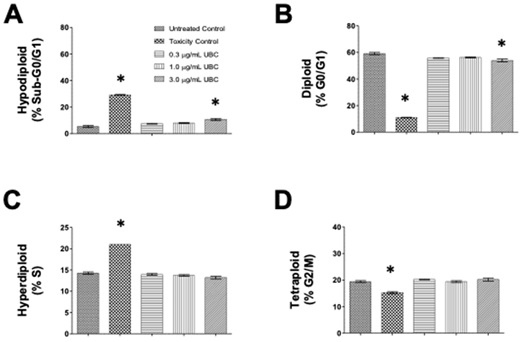
Supplemental Information 4
UBC negatively compromised phagocytic activity in a dose-dependent manner for RAW264.7 phagocytes: Upon day 10, the cells were harvested and assessed for phagocytic activity via the Vybrant fluorescent-based assay. The calculated data is displayed as the mean of 6 replicates. Datasets represent 3 experiments completed individually. Normalized data in reference to untreated group presented in percentage form (%) according to each cell line’s media control. Statistical significance displayed as ∗p ≤ 0.05 in comparison to untreated control. One-way Anova conducted for A549, THP1, and RAW264.7; non-parametric KW for the THP1 monocytes.
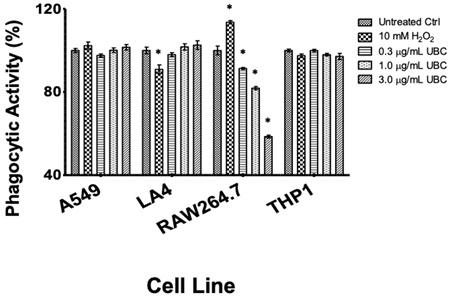
|
Statistical Approach |
||
|
Assay |
1-Way Anova Analysis Parametric Test (normally distributed data) |
Kruskal-Walls Analysis Non-Parametric Test (non-transformed data) |
|
Glutathione level |
A549, LA4, THP1, RAW264.7 |
- |
|
Mitochondrial health |
A549, LA4, RAW264.7 |
THP1 |
|
Cell-cycle profiles (sub-G0) |
LA4 |
A549, THP1, RAW264.7 |
|
Cell-cycle profiles(G0/G1) |
A549, LA4 |
THP1, RAW264.7 |
|
Cell-cycle profiles(S) |
A549, LA4, RAW264.7 |
THP1 |
|
Cell-cycle profiles(G2) |
A549, LA4, THP1, RAW264.7 |
- |
|
ROS reading (AuC) |
THP1, RAW264.7 |
A549, LA4 |
|
NO2 content |
A549, RAW264.7 |
LA4, THP1 |
|
Cytokine producion (IL-1β) |
A549, THP1, RAW264.7 |
LA4 |
|
Cytokine producion (IL-4) |
RAW264.7 |
- |
|
Cytokine producion (TNF-α) |
A549, THP1 |
LA4, RAW264.7 |
|
Cytokine producion (TGF-β) |
- |
THP1 |
|
Phagocytosis |
A549, LA4, RAW264.7 |
THP1 |
Citation: Salinas ME, Gutiérrez DA, Varela-Ramírez A, Villanueva PJ, Garza KM (2019) Prolonged Exposure to Ultrafine Black Carbon (UBC) in Combination with Microbial Proxies Trigger Oxidative, Proliferative, and Innate Immune Perturbations in Pulmonary Lung-Derived Cells. J Toxicol Cur Res 3: 013.
Copyright: © 2019 M Esther Salinas, et al. This is an open-access article distributed under the terms of the Creative Commons Attribution License, which permits unrestricted use, distribution, and reproduction in any medium, provided the original author and source are credited.