Residential Density and Illegal Waste Dumping In Cities
*Corresponding Author(s):
Ruhiiga TMGeography And Environmental Sciences, Mafikeng Campus, North West University, Private Bag X2046, Mmabatho 2735, South Africa
Email:Tabukeli.Ruhiiga@nwu.ac.za
Abstract
Background and Objectives: For developing countries in general and for Sub-Sahara Africa in particular, little is documented in the literature about the location and size of illegal waste dumps in relation to urban residential areas and how this may introduce an alternative explanation for the prevalence of illegal waste dumping using Harare, Zimbabwe as a study area. The objectives were to characterize waste in the context of class, volume, source and distance, to analyse location and waste volume in relation to residential areas and, to generate management lessons for Sub-Sahara Africa.
Methods: Primary data was collected through field observation and measurement was input into multiple linear regression and correlation using the SPSS™ programme. Tests for normal distribution and for multicollinearity were carried on a set of predictor variables on size and location attributes, waste collection service, residential housing density, waste volumes and disposal practices.
Finding: The results indicate a concentration of illegal waste dumps in low-income high density residential districts, an adjusted R2=0.186 and, a 2-tailed p-value at alpha 0.05 of 0.006 and 0.040 which are statistically significant. The a p-value of 0.000 being less than alpha 0.05 shows that the model is a good fit for the data indicating a statistical significance between predictor variables and the size of IWD’s. Given an F-value of 15.305 and a significance at 0.000, it can be concluded that the predictor variables deployed in the study can reliably predict the response of Y1.
Conclusion: The novelty of the study is in developing an alternative explanation for the apparent contradiction between low income districts and high volumes of waste dumping. Implications of the finds are discussed with reference to urban planning in Sub-Sahara Africa.
Keywords
Environmental health awareness; Formal waste sites; Households; Illegal waste dumping; Multiple regression; Residential density
Abbreviations
ANOVA Analysis of Variance
Bi (1, 2, 3....k) Regression coefficients
Eq Equation
FWS Formal waste site
HCC Harare City Council
H0 Null hypothesis
Ha Alternative hypothesis
IWD Illegal waste dump
K Number of explanatory variables in the model
Max Maximum
MLR Multiple linear regression
Min Minimum
MSW Municipal solid waste
N Sample size
P-p Probability plot
P-value Probability value
Ra Range
SPSS Statistical Package for the Social Sciences
SSA Sub-Sahara Africa
STD Standard deviation
Introduction
Chief among urban problems is the management of urban solid waste [1]. in accordance with existing environmental health regulations. Like many other cities in Sub-Sahara Africa (SSA), Harare has been conspicuously unable to effectively manage its illegal waste sites-IWD. The severity of solid waste management challenges in Zimbabwe is manifested in the prevalent accumulation of garbage in public places, on streets and in back alleys in many residential, industrial and commercial areas [2]. The rapid urban growth since the early 1980’s has not been matched with an expansion of urban infrastructure like waste management facilities: public bins, landfills, specialised vehicles for waste transportation and provision of bulk skip bins.
Harare City Council, (HCC) is responsible for the administration and management of the city. Today, it is the economic hub of the country, providing head offices of major corporations and the administrative seat of government. While formal waste sites- FWS- are planned, strategically located for accessibility, adhere to national waste management guidelines and are regularly serviced, illegal waste dumps-hereafter abbreviated to IWD- do not share similar characteristics. The prevalence of IWD is a product of a multiplicity of drivers; the inability of local authorities (municipalities) to effectively collect waste on time [3]. The high cost of legal disposal [4]. Lack of regulations and or poor enforcement, political bickering and opposition politics (Newsday, 2021) and lack of technical and financial capacity [3]. problems of environmental education and urban governance. .A significant volume of studies specifically deal with the dumping of e-waste locally and overseas transfers. Much of the research effort on urban waste management has focused on FWS and municipal landfills, partly because of the availability of information, the ease with which they can be mapped, management practices that are aimed at meeting national waste guidelines and their location in high priority areas. Three approaches are dominant in research on waste management: the technical approach where the emphasis is on biochemical analyses of waste, energy from waste and the application of treatment technologies. [5]. The second approach places emphasis on the socio-economic dimensions of the problem built around household responses, community awareness, municipal governance and public health implications [6-8]. The third approach deals with the application of various scientific methods in dealing with urban waste there is extensive literature along these dimensions for most countries in Africa, Middle East, South East Asia and Latin America.
Given that IWD’s provide a different set of technical and managerial constraints from FWS, the specific research problem is that for developing countries in general and for Sub-Sahara Africa in particular, little is documented in the literature about the location and size of IWD’s in relation to urban residential areas and how this may introduce an alternative dimension in explaining the prevalence of illegal waste dumping. This paper intends to tackle this identified knowledge gap. An understanding of relative location should provide important insights and inputs into the design of appropriate management interventions. The main aim of the study was therefore to analyse IWD’s in terms of size and location attributes and how these relate to residential housing density in an urban setting. Several objectives were advanced to address this research problem: (i) characterize waste in the context of class, volume, source and distance, (ii) analyse location and waste volume in relation to residential areas and, (iii) generate management lessons for SSA. The second part of the paper deals with methods followed by results and analysis in part three while concluding remarks appear in part four.
Materials And Methods
A quantitative, non-experimental, research design applies predominantly based on parametric data sets with values measured on the interval and ratio scales, obtained through field observation and existing official statistics of Harare, at 17049'29.4888" South and 3103'10.9008" East. Recent statistics from the UNO projections show that Harare grew at a low rate of 0.59% in 2019 registering a total population of 1.53 million people. The particular area of study interest is the south and south west made up of predominantly African townships: Mb are, Waterfall, Glenview, Highlands, Budiriro, Dzivarasekwa, Warren Park, Kuwadzana and Mufakose. An initial ground enumeration exercise was carried out to code and validate the existence and location of IWD’s. The total number at the time of the field work in 2016 for this study came to 1289. Each site was recorded in the form of a numeric three-digit code. For sampling purposes, a selection criteria was used: (i) that a waste dump should be close to an existing public road, (ii) it should be illegal and, (iii) it should be on a site where accessibility is not restricted. This generated 498 IWD’s as the population of interest from which a random sample with a level of confidence: 95% and a confidence interval of 4% (Table 1). Using maps of land use and current housing density, a decision was made as to the cut-off point in terms of the number of housing units per residential category. Using aerial photographs of the city at scale 1:10 000, the average number of housing units per residential district was established. Using the means of these values, an upper cut off at 30 (low density), 31-60 (medium density) and 61+ high density) was used to demarcate the region of interest (Table 1).
|
|
A[High] |
B [Medium] |
C [Low) |
|
*Mean housing units per km2 |
[75] |
[54.6] |
3 [23.8] |
|
Housing density classes |
61+ |
31-60 |
Less than 31 |
|
Population meeting selection criteria |
274 |
120 |
104 |
|
Sample size |
188 |
100 |
89 |
|
Sample size distribution |
50% |
26% |
24% |
Table 1: Sample size distribution.

Figure 1: Location of Harare in Zimbabwe.
Source: https://mapcruzin.com/free-zimbabwe-maps.htm
Several predictor variables were identified as of interest in the study: (i) X1- distance from the nearest business outlet, (ii) X2- distance from the geographical centre of the nearest residential block, X3- residential density category, X4-distance of the IWD from the nearest housing unit, X5- distance from the IWD to the nearest road and, X6-mean number of housing units per residential block. All distance variables involved straight line distances in kilometres and sub-units thereof. For, Y1- the size by volume in kilograms of the IWD, the response variable, 4 repeated observations were carried out once a week for a month and a mean score computed for each IWD in the sample. The requisite data on the variables was acquired through the conduct of ground enumeration, observation and measurement backed with the use of land-use maps and aerial photographs. For the response variable, Y1, The alternative hypothesis, Ha stated that that variations in the size of IWD could be explained by housing density (X6). The corresponding null hypothesis, H0 advances the view that there is no statistical significance between the variables. Structured interview was then developed to solicit information from officials of HCC responsible for waste management.
Analysis involved the input of a set of primary data from field observations supplemented with official statistics from HCC and validation through informal face-to-face consultations with waste managers This study uses a multiple linear regression (MLR) model to assess the linkages between the size and location of IWD’s relative to the proximity of business outlets, residential density, housing units, road network and, the geographical center of each residential block. The linear function is shown in Eq. 1.
Y= β0+ β1X1+ β2X2+ ...βkXk+ εEq................................................................. (1)
Where, Y is the response variable, Xi (1, 2, 3 ... k) are explanatory variables, βi (1, 2, 3 ... k) are regression coefficients and is the residual error. In the current case, 1, 2,3,4,5, and 6 become inputs as predictor variables while the Y is the response variable represented by Y1.
Results And Discussion
Waste characterisation
Field work observations in residential areas indicate the dominance of three waste classes; paper, plastics and food respectively. The presence of food waste in this class can be explained by the concentration of outlets in the food sector. For industrial areas, the comparative waste streams were paper, plastics, and metal. Note that the high value of agricultural waste is linked to urban and peri-urban agriculture which is widespread amongst the poor. The high-density residential areas also had the least amount of food waste (5.2%), showing a low mean per capita income and constrained consumption. There was a high percentage of wood waste since wood was used mainly as fuel due to power cuts and because most residents could not afford paraffin or generators.
From (Table 2) several characteristics are noted. The mean distance from the IWD to other points of interest in the study area are represented by X1, X2, X3, X4 and, X5. It is noted that the mean size of the IWD’s is at 1128.99Kg and, the one for X6-housing density score 86.08.The rest of the variables score a mean value of less than 2 indicating very limited variability in data distribution. This is also confirmed by the values for range in column 3. The highest standard deviation value of 1523.292 is recorded for Y1 (size of IWD) followed by X6 (housing density). Beyond these, the rest of the variables score low values for standard deviation indicating a clustering of points in the data set. The lowest mean value is recorded for X5 (road) indicating the closeness of IWD’s to existing roads in the area. From Table 3, correlations, it is noted that there are several significant correlations at the 0.001 level; business unit and housing unit, residential density and housing density, housing density and size of IWD, and, residential density and size of IWD. These imbedded linkages will be explained in reference to other results.
|
Descriptive Statistics |
||||||
|
|
N |
*Ra |
Min |
Max |
Mean |
Std. Deviation |
|
X1 Business Outlet |
377 |
2.10 |
.00 |
2.10 |
.5090 |
.43184 |
|
X2 District centre |
377 |
12.00 |
.20 |
12.20 |
1.2659 |
.72010 |
|
X3 Residential density |
378 |
2 |
1 |
3 |
2.23 |
.825 |
|
X4 Housing unit |
377 |
1.900 |
.100 |
2.000 |
.49761 |
.351829 |
|
X5 Road |
377 |
.209 |
.001 |
.210 |
.00650 |
.019448 |
|
X6Housing density |
377 |
90 |
30 |
120 |
86.08 |
36.809 |
|
Y1 Size of IWD |
377 |
10400 |
100 |
10500 |
1128.99 |
1523.292 |
|
Valid N (list wise) |
377 |
|
|
|
|
|
Table 2: Descriptive Statistics.
*Ra=Range
Methods of waste disposal
With reference to the current study area, interview responses show that 21% of waste by volume is set alight at IWD; composting accounted for 18%, waste recovery and resale accounted for 6% while burying waste underground scored 5%. At least 16% of waste was deposited at FWS while open space dumping accounted for 34%. Households in poor neighbourhoods like Jacha in Epsworth and Mbare in the south west report a total break-down in refuse collection services by the HCC. The HCC as recent as 2019 [2] was openly admitting failure to provide requisite services due to budgetary constraints with almost 70% of the waste is openly dumped at road side sites. Overall therefore, the reports on the waste stream are basically based on estimates since there was no evidence of a waste information system on the ground in the study area.
Location and residential districts
The location of individual IWD’s relative to key features of interest is reported in X1, X2, X4, and X5 in Table 1. It is noted that distances from the IWD to the nearest business outlet (X1), to the centre of the residential block (X2), to the nearest road (X5) and to the housing unit (X4) all fall within a narrow range of 0.001 -2.0 kilometres indicating a close proximity between where people live, shop and dump waste. If it is assumed that households nearest to an IWD are most likely dumping at such a site, then distance could be an important driver of illegal dumping behaviour. Given that the dominant high density residential areas also support the urban poor with high levels of unemployment, low per capita income and in general the lowest per capita waste generation, the association of a high density of IWD’s in these area call for rigorous methods of enquiry. The status quo appears to be a contradiction.
Variability in waste volumes
The volume of waste at a site was estimated during observation and recorded in kilograms. It was noted, in Table 3 –correlations- that significant correlation at the 0.01 level were recorded for Y1 (size of IWD) and X3 (residential density) and for Y1 and X6 (housing density) indicating that high density residential areas support more housing units per square unit of area and are associated with on average the largest IWD’s. It is noted that primary data on variable Y1 was generated following repeated weakly measures for one month and the mean computed for each site. Even then, the volume data remains unstable across time and is interpreted with caution. The results were then entered into the SPSS™ programme for multiple correlation and linear regression analysis. The programme outputs appear in (Table 3).
|
Correlations |
||||||||
|
|
X1 |
X2 |
X3 |
X4 |
X5 |
X6 |
Y1 |
|
|
X1 Business Outlet |
Pearson Correlation |
1 |
-.076 |
.083 |
.752** |
-.033 |
.087 |
-.028 |
|
Sig. (2-tailed) |
|
.142 |
.106 |
.000 |
.517 |
.093 |
.587 |
|
|
N |
377 |
377 |
377 |
377 |
377 |
377 |
377 |
|
|
X2 District centre |
Pearson Correlation |
-.076 |
1 |
.069 |
-.090 |
.085 |
.066 |
.063 |
|
Sig. (2-tailed) |
.142 |
|
.179 |
.080 |
.099 |
.199 |
.220 |
|
|
N |
377 |
377 |
377 |
377 |
377 |
377 |
377 |
|
|
X3 Residential density |
Pearson Correlation |
.083 |
.069 |
1 |
.069 |
.065 |
.997** |
.428** |
|
Sig. (2-tailed) |
.106 |
.179 |
|
.183 |
.211 |
.000 |
.000 |
|
|
N |
377 |
377 |
378 |
377 |
377 |
377 |
377 |
|
|
X4 Housing unit |
Pearson Correlation |
.752** |
-.090 |
.069 |
1 |
-.032 |
.072 |
-.041 |
|
Sig. (2-tailed) |
.000 |
.080 |
.183 |
|
.541 |
.161 |
.431 |
|
|
N |
377 |
377 |
377 |
377 |
377 |
377 |
377 |
|
|
X5 Road |
Pearson Correlation |
-.033 |
.085 |
.065 |
-.032 |
1 |
.065 |
.054 |
|
Sig. (2-tailed) |
.517 |
.099 |
.211 |
.541 |
|
.209 |
.292 |
|
|
N |
377 |
377 |
377 |
377 |
377 |
377 |
377 |
|
|
X6 Housing density |
Pearson Correlation |
.087 |
.066 |
.997** |
.072 |
.065 |
1 |
.419** |
|
Sig. (2-tailed) |
.093 |
.199 |
.000 |
.161 |
.209 |
|
.000 |
|
|
N |
377 |
377 |
377 |
377 |
377 |
377 |
377 |
|
|
Y1 Size of IWD |
Pearson Correlation |
-.028 |
.063 |
.428** |
-.041 |
.054 |
.419** |
1 |
|
Sig. (2-tailed) |
.587 |
.220
|
.000 |
.431 |
.292 |
.000 |
|
|
|
N |
377 |
377 |
377 |
377 |
377 |
377 |
377 |
|
Table 3: Multiple linear regression and correlation.
**. Correlation is significant at the 0.01 level (2-tailed).
|
Variables Entereda |
|||
|
Model |
Variables Entered |
Variables Removed |
Method |
|
1 |
X6Housing density, X5 Road, X4 Housing unit, X2 District centre, X1 Business Outlet, X3 Residential density |
. |
Enter |
|
a. Dependent Variable: Y1 Size of IWD |
|||
|
b. All requested variables entered. |
|||
|
Model Summary |
|||||||||
|
Model |
R |
R Square |
Adjusted R Square |
Std. Error of the Estimate |
Change Statistics |
||||
|
R Square Change |
F Change |
df1 |
df2 |
Sig. F Change |
|||||
|
1 |
.446a |
.199 |
.186 |
1374.474 |
.199 |
15.305 |
6 |
370 |
.000 |
|
a. Predictors: (Constant), X6Housing density, X5 Road, X4 Housing unit, X2 District centre, X1 Business Outlet, X3 Residential density b. Dependent Variable: Y1 Size of IWD |
|||||||||
|
ANOVAa |
||||||
|
Model |
Sum of Squares |
Df |
Mean Square |
F |
Sig. |
|
|
1 |
Regression |
173480914.912 |
6 |
28913485.819 |
15.305 |
.000b |
|
Residual |
698996102.064 |
370 |
1889178.654 |
|
|
|
|
Total |
872477016.976 |
376 |
|
|
|
|
a. Dependent Variable: Y1 Size of IWD
b.Predictors: (Constant), X6Housing density, X5 Road, X4 Housing unit, X2 District centre, X1 Business Outlet, X3 Residential density
Parameter Estimates
|
Coefficientsa |
||||||||
|
Model |
Unstandardized Coefficients |
Standardized Coefficients |
T |
Sig. |
95.0% Confidence Interval for B |
|||
|
B |
Std. Error |
Beta |
Lower Bound |
Upper Bound |
||||
|
1 |
(Constant) |
1261.249 |
420.315 |
|
-3.001 |
.003 |
-2087.755 |
-434.743 |
|
X1 Business Outlet |
-78.647 |
249.495 |
-.022 |
-.315 |
.753 |
-569.254 |
411.960 |
|
|
X2 District centre |
46.597 |
99.497 |
.022 |
.468 |
.640 |
-149.053 |
242.247 |
|
|
X3 Residential density |
3169.558 |
1155.981 |
1.716 |
2.742 |
.006 |
896.442 |
5442.675 |
|
|
|
X4 Housing unit |
-198.948 |
306.263 |
-.046 |
-.650 |
.516 |
-801.182 |
403.285 |
|
X5 Road |
1806.020 |
3666.651 |
.023 |
.493 |
.623 |
-5404.070 |
9016.109 |
|
|
|
X6Housing density |
-53.380 |
25.908 |
-1.290 |
-2.060 |
.040 |
-104.325 |
-2.434 |
|
a. Dependent Variable: Y1 Size of IWD |
||||||||
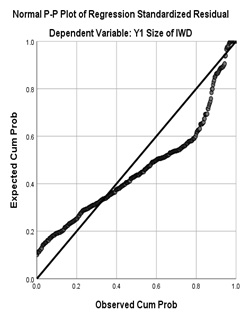 Figure 2: Normal p-p plot.
The model summary indicates an R=.446 which is neither low nor high at it comes close the midpoint or 0-1.The Adjusted R square value of .186 indicates the portion of the variation in Y1 that is explained by the combined effect of predictor variables. This translates to 18.6% of variance showing that the role of other variables outside of those investigated account for 81.4% of variance. Overall, with a p-value of 0.000 being less than alpha 0.05, the model is a good fit for the data showing a statistical significance between predictor variables and the size of IWD’s.
The ANOVA output gives the apportionment of effect between regression, residual and total. The residual accounts for that portion of variance that is not accounted for by regression variables. Given an F-value of 15.305 and a significance at 0.000, it can be concluded that the predictor variables deployed in the study can reliably predict the response of Y1 because 0.000 is less than 0.05. From the coefficients output, the regression model is of the form:
Size Predicted=-1261.249(constant) +-78.647(x1) +46.597(x2) +3169.558(x3) +-198.948(x4) +1806.020(x5) +-53.380(x6) Eq..................................................................................... (2)
Using the parameter estimates, the t-and sign columns are used to provide in a 2-tailed p-value test for the null hypothesis that the parameter is 0. The output indicates that only two parameters, X3 (residential density)at a significance level of 0.006 and X6 (housing density)at 0.040 are statistically significantly different from 0 because both are less than the alpha level 0.05 The null hypothesis can therefore only be rejected for these two parameters. For the remaining four parameters, X1, X2, X4 and X5, the null hypothesis cannot be rejected. Recall that in this study, it was hypothesized that the size of the IWD depends on housing density; the results from parameter estimates do confirm this. The normal probability plot at the end of print-out indicates a linear array of points along the mean confirming normal distribution in the original.
Discussion
The key findings of this study are discussed in the context of the first two objectives. For objective three, the implications of the findings are then used to generate responses aimed at addressing the issue of lessons. The characterisation of IWD’s in the context of class, volume, source and distance, the location pattern shows an overwhelming peak in in low income but high density residential districts to the south and east of the city. But explanations for such behaviour have tended to emphasize lack of waste facilities [3, 9,10]. Harare, unlike many other cities in developing countries, does not support a major proportion of its people in squatter settlements. Instead, these are residential areas which were planned as far back as the 1890’s but which were not provided adequate bulk services to adapt to the needs of urban residents. Planning did not include the requisite infrastructure for waste management, for water and for sanitation in the process raising doubts about sustainability issues [6, 8]. This has been made worse in recent years by a complete collapse of waste collection services in the poorer parts of the city. Illegal waste dumps develop in those areas that do not receive a regular waste collection service [11, 12] and the mean size reported for IWD’s is a product of accumulation over time rather than an indication of per capita waste generation by households in close proximity. This explanation is supported by an earlier contradiction that was noted from the results in which low income residential areas are not in general associated with high levels of waste generation. Conventional literature on rapid urbanisation in developing countries appear to report results of inappropriate urban planning practices as a major constraint [13]. It is expected that with increasing urbanisation under conditions of constrained urban land access [14] residential densities will tend to increase across much of Africa, south East Asia and Latin America. Where this is matched by a parallel collapse or neglect in the provision of the requisite infrastructure, illegal waste dumping becomes widespread. Similar cases are reported in Lagos [13], in Nairobi [15] and in DRC [16].
What are the implications of these findings for developing countries? It is understandable why widespread dumping occurs predominantly along roads or in open spaces. Convenience and unrestricted access play a major role [17]. But an alternative explanation lies in the fact that most low-income urban residential districts are poorly serviced in terms of waste waste infrastructure and collection [1, 18]. Therefore, IWD’s tend –over time-to grow in size giving the impression that these areas generate high waste volumes. In some Sub-Sahara African cities, no such a service in fact exists. This is in sharp contrast to low density affluent districts across cities in developing countries with regular waste collection services. It can be inferred therefore that city governments may be reluctant to drive enforcement of environmental health regulations in areas where services are either poor or non-existent. In addition to individuals and households, business outlets, institutions, government buildings, markets and factories, the economics of distance, cost, effort and convenience come into play. It was observed for this study, for example, that the southern margins of the major industrial of region Harare also had an unusually large number of IWD’s and the waste stream point to dumping by factories close by. All waste generators are often involved though differences in occurrence, seriousness and duration exist. The required intervention in such cases has to mobilize legal, market and political forces if it is to be effective. Across most developing countries, what exists instead are weak legislative and enforcement regimes that undermine the effectiveness of waste management systems [19] made worse by inadequate budget allocations. In addition, there is a persistent failure to invest in a modern waste information management system. In short, beyond the challenges of illegal waste dumping, urban management in developing countries remain a major challenge [20].
This study has shown problems around the provision of waste infrastructure feeding into the predominance of dumping as a natural response from residential districts in the south west part of Harare city. It has been indicated that urban planning in the early days of Harare did not cater for infrastructure provision for African townships with reference to waste, water and sanitation. Increasing rates of urbanisation have not triggered responses in the direction of better service provision. Across cities in developing countries, a growing mismatch between urban growth rates and service provision is noted [10] - with few exceptions in South East Asia. This raises issues around urban planning practices in developing countries. In general planning, is a long-term exercise that creates the means to shape the future into a predetermined growth trajectory sensitive to growing environmental concerns. What happens in cities of developing countries is that urban growth appear to be at rates that are faster than planning interventions. Planning under these conditions becomes a series of reactive interventions rather than a product of long term strategic allocation of resources for development. Where cities are overwhelmed by unplanned growth under conditions of competition for resources, waste management does not receive the type of budget support required to carry out its mandate [1]. Urban planning should be delivered on an understanding of the socio-economics of urbanisation so that planning responds to projections in growth of population, business, industry and inevitably waste. [21] Found a consistent lack of understanding of the diversity of factors operating at various stages of the waste chain and the linkages necessary to make the system work. Space has to be factored into such urban planning to cater for the future provision of public services and bulk infrastructure. Such planning will then create designated areas for transit stations, temporary storage and landfill sites in a manner that recognises the need for technical and managerial efficiencies [20] in the waste chain. The overall impression is that with few exceptions, developments appear to be permanently out of tune with existing urban plans [22]. But, it is not that urban planning does not exist or has necessarily failed; what has happened in much of Sub-Sahara Africa is ultimately a lack of leadership in urban management that would in fact protect both the residents and the urban environment [23, 24].
Conclusion
This study has presented the results of a survey of illegal waste dumps in Harare, Zimbabwe. The key findings centre around the dominance of illegal waste dumping in low-income high density residential districts. The results indicate a concentration of illegal waste dumps in low-income high density residential districts, an adjusted R2=0.186 and, a 2-tailed p-value at alpha 0.05 of 0.006 and 0.040 which are statistically significant. The a p-value of 0.000 being less than alpha 0.05 shows that the model is a good fit for the data indicating a statistical significance between predictor variables and the size of IWD’s. Given an F-value of 15.305 and a significance at 0.000, it can be concluded that the predictor variables deployed in the study can reliably predict the response of Y1. The novelty of the study is in the alternative explanation it advances for the apparent contradiction between low-income households, low mean waste generation per capita and large illegal waste dumps. The state of urban waste collection services for low-income districts remains poorly researched and, constrained financing of waste management across developing countries is one of the multiple drivers that underpin illegal waste dumping across cities. These findings are discussed in the context of the challenges facing urban waste management in the wider Sub-Saharan Africa and on the basis of this, a set of possible interventions are highlighted.
Author Contributions
Mahamba C, performed the literature review, research design and data acquisition. Ruhiiga, TM, analysed and interpreted the data. Mahamba C & Ruhiiga TM prepared the manuscript text, and manuscript edition.
Acknowledgement
The authors do not report any material and or financial support for this study from any organization or institution
Conflict of Interest
The authors declare no potential conflict of interest regarding the publication of this work. In addition, the ethical issues including plagiarism, informed consent, misconduct, data fabrication and, or falsification, double publication and, or submission, and redundancy have been completely witnessed by the authors.
References
- Kaza S, Yao L, Bhada-Tata P, Woerden FW (2018) What a Waste 2.0: A Global Snapshot of Solid Waste Management to 2050. Urban Development Series. Washington, DC: World Bank.
- The Herald (2020) Refuse collection set to improve. Harare: The Herald, 26th January 2020.
- Rotich KH, Yong-Sheng Z, Jun D (2006) Municipal solid waste management challenges in developing countries-Kenyan case study. Waste Management 26: 92-100.
- Sora Yi, Yong-Chul J, Kyoungjin A (2018) Potential for energy recovery and greenhouse gas reduction through waste-to-energy technologies. Journal of Cleaner Production 176: 503-511.
- Mahamba C, Palamuleni LG (2022) International Journal of Environmental Research and Public Health.19: 1-8.
- Ezeah C, Roberts CL (2012) Analysis of barriers and success factors affecting the adoption of sustainable management of municipal solid waste in Nigeria. J Environ Manage 103: 9-14.
- Nyakudya IW, Stroosnijder L (2011) Water management options based on rainfall analysis of rainfed maize (ZEA mays L) production in Rushinga district, Zimbabwe. Agricultural Water Management 98: 1649-1659.
- Couth R, Trois C (2012) Sustainable waste management in Africa through CDM projects. Waste Manag 32: 2115-2225.
- Yang W, Fan B, DeSouza KC (2019) Spatial-temporal effect of household solid waste on illegal dumping. Journal of Cleaner Production 227: 313-324.
- Simatele D, Etambakonga CL (2015) Scavenging for solid waste in Kinshasa: A livelihood strategy for the urban poor in the Democratic Republic of Congo. Habitat International 49: 266-274.
- Ferronato N, Torretta V (2019) Waste mismanagement in developing countries: A review of global issues. International Journal of Environmental Research and Public Health16: 10602.
- Rahim MHIA, Kasim N, Mohamed I, Zainal R, Sarpin N, et al. (2017) Construction waste generation in Malaysia construction industry: Illegal dumping activities. In IOP conference series: Materials Science and Engineering271: 12040.
- Afolayan AS (2020) Repositioning Waste Management Architecture for Sustainable Upstream Performance in Lagos, Nigeria. The Construction Industry in the Fourth Industrial Revolution 215-224.
- Ruhiiga TM (2017) Johannesburg Metropolitan Area. Urban Development in Asia and Africa 371-389.
- Hussen NU, Shimelis G, Ahmed M (2020) Spatial distribution of solid waste dumping sites and associated problems in Chiro town, Oromia regional state, Ethiopia. Environment, Development & Sustainability 23: 389-397.
- Etambakonga LC, Roloff J (2020)Protecting Environment or People? Pitfalls and Merits of Informal Labour in the Congolese Recycling Industry. J Bus Ethics 161: 815-834.
- Tsiko RG, Togarepi S (2012) A situational analysis of waste management in Harare, Journal of American Science 8: 692-706.
- Sotamenou J, De Jaeger S, Rousseau S (2019) Drivers of legal and illegal solid waste disposal in the Global South -The case of households in Yaoundé (Cameroon). Journal of Environmental Management 240: 321-330.
- Kabera T, Wilson DC, Nishimwe H (2019) Benchmarking performance of solid waste management and recycling systems in East Africa: Comparing Kigali Rwanda with other major cities. Waste Management & Research37: 58-72.
- Simatele DM, Dlamini S, (2017) From informality to formality: Perspectives on the challenges of integrating solid waste management into the urban development and planning policy in Johannesburg, South Africa. Habitat International 63: 122-130.
- Tsiko, RG, Togarepi S (2012) A situational analysis of waste management in Harare, Zimbabwe. American Journal of Science 8: 692-706.
- Simatele D, Etambakonga CL (2015) Scavenging for solid waste in Kinshasa: A livelihood strategy for the urban poor in the Democratic Republic of Congo. Habitat International 49: 266-274.
- Sotamenou J, De Jaeger S, Rousseau S (2019) Drivers of legal and illegal solid waste disposal in the Global South - The case of households in Yaoundé (Cameroon). J Environ Manage 240: 321-330.
- Yang W, Fan B, DeSouza KC (2019) Spatial-temporal effect of household solid waste on illegal dumping. Journal of Cleaner Production 227: 313-324.
Citation: Mahamba C, Ruhiiga TM (2022) Residential Density and Illegal Waste Dumping In Cities. J Environ Sci Curr Res 5: 028.
Copyright: © 2022 Mahamba C, et al. This is an open-access article distributed under the terms of the Creative Commons Attribution License, which permits unrestricted use, distribution, and reproduction in any medium, provided the original author and source are credited.