Structural Analysis of the Human Tibia by pQCT
*Corresponding Author(s):
Lionel ThollonIfsttar, Laboratoire De Biomécanique Appliquée Marseille, Aix-Marseille Université, France
Tel:+33 4658012,
Fax:+33 4658019
Email:lionel.thollon@ifsttar.fr
Abstract
Purpose
The general anatomy of the tibia has long been known, but close microscopic and biometric analysis of its structure has only recently been possible. We wished to study this bone because of the numerous injuries observed during the traumatology, car’s injury or the deck-slap effect observing during war surgery.
Materials and methods
In order to better understand the mechanism of these injuries, we aimed to map out the tibia to examine more closely the distribution of cortical bone according to several parameters. We retrospectively studied 67 tibias using a high-definition scanner and compared our results with those of the literature.
Results
In the tibial metaphysis, we observed very high bone density, circularity close to 1, thin cortical bone and the greatest diameters. In the diaphysis, we observed a decrease in periosteal and intramedullary diameters, a marked increase in cortical thickness and a change in tibial architecture together with a marked decrease in circularity. These results were similar to those of the literature.
Discussion
The tibia is subjected to multidirectional forces. It is commonly accepted that each part of the tibia cannot resist all stresses and consequently there is a distribution of resistances in each part of the tibia. The epiphyseal part is subjected to compression forces, whereas the diaphyseal part is more subjected to bending and torsion forces.
Conclusion
Our study revealed a significant difference between men and women (P < 0.001) showing a discriminant effect of sex on cortical thickness, internal diameter and external diameter of the tibia.
Keywords
INTRODUCTION
As early as the 17th century, Galileo Galilei demonstrated a relationship between body weight and bone size [1]. The works of Wolff at the end of the 19th century on the stresses exerted by environmental forces on bone trabeculae introduced the notion of bone adaptation without giving a precise explanation [1]. It was not until the end of the 1970s that Frost postulated that bone adapted to external force through a change in structure, a postulate that he clarified 20 years later in his theory of the “bone mechanostat” [2]. This meant that modeling and remodeling of bone could be induced by the forces to which it was subjected. The external forces exerted on each bone are different. In bending, in torsion and in compression, these forces induce changes in bone structure. The ratios between the mass and the resistance of each bone differ. They depend on the site and on the forces exerted [1]. In order to resist compression forces, highly mineralized bone (pre-eminently cancellous) is developed at the expense of cortical bone. This peripheral cortical bone resists forces of bending and torsion [3]. Frost’s theory is an attractive one to determine some anatomical properties of bone and its adaptation to external forces [2].
Our study sought evidence that bone can adapt to external forces. Vertical stance and bipedal gait cause specific stresses on the long bones. Along the course of human evolution, the tibia has been increasingly subjected to different external forces. Evolution led to adaptation and modification of the structure of this bone. It is commonly accepted that the tibial plateaus, for example, have become thicker because of the increased stresses related to vertical stance. Moreover, the epiphyses of long bones have greater volume than the diaphysis, and their composition of cancellous bone enables them to adapt to compression stresses [2]. Frost postulated that the cancellous bone of the epiphysis and metaphysis allows better dispersal of compression stresses because of its composition and its greater contact surface area [2].
The forces exerted on the tibia commence at the distal epiphysis with the talocrural joint and are then dispersed along the diaphysis, passing proximal to the thigh through the knee. At this joint, these epiphyseal forces are distributed no longer to a single joint surface but to two, thus decreasing the stresses on each joint. Some authors have suggested forces are compressive at the ankle and are bending/torsion forces at the diaphysis [1,3,4]. At the knee, these forces are again compression forces but they are now distributed along two paths [1]. This would confirm the adaptation of tibial bone structure to the external forces acting on it.
In the 1980s, some authors carried out anatomical studies of cadaver tibias in order to corroborate this hypothesis [4]. More recently, thanks to modern non-invasive techniques of investigation such as CT scan, other authors have proposed indicators for better in vivo definition of tibial structure [5]. During the 2000s, the improved power and definition of scanners led to the multiplication of studies on this subject [1,6-12].
We studied a retrospective series of tibias using a high-performance scan device. Our initial intention was to compare our findings with those of the recent literature. We defined study indicators and analyzed them and any relationships between them before comparing our results with those of the literature. The aim was to characterize this bone according to certain parameters.
Our ultimate aim will be to study the forces that are exerted during violent trauma to the tibia. Knowledge of the composition and adaptation of the tibia to normal and shear forces is an indispensable prelude to the study of its behavior under extreme forces.
MATERIALS AND METHODS
A recent high-performance scan device (GE LightSpeed VCT 64-slice, General Electric, Milwaukee Winconsin, USA) was used for image acquisition. It was used in conformity with the manufacturer’s instructions and the cumulative doses of radiation per patient did not exceed 0.9 uSV. The advantage of this scanner was the number, and so the thickness, of each bone slice.
Each tibia was segmented into sections of less than 0.5 mm for more coherence analysis. We examined the sections at every 5% of the total tibial length. For each bone, we took measurements from the section sited at 5% of its total length (designated S5) to the section sited at 95% of its total length (designated S95). The aim was to obtain standardized measurements to enable better analysis and comparison with the literature.
As anatomical indicators, we selected the periosteal or external diameter, and the endocortical or internal diameter of the tibia. Cortical thickness was calculated as the difference between the two diameters. The circularity of each bone section was defined as a ratio between the Anteroposterior (A/P) and Mediolateral (M/L) external diameters. To define the shape of the tibia, we chose to use a diameter ratio, which does not exactly correspond to circularity in the sense of Teague’s publication [13].
Statistical analysis was carried out using R software (R-Development Core Team, 2013) [14]. The Student tests were used to determine the significances of differences in the means. All tests were considered significant at the 5% threshold.
RESULTS
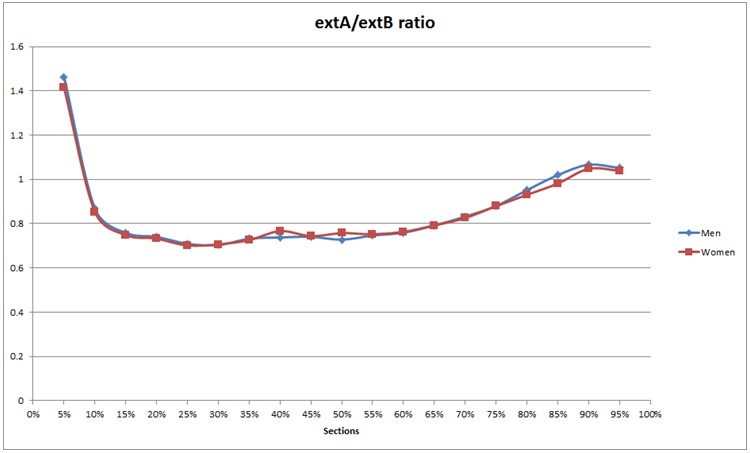
Figure 1: Mixed circularity extA/extB.
Cortical thickness were higher between S5 and S45/S50 and then were lower up to S95 (Figure 2). Maximum values were obtained between S45 and S50. Minimum values were obtained at the metaphysis (S5 to S10 and S80 to S95).
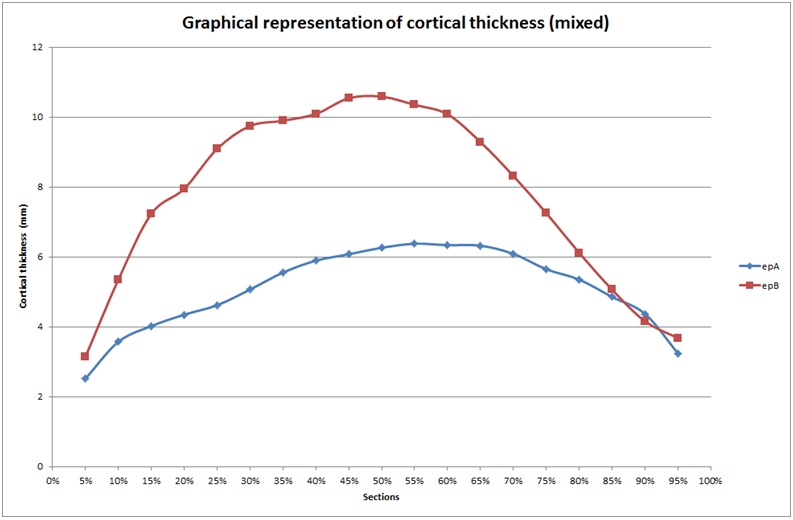
Figure 2: Cortical thickness, mixed, A and B.
Two periosteal (external) tibial diameters were studied: the external mediolateral and external anteroposterior diameters (Figures 3 and 4). Mediolateral diameter were lower from S5 to S60 (minimum) and then again were higher up to S95. The lowest values were obtained in the diaphysis between S30 and S80. Anteroposterior diameter showed different values, with lowest values at S80. The highest values were found in the metaphysis, but we observed a progressive decrease from S10 to S80, then an increase beginning from the metaphyseal area. These values differed from the mediolateral values as they decreased between S10 and S80, and did not follow a curvilinear path.
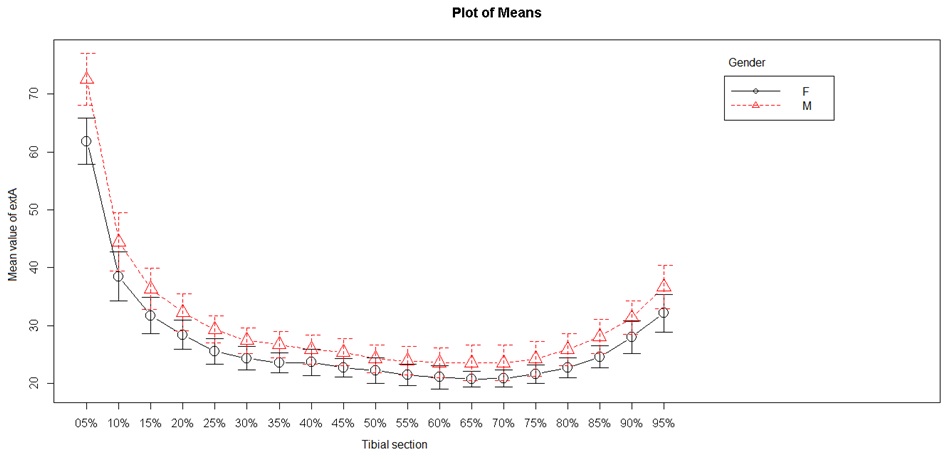
Figure 3: External tibial mediolateral diameter.
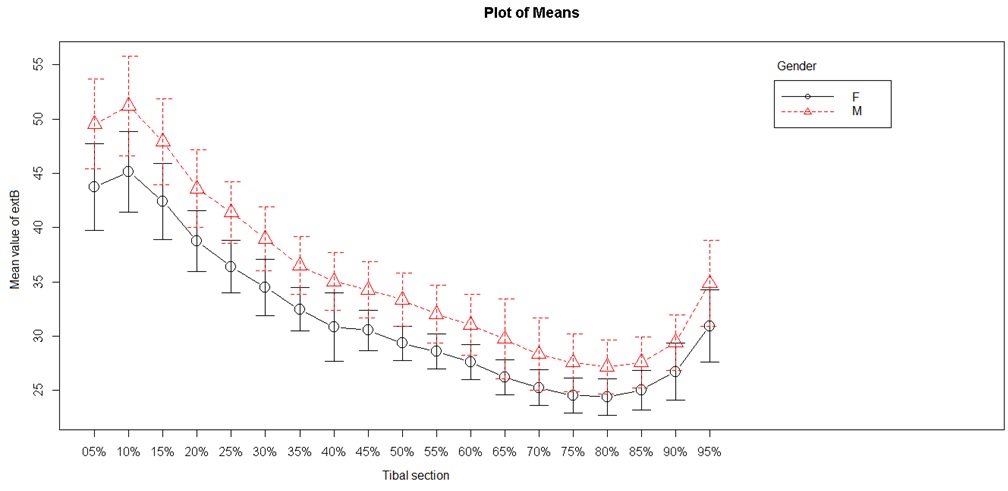
Figure 4: External tibial anteroposterior diameter.
Two endocortical (internal) diameters were studied: the internal anteroposterior diameter and the internal mediolateral diameter (Figures 5 and 6). The internal mediolateral diameter were lower from S5 to S50, and then again higher from S70 to S95. The lowest values were obtained between S45 and S75, corresponding to the tibial diaphysis. The internal anteroposterior diameter had a shape and values close to those of the mediolateral diameter. The lowest values were obtained between S50 and S65 (tibial diaphysis) and the highest values were always in the metaphyseal area.
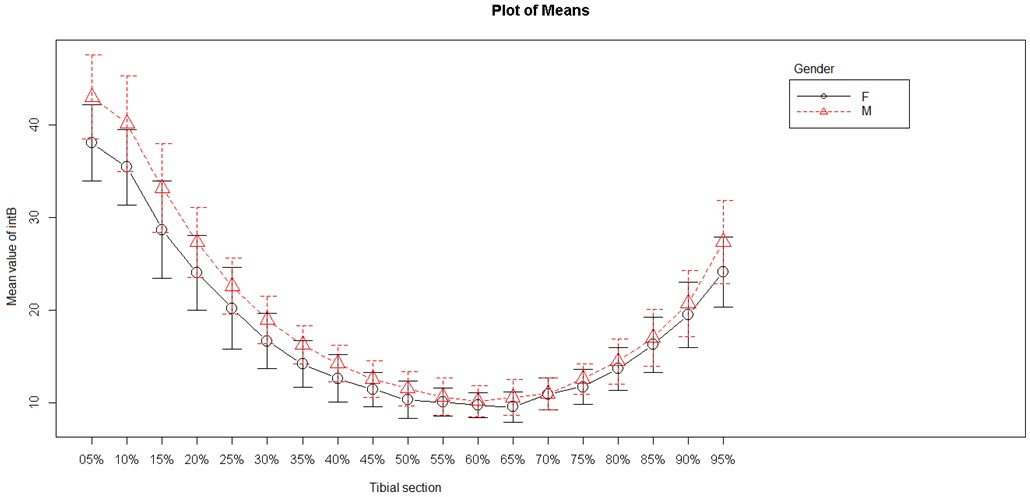
Figure 5: Internal anteroposterior diameter.
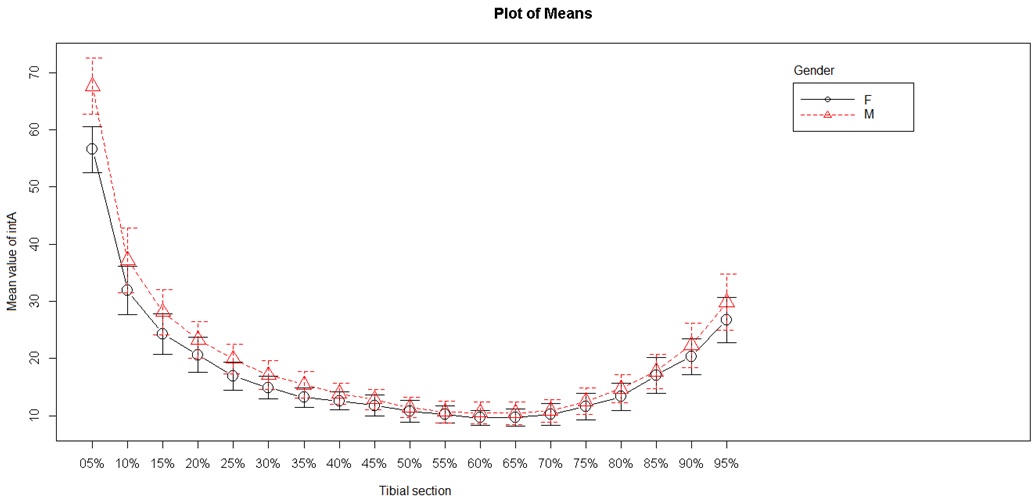
Figure 6: Internal mediolateral diameter.
Analysis of sex as a discriminant factor in cortical thickness, internal diameter and external diameter showed a significant difference between men and women (P < 0.001).
DISCUSSION
The tibia has to bear the weight of the body and is subjected to multidirectional forces (anteroposterior compression, torsion and bending, and mediolateral bending). The tibia consists of several parts (epiphyses-metaphyses-diaphysis) and each must bear a series of forces. It is commonly accepted that each part of the tibia cannot resist all forces, and so resistance is distributed differently in each part [1]. The epiphyseal and metaphyseal part (corresponding to S5-S15 and S80-S95) is subjected to compression forces. The diaphyseal part (corresponding to S20 to S75) is more subject to anteroposterior bending forces and mediolateral torsion forces. The structure and resistance of these parts of the tibia are designed to bear the forces exerted.
Our overall results were similar to those of the literature [1,6-12]. At the metaphysis, between S5 and S15/S20, the tibia has low resistance values to torsion and bending forces [1,3,12,15-20]. Cappoza et al., showed at the S15 site the diaphyseal design and the values [1]. This reflects adaptation of this distal part of the tibia to compression forces. Some authors found that measurement of cortical density and of the second moment of inertia (Cross-Sectional Moments of Inertia, CSMI) were lowest around S15 [1,12,15,16,21]. The CSMI measures the structural efficacy of a bone section in resisting bending and torsion forces. The higher the CSMI values, the greater the resistance. So, at this level, the tibia presents high bone density, circularity close to 1, low cortical thickness and the greatest diameters. We corroborated these findings.
At the tibial diaphysis, the increase in bone density from S15 to S45 shows progressive adaptation to bending and torsion forces [1,12,15,16,21]. The greater the bending and torsion forces, the lower the circularity and bone density [1-3,5,7,16,17,22-24]. Some authors consider that adaptation is gradual and non-global, with successive adaptation to torsion forces, then to anteroposterior bending and to lateral bending [1]. The leg muscles inserting at this point cause stresses that play a part in modeling the tibia and so in its adaptation [1,21]. In our study, we observed this decrease in the periosteal and internal diameter of the tibia, with a marked increase of cortical thickness related to marked decrease in circularity.
Progressively from S45 onwards, we observed an increase in internal and external diameters and a decrease in thickness. Our study revealed anatomical reorganization of the tibia, with a return to circularity. In parallel, other studies noted an increase in bone density and in CSMI [1,12,15,16,21]. This reflects adaptation of the proximal metaphyseal part of the tibia to compression forces [1]. Some authors consider that these compression forces divide into two paths at the level of the tibial plateau [1].
On the basis of these findings, we can reconsider the hypotheses concerning structural adaptation of tibial bone to its environment [1].
Towards the distal third of the tibia, there seems to be an adaptation to compression forces [1,3,12,15-20]. Below S15, analysis of bone density shows that the bone is mainly cancellous, perfectly adapted to compression forces [12]. Spiral fractures are relatively frequent at this level, rather than compression fractures [7,16,22].
We then observed a change in the composition and bone structure of the tibia. The internal and external diameters decreased, while cortical thickness and bone density increased. A recent Norwegian study has shown that cortical bone was dense and in theory resistant at this level, but that its diameter was relatively small [25,26]. This demonstrates adaptation of the middle third of the tibia to bending and torsion stresses. This is linked to the frequency of compression and torsion fractures at this level [22]. An epidemiological study showed a high fracture rate of the middle third of the tibia in young men (particularly in the age range 20-40 years) who practiced sports (notably skiing), with compression and/or torsion fractures [22]. This Swiss study demonstrated a very different fracture rate in women, with homogeneous distribution between the ages of 20-40 years. However, a biomechanical enigma still remains: what is the reason for the low rate of tibial fractures in the elderly even though this population is exposed to the risk of osteoporosis? [10,13,22].
Above S45, we observed another change in tibial density and bone structure. Cortical thickness decreased, while internal and external diameters increased. This is cancellous bone that is adapted to transmission of compression forces to the knee through the two tibial plateaux [1,27].
Comparing the findings in the male and female populations of our sample, we observed a significant difference (P < 0.001). This is coherent with the literature [1,6-12]. However, the recruiting bias related to our status as a military hospital tends to qualify our results. Men were much more numerous than women in our sample. To obtain reliable results, representative samples of the population both in sex ratio and in age would be needed. We decided to test our results in spite of this bias, in order to compare our results in relation to the literature.
We did not observe the very high cortical density in premenopausal women that has been found in other studies [7,12,15,24]. Estrogen hormones inhibit external growth, whereas androgen hormones have the opposite effect. These androgen hormones, present at higher levels in men, also promote muscle growth. This would explain why bone is markedly more developed in men, as it is subject to greater muscular stresses and to hormonal influences promoting growth [2]. As for the same bone density bones of small size have less resistance to fractures than larger bones, any change in their structure (loss of density due to osteoporosis, for example) may have different consequences [6]. In this event, the fragility of small-sized bones is exacerbated [6].
CONCLUSION
The great advantage of modern imaging techniques is their safety and the possibility of in vivo studies. On the other hand, their use is restricted by their cost. This explains the retrospective nature of our study. The sample population was largely male as our institution is a military hospital.
A prospective multicenter study with a wider population (ideal target population) appears to be the best means of obtaining reliable results. However, although our study was retrospective, it demonstrated the sexual dimorphism of tibial bone structure.
At term, the objective of our work is to enable study of the behavior of the tibia in response to extreme distal compression forces. The deck-slap effect is an issue that raises a problem of management because of the severity of the resulting injuries [28]. Understanding of the adaptation of the tibia to habitual forces during gait is the indispensable prelude to studying how this bone behaves in response to extreme distal compression forces.
REFERENCES
- Capozza RF, Feldman S, Mortarino P, Reina PS, Schiessl H, et al. (2010) Structural analysis of the human tibia by tomographic (pQCT) serial scans. J Anat 216: 470-481.
- Frost HM (1987) The mechanostat: a proposed pathogenic mechanism of osteoporoses and the bone mass effects of mechanical and nonmechanical agents. Bone Miner 2: 73-85.
- Martin RB, Bur DB, Sharkey NA, Fyhrie DP (1998) Skeletal tissue mechanics. Springer-Verlag, New York, USA.
- Piziali RL, Hight TK, Nagel DA (1980) Geometric properties of human leg bones. J Biomech 13: 881-885.
- Ferretti JL (1999) Peripheral quantitative computed tomography for evaluating structural and mechanical properties of small bone. In: An YH, Draughn RA (eds.). Mechanical testing of bone and the bone-implant interface. CRC Press, Boca Raton, Florida, USA.
- Bouxsein ML (2005) Determinants of skeletal fragility. Best Pract Res Clin Rheumatol 19: 897-911.
- Evans RK, Negus C, Antczak AJ, Yanovich R, Israeli E, et al. (2008) Sex differences in parameters of bone strength in new recruits: beyond bone density. Med Sci Sports Exerc 40: 645-653.
- Macdonald HM, Kontulainen SA, Mackelvie-O’Brien KJ, Petit MA, Janssen P, et al. (2005) Maturity- and sex-related changes in tibial bone geometry, strength and bone-muscle strength indices during growth: a 20-month pQCT study. Bone 36: 1003-1011.
- Riggs BL, Melton Iii LJ 3rd, Robb RA, Camp JJ, Atkinson EJ, et al. (2004) Population-based study of age and sex differences in bone volumetric density, size, geometry, and structure at different skeletal sites. J Bone Miner Res 19: 1945-1954.
- Rittweger J, Simunic B, Bilancio G, De Santo NG, Cirillo M, et al. (2009) Bone loss in the lower leg during 35 days of bed rest is predominantly from the cortical compartment. Bone 44: 612-618.
- Sherk VD, Bemben MG, Bemben DA (2010) Comparisons of bone mineral density and bone quality in adult rock climbers, resistance-trained men, and untrained men. J Strength Cond Res 24: 2468-2474.
- Sherk VD, Bemben DA, Bemben MG, Anderson MA (2012) Age and sex differences in tibia morphology in healthy adult Caucasians. Bone 50: 1324-1331.
- Teague MR (1980) Image analysis via the general theory of moments. Journal of the Optical Society of America 70: 920-930.
- Dean CB, Nielsen JD (2007) Generalized linear mixed models: a review and some extensions. Lifetime Data Anal 13: 497-512.
- Capozza RF, Cointry GR, Cure-Ramírez P, Ferretti JL, Cure-Cure C (2004) A DXA study of muscle-bone relationships in the whole body and limbs of 2512 normal men and pre- and post-menopausal women. Bone 35: 283-295.
- Currey JD (2003) How well are bones designed to resist fracture? J Bone Miner Res 18: 591-598.
- Dellanini L, Hawkins D, Martin RB, Stover S (2003) An investigation of the interactions between lower-limb bone morphology, limb inertial properties and limb dynamics. J Biomech 36: 913-919.
- Swartz SM, Bennett MB, Carrier DR (1992) Wing bone stresses in free flying bats and the evolution of skeletal design for flight. Nature 359: 726-729.
- Turner CH (1991) Homeostatic control of bone structure: an application of feedback theory. Bone 12: 203-217.
- Wainwright SA, Biggs WD, Currey JD (1976) Mechanical design in organisms. Edward Arnold, London, UK.
- Wehner T, Claes L, Simon U (2009) Internal loads in the human tibia during gait. Clin Biomech (Bristol, Avon) 24: 299-302.
- Grütter R, Cordey J, Bühler M, Johner R, Regazzoni P (2000) The epidemiology of diaphyseal fractures of the tibia. Injury 31: 64-67.
- Grütter R, Cordey J, Wahl D, Koller B, Regazzoni P (2000) A biomechanical enigma: why are tibial fractures not more frequent in the elderly? Injury 31: 72-77.
- Järvinen TL, Kannus P, Sievänen H (2003) Estrogen and bone--a reproductive and locomotive perspective. J Bone Miner Res 18: 1921-1931.
- Bjørnerem Å, Bui QM, Ghasem-Zadeh A, Hopper JL, Zebaze R, et al. (2013) Fracture risk and height: an association partly accounted for by cortical porosity of relatively thinner cortices. J Bone Miner Res 28: 2017-2026.
- Zebaze RM, Ghasem-Zadeh A, Bohte A, Iuliano-Burns S, Mirams M, et al. (2010) Intracortical remodelling and porosity in the distal radius and post-mortem femurs of women: a cross-sectional study. Lancet 375: 1729-1736.
- Rittweger J (2007) Physiological targets of artificial gravity: adaptative processes in bone. In: Clement G, Bukley A (eds.). Artificial gravity. Springer, New York, USA. Pg no: 191-231.
- McKay BJ, Bir CA (2009) Lower extremity injury criteria for evaluating military vehicle occupant injury in underbelly blast events. Stapp Car Crash J 53: 229-249.
Citation: Breda R, Godio-Raboutet Y, Mavrori E, Thollon L (2016) Structural Analysis of the Human Tibia by pQCT. J Orthop Res Physiother 2: 021.
Copyright: © 2016 Renaud Breda, et al. This is an open-access article distributed under the terms of the Creative Commons Attribution License, which permits unrestricted use, distribution, and reproduction in any medium, provided the original author and source are credited.