Study of Physico-Chemical Characteristics of Water and Soil in Relations to Fish Production in Motia Lake Reservoir
*Corresponding Author(s):
Mahender Singh ThakurCentre For Environment Studies, Department Of Biosciences, Himachal Pradesh University, Shimla, Himachal Pradesh, India
Tel:+91 177 2830946,
Email:drmahender74@gmail.com
Abstract
Present studies were carried out for physico-chemical parameters of water and soil of Motia Lake Bhopal, Madhya Pradesh, India. The aim of the study was to establish the safety of water and fishes from the Lake. Different physico-chemical parameters such as pH, Electrical Conductivity (EC), Dissolved Oxygen (DO), Total Alkalinity (TA), Total Hardness (TH), Chloride (Cl), Nitrates (NO3), Phosphate (PO4), Turbidity and Total Dissolved Solids (TDS) of lake water were investigated during pre-monsoon, monsoon and post-monsoon period. The soil parameters such as pH, EC, phosphorus, nitrogen, potassium and organic matter were also studied in different sessions. The value of pH, EC, DO, TH, TA, Ca, Mg, Cl, NO3, PO4 were recorded higher during pre-monsoon period in lake water. In soil sample, pH, EC, nitrogen was found higher in post-monsoon during study period. The results on physico-chemical parameters of water and soil clearly indicate highly productive nature of the Motia Lake. The water quality parameters showed maximum values during pre-monsoon compared to rainy and winter seasons. It was inferred from the results of water quality and soil analysis that Motia lake was productive in nature.
Keywords
Motia lake; Physico-chemical characteristics; Soil; Water
INTRODUCTION
In limnological study the consideration of physico-chemical factors contribute in making up of the specific ecosystems, which determined the trophic dynamics of the water body. It is necessary to know the physico-chemical properties of water to study the culture practices of the fish in water bodies. The productivity of a water sheets depends primarily on the physico-chemical and biological characteristics of water. These properties again depend on the nature of bottom soil and climatic conditions. In India first ecological study on a reservoir was carried by Ganapathi on Red hill Lake, Madras [1].
Soil is one of the most important ecological factors containing a large number of different kinds of bacteria, plants and animals that compose inter-related biological complex. As a complex physical and biological system, it provides nutrients and oxygen for the organisms. The major physical and chemical features of soil are related to particle size, distribution, types of clay colloids, cation and anion exchange capacity, oxidation and reduction potential, soil reaction, electrical conductivity and nutrient dynamics. A healthy and judicious reduction condition should be maintained at the bottom to facilitate the optimum availability of nutrients as well as prevention of any unhealthy situation. Thus, soil plays an important role in fertility of fish life and water body.
The physico-chemical parameters of water like temperature, pH, electric conductivity, dissolved oxygen, biological oxygen demand, chemical oxygen demand, total alkalinity, carbonates, bicarbonates, calcium, magnesium, hardness, chlorides, sulphates, nutrients like nitrates and phosphates, turbidity and total dissolved solids are important to know the trophic nature of the water body. Water bodies are generally of three types oligotrophic, mesotrophic and eutrophic. Usually mesotrophic water bodies are highly productive in nature.
In this study a perennial small water reservoir known as Motia lake, which is the most disturbing reservoir is used for different purposes to analyze the effect of change of physico-chemical parameters on fish population distribution and for monitoring of the pollution status of this lake, however somehow lead to the better environmental management of fish production and help to save this water body.
MATERIALS AND METHODS
 Figure 1: Map of India
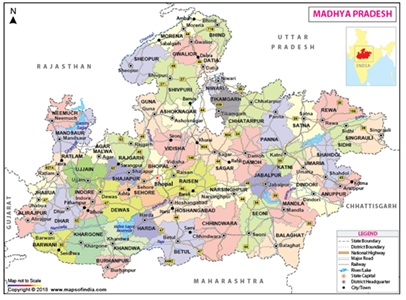 Figure 2: Map of Madhya Pradesh.
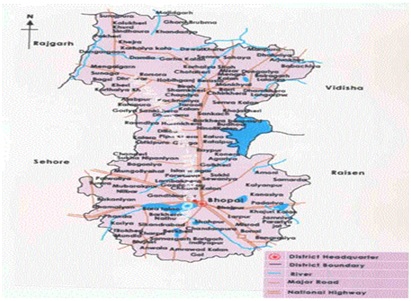 Figure 3: Map of Bhopal city.
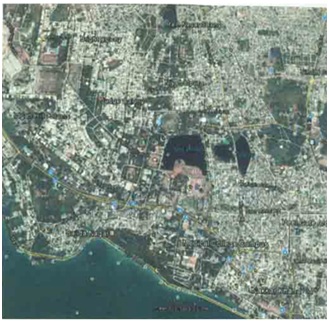 Figure 4: Satellite image of Motia lake.
Sampling Procedure
Hydrogen ion concentration with the help of pH meter; Turbidity at 420 nm by using formazine polymer as turbidity standard for reference and expressed in formazine units; Total Solids (TS) estimated by evaporation of 50 cm3 aliquot at 105°C and desiccation of the revolve to constant weight, finally calculated as mg/cm3; Dissolved Solids (DS) a part of the sample was filtered through Whatman No 1 filter paper and 50 cm3 aliquot of filtrate was evaporated at 105°C and desiccated to constant weight and finally calculated as ppm; Dissolved Oxygen (DO) was fixed in the field by winklerization and analyzed by titrimetry and finally expressed as mg/cm3 at ambient temperature; Carbonates and bicarbonates were estimated in 50 cm3 aliquot by acidimetry using phenolphthalein and methyl orange as indicators; Nitrate nitrogen estimated by phenol disulphonic acid method; Calcium determined by EDTA titration method using murexide as indicator; Magnesium measured by EDTA titration method using eriochrome/solochrome black as an indicator; Phosphates measured by EDTA titration method and dissolved chloride content was estimated by argentimetry using potassium chromate as an indicator [2,3].
All the physico-chemical analysis were completed within 48 hours after the collection of the samples and all stipulated precautions were followed during the collection, storage, handling and processing so that the precision and accuracy were within the ranges prescribed by Apha, Golterman and Neeri [2,4,5].
RESULTS AND DISCUSSION
Physico-Chemical parameters of water
Hydrogen ion concentration (pH)
The pH of water has significant role in survival of aquatic biota. The pH ranged from 7.8 to 8.4 and 8.0 to 8.5 during 2011-2012 and 2012-2013, respectively in the reservoir were observed. Post-monsoon season showed high pH. The mean pH recorded was 8.3 and 8.2 during 2011-2012 and 2012-2013, respectively (Table 1).
|
S No |
Season Year |
pH |
EC |
DO (mg/cm3) |
TA (mg/cm3) |
TH (mg/cm3) |
TDS (mg/cm3) |
|
1 |
Pre- monsoon |
8.4±0.3 |
1470±119 |
6.22±0.6 |
158±80 |
288±88 |
590±7.4 |
|
2 |
Monsoon |
7.8±0.4 |
1180±110 |
6.01±0.4 |
90±7 |
198±86 |
860±7.2 |
|
3 |
Post- monsoon |
8.1±0.5 |
1290±119 |
5.85±0.6 |
114±80 |
213±87 |
650±7.4 |
|
|
Mean |
8.83 |
1313 |
5.92 |
114 |
23.3 |
700.0 |
|
|
Season Year |
|
|
|
|
|
|
|
1 |
Pre- monsoon |
8.5±0.5 |
1420±100 |
6.33±0.9 |
158±8 |
281±91 |
598±78 |
|
2 |
Monsoon |
7.9±0.3 |
1240±98 |
6.12±0.7 |
97±8 |
201±84 |
890±75 |
|
3 |
Post- monsoon |
8.2±0.4 |
1380±99 |
5.59±0.5 |
121±8 |
250±90 |
680±76 |
|
|
Mean |
8.2 |
1346.1 |
6.01 |
128.6 |
246 |
23.66 |
|
|
Grand mean |
8.5 |
1329.5 |
5.96 |
121.3 |
239.5 |
22.3 |
EC = Electrical Conductivity
DO = Oxygen
TA = Total Alkalinity
TH = Total Hardness
TDS= Total Dissolved Solid
The functional stability of aquatic ecosystem depends upon the buffering capacity of water. This is reflected from the fluctuation of the hydrogen ion concentration brought about by the operational dynamics of CO2, bicarbonates and carbonates. Most of the fresh water bodies are alkaline due to the above components. The productivity of inland water is good in a slight alkaline reaction with pH between 7.5 to 8.5 [6-9].
The alkaline pH provides the growth to natural food organisms and increases the productivity and fish yield. Similar reports were made by Piska et al., [6,7,9,10]. Malu reported that the higher pH can be attribute to higher primary productivity and attributed to high rate of photosynthetic activity [11]. Das and Nandi observed that pH between 6.5 and 9.0 supports a good fishery [12]. It has direct effect on fish growth as well as on the growth and survival of fish food organisms.
pH is the most important factor in determining the reservoir productivity. The water pH is more or less a reflection of bottom soil. It has been revealed that less than 5 and more than 10 pH was lethal to fish. pH of water undergoes a diurnal change alkaline medium. In slight alkaline pH (7-8 pH) water was observed more suitable for fish life [12].
The conductivity ranged from 1180 µS/cm to 1470 µS/cm and 1240 µS/cm to 1420 µS/cm was recorded during 2011-2012 and 2012-2013 respectively. The maximum conductivity was noticed in pre-monsoon period and minimum was in monsoon period (Table 1). It has been observed that EC between 20 and 1500 μs/cm is suitable for aquaculture .Higher value of EC occurred due to the decomposition of macrophytes, dead animal and evaporation.
The conductivity of water depends on ions present in the water. The conductivity reflects the nutrient status of the water and distribution of macrophytes. Minimum conductivity may be due to dilution of water, caused by monsoon rains and utilization of ions by the living community of the reservoir. Higher values of conductivity was recorded, may be due to decomposition of macrophytes, dead animals present in the reservoir, evaporation and evapo-transpiration of the reservoir. Electrical conductivity has significant positive correlation with free carbon dioxide, bicarbonate, alkalinity, potassium and phosphate and negative correlation with dissolved oxygen carbonate alkalinity and nitrates.
Unni et al., has reported that seasonal variation of conductivity showed maximum (4949 µS/cm) in summer of Tawa reservoir, Madhya Pradesh. The input of nutrient ions through thermal power effluents and its subsequent distribution and dilution resulted in the longitudinal decline of conductivity in the reservoir [13]. Das has studied the limno-chemistry of some important reservoirs of Andhra Pradesh and observed specific conductivity in the range of 316 to 610 µS/cm. The majority of Indian reservoirs have low values of specific conductivity [14].
In the present investigation the highest value of dissolved oxygen was recorded in the premonsoon months (6.22 mg/cm3) during 2011-2012 and in the month of July (6.33 mg/cm3) during 2012-2013 respectively. The average values for the both years were 5.92 and 5.96 mg/cm3, respectively (Table 1), with over all mean of 5.96 ppm.
The lower values of dissolved oxygen in monsoon season and higher values in pre-monsoon were due to the surfacial water of the reservoir during monsoon months, subjected to wind generated turbulence and resultant mixing of surface and surface water layers. Thus, in monsoon months, there establish oxygen equilibrium between the water and air. This is not disturbed by the vertical gradient of phytoplankton’s or bacterial populations.
The pollution stress is increased in water bodies due to the enrichment of nutrients and decline of dissolved oxygen. The presence of pollutants like organic wastes caused rapid depletion of dissolved oxygen. Substances like NH3, nitrates, H2S and oxidisable inorganic substances also decrease the dissolved oxygen in water [15].
Das studied the limino-chemistry of important reservoirs of Andhra Pradesh and stated that dissolved oxygen along with turbidity could provide information about the nature of an ecosystem better than any other chemical parameters [16]. It has been observed that dissolved oxygen concentration more than 5 mg/l favors good growth of flora and fauna. Motia lake being a polluted and highly eutrophic reservoir showed higher dissolved oxygen in pre-monsoon due to algal bloom.
Present study revealed that the concentrations of total alkalinity were observed higher in the pre-monsoon season in 2011-2012 & 2012-2013. The average values of alkalinity were found 114 mg/cm3 in 2011-2012 and 128 ppm in 2012-2013 in the water of present reservoir. Low carbonate concentration was found in monsoon period in all cases. The values of alkalinity concentration of 90 mg/cm3 in 2011-2012 and 97 ppm in 2012-2013 respectively were noted in lake (Table 1). The overall mean concentration was found to be 121.3 mg/cm3 during the study period.
The alkalinity of the water is mainly due to carbonates, bicarbonates and partially hydroxides. Carbonates and bicarbonates along with free CO2 and carbonic acid form four species of inorganic carbon of the fresh water carbonic system. Their interaction with water molecules results in the displacement of H+ and OH-ions and manifestation of a specific pH at which, the relative concentration of H2CO3, HCO3- and CO32-were fixed [6,7,17].
Yelavarthy has studied the hydrobiology of Red Hills reservoir, Tamil Nadu and noticed the total alkalinity in the range from 117.3 to 173.3 mg/cm3 and shows a close correlation with productivity [18]. Rao reported the total alkalinity ranged from 112 to 22 mg/cm3 in Julur [19].
In the present study, the minimum total hardness was recorded in the monsoon (198 mg/cm3 and 201 mg/cm3) during 2011-2012 and 2012-2013. The maximum total hardness was recorded in the pre monsoon (207 mg/cm3 and 281 mg/cm3) during 2011-2012 and 2012-2013, respectively (Table 1).
The total hardness of water is caused by Ca and Mg ions present in water. Hardness could be temporary due to carbonates and bicarbonates or permanent due to sulphates and chlorides. Biologically temporary hardness plays a key role in buffering capacity, thus neutralizing the pH due to addition of acidic products. It has a great effect on biotic diversity of an ecosystem. Maximum values of the calcium and magnesium were found during pre-monsoon months (94 ppm; 101 ppm and 45.9 mg/cm3; 50.3 mg/cm3) during 2011-2012 and 2012-2013, respectively. Lowest values were found during monsoon months (21 mg/cm3; 74 mg/cm3 and 18.1 mg/cm3; 19.2 mg/cm3) during 2011-2012 and 2012-2013, respectively (Tables 1 and 2).
The relative composition and concentration of the Cations in the aquatic ecosystem determines the water quality for different uses. The hardness is due to calcium and magnesium, which are bivalent ions. Calcium and magnesium cycle through biotic and abiotic components of the ecosystem. As a result ambient concentration is under the influence of the photosynthetic precipitation, biotic utilization and tropholyte release. Higher hardness values were recorded during summer. The lower values of calcium were found during winter and magnesium in monsoon months [20]. Swingle has suggested that total hardness of 50 mg/cm3 CaCO3 equivalent was the dividing line between soft and hard water [21]. He reported that the pond water having a hardness of 15 mg/cm3 or above were satisfactory for growth of fish and do not require additional of lime. Similar observations were made by Piska et al., [9].
The chloride content was found high during pre-monsoon months and low during monsoon months. The ranges of chlorides were found to be 228 mg/cm3 to 345 mg/cm3 and 241 mg/cm3 to 371 mg/cm3 during the study period (Table 2).
|
S No |
Season year |
Turbidity (NTU) |
Cl (mg/cm3) |
NO3(mg/cm3) |
PO4(mg/cm3) |
|
1 |
Pre- monsoon |
19±2.5 |
345±6 |
35.8±4 |
8.58±0.4 |
|
2 |
Monsoon |
27±2.3 |
228±41 |
20.3±2 |
5.10±0.2 |
|
3 |
Post- monsoon |
21±2.4 |
310±52 |
27.6±3 |
6.94±0.3 |
|
|
Mean |
23.65 |
294.33 |
27.9 |
686 |
|
|
Season Year |
- |
- |
- |
- |
|
1 |
Pre- monsoon |
21±2.8 |
371±51 |
36.1±7 |
8.27±0.7 |
|
2 |
Monsoon |
26±2.6 |
241±73 |
22.4±5 |
5.00±0.5 |
|
3 |
Post -monsoon |
24±2.7 |
312±62 |
28.4±6 |
6.98±0.6 |
|
|
Mean |
23.66 |
308.0 |
28.9 |
6.75 |
|
|
Grand mean |
22.33 |
3010 |
28.4 |
6.80 |
Cl = Chloride
NO3 = Nitrate
PO4 = Phosphate
Natural water normally has a low chloride content compared to bicarbonates and sulphates. High chlorides indicate pollution from domestic sewage and industrial effluents. Chloride content above 250 mg/cm3 makes water salty [22].
Das has studied the limno-chemistry of Andhra Pradesh reservoirs and reported that Krishna reservoirs showed significantly higher values of chloride content as compared to Godavari and Penna basin reservoirs due to inherent characteristics of its catchment [23].
Pulle and Khan reported that chloride content was found to be 32.2 to 48.7 mg/cm3 in Isapur dam water of Maharashtra and the presence of chloride indicates the availability of organic matter, presumably of animal origin and increased the amount of ammoniacal nitrogen and organic matter [22]. The concentration of chloride increases with the degree of eutrophication. Yelavarthy has reported the low chloride levels of Red Hills reservoir, Tamil Nadu [18]. Rao reported high values of chlorides in Safilguda reservoir [24].
Maximum nitrates were found during pre monsoon months in both cases. The highest value of nitrates were (35.8 mg/cm3 and 36.1 mg/cm3) found during 2011-2012 and 2012-2013 respectively (Table 2). The low values of nitrate were found in January (20.3 mg/cm3 and 22.4 mg/cm3) in both the years.
Nitrate nitrogen in water of Indian reservoirs was found mostly in traces and seldom exceeds 0.5 mg/l [23]. Unni et al., and Mohanty reported the nitrogen levels of various reservoirs of India and discussed its impact on productivity [13,25].
Das has studied the concentration of nitrate nitrogen in nine important reservoirs of Krishna, Godavari and Penna river system and reported that in all the reservoirs the concentration of nitrate is rather poor in traces [23]. However, the level of nitrate was improved during post-monsoon months to the extent of 0.56 mg/cm3 (Kadam) to 0.86 ppm (Nagarjuna Sagar). The major reservoirs have very low concentration of nitrogen and phosphorous (0.56 ppm) [26]. The highly productive reservoir with nitrate range of 0.75 to 1.65 mg/cm3 was noticed.
The values of phosphate were ranged from 5.10 ppm to 8.58 ppm during 2011-2012 and 5.00 mg/cm3 to 8.27 mg/cm3 during 2012-2013 (Table 2). High values of phosphates during pre monsoon were due to reduced water level.
During monsoon period high values of phosphate were recorded. It was contributed by the surface run off and mixing with the influent water of the reservoir. Piska in Ibrahimbagh and Shathamraj reservoirs of Ranga Reddy district were also reported similar results [6,7]. The present study also coincides with the findings of Yound et al., and Piska [10,27]. Rao et al., reported an increase in the phosphates concentration in the waters polluted by sewage [28].
In the present observation the concentration ranges of the phosphates were agreeable with the opinion of Jhingran and Sugunan which were 7.235 ppm and indicate that the reservoir is under highly productive in nature [29]. Ecologically phosphorous is often considered as the most critical single element in the maintenance of aquatic productivity. Large number of lakes and ponds gave the phosphorous fertility range as 0.00-0.02 mg/cm3 (low productivity) 0.02-0.05 mg/cm3 (fair productivity) 0.05-0.10 mg/cm3(good productivity above 0.2 mg/cm3 as excessive [18].
Maximum turbidity values were found during the monsoon period in all the cases during the study period. The mean turbidity values were found to be 23.65 NTU in 2011-2012 and 22.33 NTU in 2012 2013 respectively (Table 2). A remarkable change in the turbidity value was noticed with the onset of winter season. Minimum turbidity values were found in pre-monsoon period in both years. Post-monsoon average was found 19 NTU and 21 NTU during 2011-2012 and 2012-2013 respectively.
Water turbidity is mainly due to suspended inorganic substances like clay, silt, phytoplankton and zooplankton and sand grains [30]. Reservoirs with clay bottom are likely to have high turbidity. Turbidity reduces the sunlight penetration and photosynthesis, hence acts as a limiting actor. High turbidity reduces the dissolved oxygen in water. In less turbidity waters, the aquatic weed growth is more. In high turbid waters, the sand grains accumulate in the gills of fish and prawns, causing suffocation and excessive secretion of mucous.
In turbid waters, more light is scattered and absorbed rather than transmitted in straight lines. The light penetrates only to shallow depths. The lower layer of water, being devoid of photosynthetic plants and also being in close contact with the decaying organic matter, suffers from oxygen depletion, causing the death of fishes [6,7].
The total dissolved solids were maximum during pre-monsoon season during entire study period. These values were lowest during monsoon period. Highest values of total dissolved solids were 860 and 890 mg/cm3 during 2011-2012 and 2012-2013 respectively (Table 1).
During the present study, minimum amount of dissolved solids have been observed in pre-monsoon when the water level comes down considerably due to evaporation. The increase in the concentration could be directly related to the surface area of the reservoir. Large amounts were due to run off water from attachment area. Aher et al., reported that seasonal change in water quality parameters of Kagdipura swamp near Aurangabad were high due to the sewage [31]. Salve and Hiware studied the water quality parameters of Wamparakalpa reservoir Nagpur and reported alkaline nature of water and useful for drinking [32]. Rajashekar et al., and Rao studied the water quality parameters of Nadergul reservoir and reported mesotrophic nature and water in useful for irrigation and fishing activities [19,33].
PHYSICO-CHEMICAL PARAMETERS OF SOIL
The soil of the reservoir was slightly alkaline with pH fluctuations around 7.27. The pH of soil ranged between 7.06 to 7.49 and 7.02 to 7.27 during 2011-2012 and 2012-2013 respectively. The high pH value was found during monsoon months during both the years. The maximum pH values of 7.25 and 7.26 were found in the month of October during both the years. The minimum pH values of 7.06 and 7.02 were recorded in the month of March (Table 3).
|
2011 - 2012 |
||||||
|
S No |
Parameter |
Pre Monsoon |
Monsoon |
Post Monsoon |
Average |
|
|
1 |
pH |
7.06 |
7.20 |
7.49 |
7.25 |
|
|
2 |
EC (µS-1) |
1530 |
1522 |
1620 |
1540 |
|
|
3 |
Phosphorous mg/100 g |
6.9 |
6.2 |
6.4 |
6.5 |
|
|
4 |
Nitrogen mg/100 g |
104 |
106 |
154 |
121.3 |
|
|
5 |
Potassium mg/100 g |
72 |
74 |
80 |
75.3 |
|
|
6 |
Organic matter (percentage) |
2.70 |
2.86 |
2.34 |
2.63 |
|
|
2012-2013 |
||||||
|
1 |
pH |
7.02 |
7.19 |
7.62 |
7.27 |
|
|
2 |
EC (µS-1) |
1540 |
1530 |
1610 |
1560 |
|
|
3 |
Phosphorous mg/100 g |
3.2 |
5.4 |
5.9 |
4.8 |
|
|
4 |
Nitrogen mg/100 g |
92 |
101 |
148 |
119 |
|
|
5 |
Potassium mg/100 g |
42 |
69 |
65 |
58.6 |
|
|
6 |
Organic matter (percentage) |
2.71 |
3.24 |
2.31 |
2.71 |
|
According to Jhingran and Sugunan, the soil pH 6.5 to 7.5 was medium productive, more than 7.5 pH was more productive and less than 6.5 pH was low productive in reservoirs of present study [29]. The pH values were around 7.5 hence the present reservoir is high productive in nature. The Ministry of agriculture has reported that a slightly alkaline soil with pH 7.5 was considered optimal for fish production in reservoirs.
Electrical conductivity values were ranged between 1530 to 1620 µs/cm-1 and 1540 to1610 µs/cm-1during 2011-2012 and 2012-2013 respectively. The fluctuations were negligible. Decrease in conductivity during the winter may be due to utilization of ionic minerals by the producer community (Table 3).
Das reported that the changes in Electrical Conductivity (EC) were associated with the release or depletion of soluble ions in the soil water system [14]. It definitely might have an indirect role to play in reservoir productivity. Specific conductivity (mmhos/cm) is very low in the reservoir under Cauvery (0.19-0.34) Godavari (0.42-0.72), Krishna (0.56-0.86) and Penna river (0.51-0.60) basins.
Phosphorus content in soil was ranged from 6.9 to 6.4 mg/100 g and 3.2 to 5.9 mg/100 g during 2011-2012 and 2012-2013 respectively. The fluctuations were negligible and no particular trend was observed in both the years (Table 3).
According to Mahajan and Mandloi available phosphorous in the soil of fish cultured pond of Madhya Pradesh was maximum in rainy season and minimum in summer [34]. Same was reported by Nath in Sardar Sarovar dam [35]. Das stated that soil available phosphorus should be in the range of 4.7 to 6.2 mg/100g for productivity [23]. Soil is highly alkaline under The Krishna and The Penna river systems as also depicted by lesser quantity of available phosphorus in those reservoirs.
Nitrogen fluctuations of soil were also observed in the present reservoir for 2011-2012 and 2012-2013. Nitrogen was ranged from 104-154 mg/100 g and 92-148 mg/100 g during the 2011-2012 and 2012 2013 respectively. The highest value was recorded in October (154 mg/100 g) and September (148 mg 100 g) in 2011-2012 & 2012 2013 respectively. The nitrogen values were high in the both years in the soil of this reservoir (Table 3).
The range of available nitrogen 50-75 mg/100 g of soil is relatively more favorable for reservoir productivity [36]. Das observed that deep reservoir contain lesser amount of available nitrogen (Srisailam, 7 m deep, 27 mg/ 100 g nitrogen) than shallower reservoir (Wyra 5.5 m deep, 63 mg/100 g) [23]. Nitrogen concentration in the soil of Adhartal pond, Madhya Pradesh was high in post monsoon period (10-65 to 10-80 mg/100 g) and low in pre-monsoon (0.78 mg/100 g) due to the rain water might have washed additional nutrients such as nitrate and phosphate from surrounding area [34]. A significant part of utilized nitrogen is also lost in the sediment and alters the soil nutrient status and benthic community structure [37].
Potassium values of the soil ranged from 72 mg/100 g-1 to 80 mg/100 g and 42 mg/100 g to 65 mg/100 g during 2011-2012 and 2012-2013, respectively. The high value of potassium was recorded in October (80 mg/100 g) in 2011- 2012 and in September (65 mg/100 g) in 2012-2013. The lowest value was recorded in August (72 mg/100 g) and May (80 mg/100 g) in 2011-2012 & 2012 2013 respectively. The values were high in post monsoon period and low in pre-monsoon period during the two years. In general the potassium values were high in the soil of present reservoir (Table 3).
According to Murugesan the low level of K+ was reported in the soil and water of Tamil Nadu reservoirs (
Organic matter values were also fluctuating and were irregular in soil of the present reservoir (2.70% to 2.71). The highest value of organic matter was recorded in July (2.86%) and in June (2.34%) during 2011-2012 and 2012-2013, respectively. The values were high in summer (pre monsoon) period. The lowest values were recorded in December (2.34%) and January (2.31%) during 2011-2012, respectively (Table 3).
According to Das soil organic matter not only influences the various physico-chemical properties of bottom sediment releasing different nutrients in a more available form in aquatic environment but also controls the oxidation reaction, an important property of reservoir ecosystem [23]. Comparatively most organic carbon content was recorded in reservoirs under Cauvery basin (1.7-2.7%) and Sharavathy system (1.1-3.4%) due to acidic nature of soil than the reservoirs under Godavari (1.7-19%), Krishna (0.7-2.5%) and Penna (0.6-1.7%) river system. Fish productive bottom sediment should have 1.5-2.5% organic carbon. Murugesan reported high content of organic carbon (>3%) in the Tamil Nadu reservoirs which were surrounded by thick forests [25,39].
According to Banarjee and Chattopadhyay the productivity of fish ponds depends, to a large extent quality of bottom soils [40]. Fish forms under red and latenitic soil zones usually exhibit very low productivity levels.
CONCLUSION
REFERENCES
- Ganapati SV (1929) Some observations on water of Red Hills lake at Madras India. J Med Res 16: 1139-1147.
- Apha (1995) Standard Methods for the Examination of Water and Wastewater. 14 Edn. New York, USA.
- Wilcox LV, Hatcher JT (1950). Methods of analysis used in the Rhidoux Laboratory, Riverside, California, USA, Dept. of Agriculture, California, USA, Pg no: 67.
- Golterman HL (1971) Methods for chemical analysis of fresh waters IBP Handbook No. 8 Black well. Sci Publ London 166pp.
- National Environmental Engineering Research Institute (1987) Laboratory manual on water analysis. NEERI, Nagpur, India. Pg no: 86.
- Piska RS (2000) Concepts of Aquaculture. Lahari Publications, Hyderabad, India.
- Piska RS (2000) Impact of stocking densities of major can seed on fish production in a minor reservoir. Fishing Chimes 20: 39-41.
- Piska RS, Chary KD, Krishna M (2004) Fish production in a Tilapia-dominated perennial tank. Nat Symp Fisheries enhanced Inland waters Pg no: 34.
- Piska RS, Devi BS, Chary KD (2000) The present status of fisheries of Ibrahimbagh, a minor reservation of Hyderabad. Fishing Chimes 20: 41-43.
- Piska RS (2001) Fisheries of minor reservoir. Ind J Fish 48: 119-122.
- Malu (2001) Lonar lake, a case for protection and conservation as Ramsar site. Workshop on Lake Management in India: 15-19.
- Das SR, Nandi NC (2001) Oxbow lake environment and management of Ichhamati river basin, West Bengal. Workshop on lake management in India Pg no. 27.
- Unni KS, Bhade CL, Bhade S (1998) Limnology and eutrophication of Tawa Reservoir, M.P. State, Central India J Inland fish Soc 30: 13-23.
- Das AK (2000) Role of physical and chemical features of Soil in reservoir productivity. Fishing Chimes 20: 30-2.
- DAS AK, Srivastava NP (2001) Proc. Workshop on Lake 'Management in India Page no. 31.
- Das AK (2002) Evaluation of production potential in a peninsular reservoir (Yerrakalva). J Inland Fish Soc India 34.
- Shrivastava NP (2005) Plankton status of Ravi Shankar Sagar reservoir. J inland Fish Soc India 37: 43-47.
- Yelavarthy E (2002) Hydro-biological studies of Red Hills Reservoir, North Chennai, Tamil Nadu. J Aquat Bio 17: 13-16.
- Rao MSS (2006) Impact of Stocking sizes of Major Carps on its production in a minor reservoir. Thesis submitted to Osmania University, Hyderabad, India.
- Boyd GE (1973) Summer algal communities and primary productivity in fish ponds. Hydrobiol 41: 357-390.
- Swingle HS (1968) Standardization of chemical analysis for water and pond muds. FAO Fish rep 44: 397-421.
- Pulle JS, Khan AM (2001) Seasonal variations in primary production in Isapur Dam, J Aqua Biol 16: 19-33.
- DAS AK (2001) Limno - chemistry of some Andhra Pradesh Reservoirs. J. Inland Fish. Soc. India 32: 37-44.
- Rao DSR (2005) Strategies for enhancement of fish production from Indian reservoirs. Fishing Chimes 25: 86-90.
- Mohanty RK (2000) Activated microbial suspension and nitrogen control in aquaculture system. Fishing Chimes 20: 50-51.
- Das SK, Bhattacharjya BK, Goswami UC (2001) Diet variation of pH in fish ponds of Nagaon District, Assam. J Inland Fish Soc India 33: 45-48.
- Hannan HH, Young WC, Mayhew JJ (1973) Nitrogen and Phosphorus in a Stretch of the Guadalupe River, Texas, with Five Main-Stream Impoundments. Hydrobiologia 41: 419-441.
- Piska RS, Rao AM (2002) Phenominat fish production in the Tilapia-dominated tank. Aquaculture 3: 171-176.
- Sugunan VV, Sinha M (2000) Guidelines for Small Reservoir Fisheries Management. Central Inland Capture Fisheries Research Institute, West Bengal, India.
- Piska RS (1999) Fisheries and Aquaculture. Lahari publications, Hyderabad, India.
- Aher SK, Mane UH, Pawar BA (2007) A study on physico-chemical parameters of Kagdipura Swamp in relation to Pisciculture Aurangabad, Maharashtra. J Aqua Biol 22: 93-96.
- Salve BS, Hiware CJ (2007) Studies on water quality of Wanparakalap reservoir Nagpur, near Parli Vaijnath, dist, Marathawada region. J Aqua bio 22: 113-117.
- Rajashekhar AV, Lingaiah MS, Rao S, Piska RS (2007) The studies on water quality parameters of a minor reservoir, Nadergul, Rangareddy district, Andhra Pradesh. J Aqua Biol 22: 118-122.
- Mahajan S, Mandloi AK (1998) Physico-chemical characteristics of soil and water in relation to plankton production of fish culture pond. J Inland fish Soc India 30: 92-98.
- Nath D (2001) Water and Soil of the Narmada estuary before commissioning of Sardar Sarovar Dam. J Inland Fish Soc India 33: 37- 41.
- Rath RK (1993) Fresh water Aquaculture Scientific Publishers. Jodhpur, India.
- Mohanty RK (2000) Activated Microbial suspension and Nitrogen control in Aquaculture system. Fishing Chimes 20: 50-51.
- Murugesan VK, Palaniswamy R, Manoharan S (2002) The influence of water quality on the productivity of reservoirs in Tamilnadu. Proc Nat Symp Fish. Enhance in Inland Waters 37A.
- Murugesan VK, Palaniswamy R, Manoharan S (2002) Fish production potential, actual yield and scope for enhancement of four medium reservoirs in Tamilnadu. Proc Nat Symp Fish. Enhance in Inland Waters 56.
- Banerjee A, Chattopadyay GN (2002) Soil quality based approach for increasing productivity of fish ponds - a case study. Nat Symp Fisheries Enhanc Inland Waters 42.
Citation: Kumari S, Khan JA, Thakur MS, Lal H (2019) Study of Physico-Chemical Characteristics of Water and Soil in Relations to Fish Production in Motia Lake Reservoir. J Atmos Earth Sci 2: 006.
Copyright: © 2019 Sarita Kumari, et al. This is an open-access article distributed under the terms of the Creative Commons Attribution License, which permits unrestricted use, distribution, and reproduction in any medium, provided the original author and source are credited.