Substance Abuse during the Pandemic: Implications for Labor-Force Participation
*Corresponding Author(s):
Karen KopeckyEmory University, Federal Reserve Bank Of Atlanta, Atlanta, United States
Email:karen.kopecky@atl.frb.org
Abstract
The labor-force participation rates of prime-age U.S. workers dropped in March 2020-the start of the COVID-19 pandemic-and have still not fully recovered. At the same time, substance-abuse deaths were elevated during the pandemic relative to trend indicating an increase in the number of substance abusers, and abusers of opioids and crystal methamphetamine have lower labor-force participation rates than non-abusers. Could increased substance abuse during the pandemic be a factor contributing to the fall in labor-force participation? Estimates of the number of additional substance abusers during the pandemic presented here suggest that increased substance abuse accounts for between 9 and 26 percent of the decline in prime-age labor-force participation between February 2020 and June 2021.
Keywords
COVID-19 pandemic; Substance abuse; Labor-force participation
JEL Classification Numbers
I12, J11, J21
Introduction
There was a substantial decline in labor-force participation in the U.S. at the start of the COVID-19 pandemic, recovery from which has been slow. The decline is in part due to the exit and subsequent low rates of return of older workers [1]. However, there has also been a large decline in the Labor-Force Participation Rate (LFPR) of prime-age workers between ages 25 and 54. While there has been some recovery, as of January 2022, the participation rate is still well below its pre-pandemic levels.
The dramatic drop and sluggish recovery in the labor supply of prime-age workers can be seen in figure 1. Early on in the pandemic, the LFPR dropped by about 3 percentage points, and although two-thirds of that decline has recovered, the rate is still about 1 percentage point below its pre-pandemic level. After its steady decline since the late 1990s, the LFPR of prime-age workers was trending upward before the pandemic[1]. The straight dashed line in the figure shows the trend in labor-force participation over the January 2015 to February 2020 period. Assuming the prime-age LFPR would have increased at the same rate absent the COVID-19 pandemic, the LFPR is about 1.6 percentage points below trend.
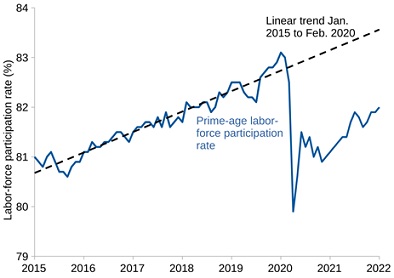 Figure 1: Labor-force participation rate, ages 25-54, January 2015 to January 2022.
Source: U.S. Bureau of Labor Statistics.
The COVID-19 epidemic hit the U.S. during the middle of another major health crisis, the opioid epidemic[2]. The number of overdose deaths from opioids, but also other substances like alcohol and methamphetamine (meth), increased dramatically with COVID-19 leading the New York Times to refer to the COVID-19 epidemic as a “national relapse trigger” [6]. Opioid use is associated with lower labor-force participation and employment[3]. During the 2015-18 period, the LFPR of prime-age workers with an opioid-use disorder was 70 percent, 13 percentage points lower than that of those without a substance-use disorder. Meth use is associated with an even larger reduction in labor-force participation. Meth users’ LFPR during 2015-18 was 67 percent, 16 percentage points lower than that of those without a substance-use disorder. If the increase in substance-abuse deaths during the COVID-19 epidemic reflects, partly or fully, a rise in the number of people with substance-use disorder, this rise is a potential source of the decline in labor-force participation[4].
Figure 2 shows the deaths rates associated with overdoses from different substances[5]. The solid blue line in the figure displays monthly deaths from narcotics, which covers various types of opioids such as opium, heroin, fentanyl, and other natural and synthetic opioids, as well as deaths from cocaine. The blue dashed line shows the trend and seasonal narcotic deaths based on the pre-pandemic period[6]. The red solid and dashed lines show the death rates, actual and predicted, from alcohol (excluding those associated to drunk driving). Finally, the green lines are deaths from psychostimulants, primarily crystal methamphetamine (meth). Meth deaths have also been higher during the pandemic, although they have not been as elevated relative to their exponentially increasing trend as narcotic and alcohol deaths.
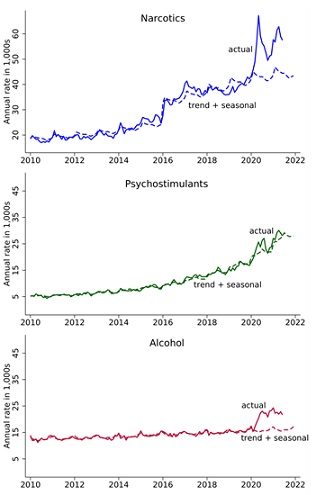 Figure 2: Annual rate of drug and alcohol deaths, ages 25-54, January 2010 to June 2021.
Source: Mulligan [12], CDC database of death certificates. Narcotics and psychostimulants are primarily opioids and methamphetamine, respectively. They are selected on MCD codes. Alcohol-induced deaths are selected on UCD codes. Trends use 1999-2019 data and include seasonal factors.
While the number of overdose deaths is available up to June 2021, data on individuals who abuse different substances is not available for the post-COVID period. The latest data from the National Survey of Drug Use and Health (NSDUH) was published in October 2021 and covers drug use during 2019[7]. The NSDUH classifies individuals as misusers of opioids if they use any opioids without a prescription, use them for reasons other than directed by a physician, or use them in greater amounts or more often than prescribed during the past 12 months. Individuals consuming alcohol, heroin or meth are classified as misusers by default[8]. Misusers are then asked follow-up questions to determine whether they have a disorder. To be labeled as someone with a disorder, substance abuse must interfere with a person’s daily life. People with a disorder and abusers are used interchangeably below. Once the additional number of abusers is estimated, the gap in labor-force participation between abusers and non-abusers can shed light on the extent to which higher alcohol and drug use during the epidemic is behind the decline in aggregate labor-force participation.
Higher Drug Use During The Epidemic
The increase in substance abuse deaths during the COVID-19 pandemic could be due to an increase in the death rate of substance abusers or an increase in the number of abusers or some combination of the two. To see this, let Ut be the number of users at time t, and Dt be the number of deaths. Let δ(mt, ut) be the death rate conditional on being an abuser which might depend on medical technology or environment (mt) and usage (ut). The number of deaths at time t must equal the number of abusers at time t times the death rate conditional on abuse, or Dt = δ(mt, ut)Ut.
First, suppose that the death rate of abusers, δ(mt, ut), did not change during the pandemic, and the entire increase in deaths is driven by an increase in the number of abusers, Ut. Why might the number of abusers have increased? There are several potential reasons. Increased anxiety, isolation, joblessness, and other factors caused by the pandemic could have led to an increased desire to abuse drugs and/or alcohol [14]. The link between economic conditions and opioid use has been studied by Hollingsworth et al. [15] who find that county-level increases in the unemployment rate are associated with higher opioid deaths and opioid overdose emergency room visits. For alcohol, the shift to drinking at home from drinking in restaurants and bars reduced the cost per ounce, which may have led to higher quantities consumed[9],[10]. During the pandemic, there were also fewer options for ways to spend both time and money. Moreover, like many leisure goods, abusing drugs and alcohol requires time[11]. This is especially true when accounting for both the time spent abusing the substances and the time spent recovering from their usage. Given this complementarity between time and drugs and alcohol, declines in the value of time may have effectively led to decreases in the total cost of substance abuse and, consequently, an increase in the number of abusers. Whatever the initial impetus is, once started, drug and alcohol abuse is difficult to stop for many people. For this reason, the complementarity between time and drug or alcohol use can also explain why an increase in substance abuse during the pandemic would mean lower labor-force participation rates even after the pandemic has ended[12].
If the increase in deaths is entirely driven by a rise in the number of abusers, how large is the impact on the LFPR? To answer this question, requires calculating the additional number of abusers of opioids, meth and alcohol. As the equation above shows, the number of abusers of a substance can be imputed by dividing the number of deaths by the death rate, i.e., Ut = Dt/δ(mt, ut). The gap between the LFPRs of abusers and non-abusers then provides an estimate of the drop in the aggregate LFPR due to the higher number of abusers during the epidemic.
The first row of table 1 reports the cumulative number of deaths from opioids, meth, and alcohol between April 2020 and June 2021 for individuals ages 25 to 54[13]. The second row reports the number of deaths predicted using the pre-pandemic trend and seasonal components in figure 2. Subtracting the second row from the first row gives an estimate of the additional number of deaths that occurred due to the COVID-19 pandemic. These are reported in the third row. There were 69,342 opioid deaths between April 2020 and June 2021, 14,820 of which were above the level predicted by the pre-pandemic trends. Similarly there were 2,702 excess meth-related deaths and 7,835 excess alcohol-related deaths. In total, during this period there were an additional 25,356 drug and alcohol deaths.
|
|
Opioids |
Meth |
Alcohol |
Total |
|
Number of deaths |
||||
|
Actual |
69,342 |
32,363 |
27,683 |
129,389 |
|
Predicted from trend + seasonals |
54,522 |
29,662 |
19,848 |
104,032 |
|
Additional deaths |
14,820 |
2,702 |
7,835 |
25,356 |
|
Pre-pandemic annual death rate |
0.61% |
0.27% |
0.26% |
|
|
Alive with substance use disorder (1000s) |
||||
|
Actual |
9,166 |
9,735 |
8,503 |
27,404 |
|
Predicted from trend + seasonals |
7,207 |
8,922 |
6,096 |
22,226 |
|
Additional number of abusers |
1,959 |
813 |
2,406 |
5,178 |
Table 1: Total deaths and imputed abusers ages 25-54 by substance assuming no change in the death rate conditional on abuse, April 2020 - June 2021.
Next turn attention to the death rates. Under the assumption that these rates did not change during the pandemic, they are determined by dividing the number of deaths pre-pandemic by the number of abusers. These death rates, taken from Mulligan [12], are reported in the fourth row of table 1. The death rate for opioids, about 0.6 percent, is much higher than those for meth and alcohol, about 0.26-0.27 percent. Further details are provided in Appendix A.
For each substance, the number of abusers (individuals with substance-use disorder) can now be inferred by simply dividing the number of deaths by the pre-pandemic death rates[14]. As the bottom three rows of table 1 report, more than 27 million prime-age individuals are estimated to have a substance abuse disorder with more than 5 million of these individuals, 23 percent, being additional substance abusers above the expected level based on past trend and seasonal effects[15].
Substance Abuse And The Decline In LFP
Next turn to how much substance abuse lowers labor-force participation. The first row of table 2 shows the difference between the LFPRs of opioid, meth, and alcohol non-abusers and abusers. The LFPRs are calculated from the 2015-2018 NSDUH for prime-age individuals who either exhibit a disorder from using a particular substance or do not have a substance-disorder[16]. The LFPR of individuals with an opioid-use disorder is 69.7 which is 13.2 percentage points below the prime-age rate for individuals who do not have a substance-use disorder of 82.9 percent. Similarly, the LFPR for individuals with meth-use disorder is 66.7 percent which is 16.3 percentage points below the rate for individuals without a substance-use disorder. By contrast, there is no difference in LFPRs between alcohol abusers and non-abusers. Since the data shows no impact of alcohol abuse on labor-force participation, the increase in alcohol abusers will not have any impact on the number of additional individuals out of the labor force. For each substance, multiplying the number of abusers in table 1 by the difference between the LFPR of abusers and non-abusers gives an estimate of the number of prime-age individuals who are out of the Labor Force (LF) due to substance abuse. For example, multiplying the 1.96 million additional opioid abusers reported in table 1 by 13.2 percentage points implies that about 259,000 additional people are not in the labor force due to elevated levels of opioid abuse. The estimates indicate that all together there are over 2.7 million prime-age individuals not participating in the labor market due to substance abuse, 391,000 of which are additional non-participants due to the elevated levels of abuse during the COVID-19 pandemic.
|
|
Opioids |
Meth |
Alcohol |
Total |
|
LFPR of non-abusers - LFPR of abusers (percentage points) |
13.2 |
16.3 |
0 |
7.6 |
|
Out of labor force due to substance abuse disorder (1,000s) |
||||
|
Actual |
1,211 |
1,585 |
0 |
2,796 |
|
Predicted from trend + seasonals |
952 |
1,453 |
0 |
2,405 |
|
Additional number out of labor force |
259 |
132 |
0 |
391 |
Table 2: Impacts of substance abuse on labor-force participation.
The source for relative LFPRs is NSDUH.
Table 3 summarizes the impact of the COVID-19 epidemic on labor-force participation of prime-age workers. Due to a 1.3 percentage point lower participation rate, there were 1.51 million fewer prime-age individuals in the labor force in June 2021 than in February 2020. The sixth row of the table reports the number of individuals predicted to be in the labor force in June 2021 using the pre-pandemic trend. Relative to the predicted number of 105.04 million, there were 2.02 million fewer participants[17]. How many of these missing workers might be attributed to drug abuse?
|
|
Feb. 2020 |
Jun. 2021 |
|
Population aged 25-54 (millions) |
125.95 |
126.10 |
|
LFPR 25-54 |
83.0% |
81.7% |
|
Number of 25-54 in LF (millions) |
104.54 |
103.02 |
|
Decline in LF from Feb 2020 (millions) |
|
1.51 |
|
Predicted LFPR 25-54 |
|
83.3% |
|
Predicted number of 25-54 (millions) |
|
105.04 |
|
Decline in LF from predicted (millions) |
|
2.02 |
Table 3: Number of prime-age labor-force participants in February 2020, and number and predicted number in June 2021.
Under the assumption of no change in the death rate of abusers, the increase in opioid and meth usage during the pandemic accounts for a sizable fraction of the decline in LFPRs. The results are reported as the upper bound estimates in table 4. These shares are determined by taking the estimated 391,000 additional individuals not participating due to substance abuse reported in table 2 and dividing it by the declines in the size of the labor force reported in table 3. Additional non-participants due to elevated substance abuse are 25.8 percent of the 1.51 million person decline in the labor force between February 2020 and June 2021 and 19.4 percent of the decline from the predicted June 2021 levels based on the pre-pandemic trend. Next, is provided a lower-bound estimate assuming that the rise in opioid deaths during the pandemic was due to increased opioid use of existing abusers rather than a surge in the number of abusers.
|
|
Upper bound |
Lower bound |
|
Share of decline from Feb. 2020 level |
25.8% |
8.7% |
|
Share of decline from predicted June 2021 level |
19.4% |
6.6% |
Table 4: Estimated share of the decline in the size of the labor force between Feb. 2020 and June 2021 that is due to increased substance abuse.
Were Death Rates Constant During The Epidemic?
The calculations have so far assumed that the death rate δ(mt, ut) was constant during the epidemic. This, of course, is a strong assumption. One concern, for example, might be that medical services for people with substance disorders were less available or effective during the pandemic, which would change mt and increase the death rate. Yet, there is no clear evidence that this was the case, at least not for those who had a disorder before the pandemic. In a survey of centers prescribing medication for Opioid Use Disorder (OUD), Uscher-Pines et al. [20] find that there was a quick move to telemedicine[18]. Focusing on patients, Huskamp et al. [22] also document that patients with an OUD did not have any trouble with medication refills or clinical visits.
Still, fentanyl usage increased rapidly during the pandemic, affecting ut and, as a result, the death rate. Figure 3 shows the ratio of heroin, illicit prescription (Rx) opioid, and synthetic opioid (primarily fentanyl) deaths to the overall narcotics death trend for individuals ages 18 to 69. The figure shows that the increase in narcotics deaths was driven by increased fentanyl usage relative to heroin and prescription opioid abuse. Consistently, based on an analysis of a large number of urine samples before and during the epidemic, Niles et al. [23] find that fentanyl positivity rates increased by more than 50 percent during the pandemic. Since fentanyl usage is associated with a higher death rate than that of heroin and other organic forms of opioids, the rapid increase in fentanyl usage may have led to a higher death rate among narcotic abusers. 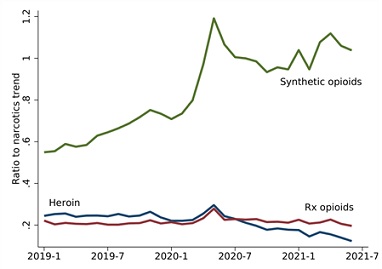
Figure 3: Deaths involving heroin (T40.1), Rx opioids (T40.2), and synthetic opioids (T40.4) relative to trend and seasonal narcotic deaths, ages 18-69.
Source: Mulligan [12], CDC database of death certificates. Trend and seasonal (monthly) narcotic deaths are estimated using 1999-2019 data.
Imagine that the number of opioid users did not change, i.e. Ut = Ut+1, and instead, all of the additional opioid deaths during the pandemic were driven by a higher death rate of abusers due to a shift in usage from organic opioids to fentanyl. While this is clearly a very strong assumption, it provides a lower bound on the likely impact of the increase in substance abuse on LFPRs. If the number of narcotic abusers did not increase (and synthetic opioids do not inhibit labor supply more than organic ones), then the only impact on LFPRs is from the increase in the number of meth users. According to table 2, the number of additional individuals out of the labor force due to additional meth use during the pandemic is 132,000 which accounts for 8.7 percent of the decline in labor-force participation between February 2020 and June 2021 and 6.6 percent of the decline in labor-force participation relative to the pre-pandemic trend. These lower bound estimates of the effect of increased substance abuse during the pandemic on labor-force participation are reported in the second column of table 4.
Conclusion
Using data on substance abuse deaths, increased substance abuse during the COVID-19 pandemic is estimated to account for between 9 and 26 percent of the decline in prime-age labor-force participation between February 2020 and June 2021. A decline that, as of January 2022, has still not fully recovered. Relative to levels predicted using the pre-pandemic trend, estimates indicate that increased substance abuse accounts for 7 to 19 percent of the decline.
Interestingly, the falls in labor-force participation in early 2020 were larger for those without a college degree. The LFPR of non-college individuals dropped by 3.9 percentage points compared to a 2.8 percentage point drop for those with a college degree. Non-college labor-force participation has also been slower to rebound. As of January 2022, more than 70 percent of the initial fall in the LFPR of college graduates has recovered with the rate now less than 1 percentage point below levels predicted by the pre-pandemic trend. In contrast, less than half of the initial drop for non-college has recovered. As of January 2022, the non-college rate is still 2.4 percentage points below trend.
The large initial drop in labor-force participation by non-college individuals and its slow recovery may be due to differential rates of increase in substance abuse by education during the pandemic. Rates of opioid abuse are more than three times higher, and rates of meth abuse nearly six times higher, among those without a college degree. Given their higher prevalence for illicit drug use, the extent of drug abuse may have increased more for non-college individuals during the pandemic leading to larger negative effects on their labor-force participation.
Appendix A: Pre-Pandemic Death Rates
The death rates reported in table 1 are calculated as follows. Start with alcohol. In the NSDUH, there were 14.818 million individuals above age 18 with alcohol use disorder in 2018 and 14.504 million in 2019 [24], Table 5.2.A. In the same years, 37,329 and 39,043 individuals in the same age group died due to alcohol-induced causes. Dividing the average number of deaths in 2018 and 2019 (38,186) by the average number of users (14,661 million) gives an annual death rate from alcohol abuse of 0.26 percent. For the death rate from opioids, Barocas et al. [25] estimate that there were 254,127 individuals of all ages with opioid disorder in Massachusetts between 2014 and 2015[19]. The number of opioid-related overdose deaths for the same years was 1,538. Again, dividing the average number of deaths by the average number of users gives an annual death rate of 0.605 percent. Finally, following Mulligan [12], deaths from opioid disorder are assumed to be 2.3 times more deadly than meth use disorder; i.e., the death rate for meth is assumed to be 0.605/2.3 percent.
Acknowledgment
We thank Casey Mulligan for discussions that initiated this work and valuable comments. We also thank members of the labor policy group at the Atlanta Fed for feedback and suggestions, R. Anton Braun and Chris Cunningham for detailed feedback and Francesco Chiocchio for excellent research assistance. The views expressed herein are those of the authors and not necessarily those of the Federal Reserve Bank of Atlanta or the Federal Reserve System.
[1]See Binder and Bound [2] and Abraham and Kearney [3] for recent reviews on the decline in labor-force participation in the U.S.
[2]Since 2000, there have been more than 500,000 deaths from opioid overdose. Cutler and Glaeser [4] provides a review of the extensive empirical literature on the opioid crisis. A model of opioid abuse is developed by Greenwood et al. [5] to study its driving forces.
[3]Krueger [7], Aliprantis et al. [8], Harris et al. [9] and Powell [10] exploit geographic variation in opioid exposure to study its impact on labor market outcomes.
[4]Another potential source of sluggish labor-force recovery is lower responsiveness of the participation rates of younger generations to wage growth as documented by Hotchkiss [11].
[5]Deaths involving multiple substances are double counted in the figure. However, this double counting is largely offset by deaths from undetermined substances (not shown in the figure).
[6]Following Mulligan [12], the dashed trend plus seasonal lines are determined by regressing the log of deaths from January 1999 to December 2019 on a quartic in time at the monthly frequency and month-of-year dummies. The narcotics regressions also include indicator variables for dates ≥January 2006 and dates ≥January 2016. Large jumps in narcotics deaths are seen at these dates, which may be due to the increased coverage of prescription drugs, including prescription opioids, through the introduction of Medicare Part D and the increased availability of fentanyl in the U.S. illicit drug market, respectively. See Mulligan [12] and Council of Economic Advisers (US) [13].
[7]The National Survey on Drug Use and Health (NSDUH) is an annual nationwide survey that provides national and state-level data on the use of tobacco, alcohol, illicit drugs (including the non-medical use of prescription drugs) and mental health in the United States. The survey represents the age 12 and over civilian non-institutionalized population of the United States for each state and the District of Columbia (D.C.). The NSDUH is directed by the Substance Abuse and Mental Health Services Administration (SAMHSA), an agency in the U.S. Department of Health and Human Services (HHS).
[8]This reflects the fact that in contrast to prescription opioids, a reference, or accepted, level of consumption does not exist.
[9]According to Nielssen, sales of alcohol in stores increased by 27 percent in the U.S. between mid-March and mid-May of 2020 [16].
[10]Mulligan [12] argues that the shift away from heroin and prescription opioids to fentanyl during the epidemic (discussed below) led to a reduction in the price per morphine milligram equivalent of opioids which similarly may have led to higher levels of consumption.
[11]The notion that the consumption of leisure goods is time intensive is not new. It was used, for instance, by Kopecky [17] to understand the rise in retirement in the U.S. in the 20th century.
[12]There is some evidence that additional users drove the increase in opioid deaths during the pandemic. The Center for Disease Control and Prevention [18], for example, shows that the rise in deaths associated with fentanyl was mainly in Western states, while historically, fentanyl-related deaths were concentrated in the East. Kim et al. [19], focusing on opioid-related deaths in Illinois, document that during the pandemic a larger fraction of opioid-overdose deaths had no prior opioid use disorder treatment.
[13]June 2021 is the last month of available data on deaths. The analysis uses opioid overdose deaths, since deaths from cocaine overdose, the remaining part of narcotics, have not experienced a jump during the epidemic.
[14]Since total deaths are for a 15 month period (April 2020 through June 2021), the annual death rates are multiplied by 15/12.
[15]For alcohol, using deaths of individuals ages 25-54 to impute the number of abusers likely undercounts the total number of abusers since many alcohol deaths are not acute. Alternatively, one could use alcohol deaths for all ages assuming they are proportional to the rise in the number of prime-age alcohol abusers. Under this assumption, the number of additional prime-age alcohol abusers increases by 4.2 million instead of the 2.4 million reported in table 1.
[16]The age of respondents in the public-use version of the NSDUH is reported in age ranges. The numbers in table 2 for prime-age, 25-54, individuals are averages of the ratios for age groups 26-49 and 24-64.
[17]Labor-force participation levels did not fully recover after June 2021 as figure 1 shows. As of January 2022, the most recent date for which labor-force participation rates are available, the number of prime-age individuals in the labor force is still 0.26 million below the February 2020 level and 2.03 million below levels predicted by the pre-pandemic trend.
[18]For a discussion on COVID-19 related measures that waived in-person assessment for the OUD prescriptions, see Wakeman et al. [21].
[19]Barocas et al. [25] use administrative data to estimate the number of individuals with opioid use disorder, which overcomes potential underreporting of opioid use disorder in the NSDUH.
References
- Bauer L, Edelberg W (2021) Labor Market Exits and Entrances are Elevated: Who is Coming Back? Brookings, Washington, D.C., USA.
- Binder AJ, Bound J (2019) The Declining Labor Market Prospects of Less-Educated Men. J Econ Perspect 33: 163-190.
- Abraham MG, Kearney MS (2020) Explaining the Decline in the US Employment-to-Population Ratio: A Review of the Evidence. Journal of Economic Literature 58: 585-643.
- Cutler DM, Glaeser EL (2021) When Innovation Goes Wrong: Technological Regress and the Opioid Epidemic. Journal of Economic Perspectives 35: 171-196.
- Greenwood J, Guner N, Kopecky K (2022) The Downward Spiral. NBER Working Paper 29746.
- Hoffman J (2020) With Meetings Banned, Millions Struggle to Stay Sober On Their Own. New York Times, USA.
- Krueger AB (2017) Where Have All the Workers Gone? An Inquiry into the Decline of the U.S. Labor Force Participation Rate. Brookings Pap Econ Act 2017: 1-87.
- Aliprantis D, Fee K, Schweitzer ME (2019) Opioids and the Labor Market. Federal Reserve Bank of Cleveland, Working Paper no. 18-07R2, Ohio, USA.
- Harris MC, Kessler LM, Murray MN, Glenn B (2020) Prescription Opioids and Labor Market Pains: The Effect of Schedule II Opioids on Labor Force Participation and Unemployment. Journal of Human Resources 55: 1319-1364.
- Powell D (2021) The Labor Supply Consequences of the Opioid Crisis. RAND Working Paper, California, USA.
- Hotchkiss JL (2022) Will Wage Growth Alone Get Workers Back Into the Labor Market? Not Likely. Federal Reserve Bank of Atlanta’s Policy Hub, Georgia, USA.
- Mulligan CB (2022) Lethal Unemployment Bonuses? Substitution and Income Effects on Substance Abuse, 2020-21. NBER Working Paper 29719, Massachusetts, USA.
- Council of Economic Advisers (US) (2010) Economic Report of the President, Transmitted to the Congress February 2010 Together with the Annual Report of the Council of Economic Advisors. Council of Economic Advisers, USA.
- Weiner S ((2020)) COVID-19 and the opioid crisis: When a pandemic and an epidemic collide. Association of American Medical Colleges, Washington, D.C., USA.
- Hollingsworth A, Ruhm CJ, Simon K (2017) Macroeconomic conditions and opioid abuse. J Health Econ 56: 222-233.
- Valinsk J (2020) People are buying lots of booze, but global alcohol sales are still tanking. CNN Business, UK.
- Kopecky KA (2011) The trend in retirement. International Economic Review 52: 287-316.
- Center for Disease Control and Prevention (2020) Increase in Fatal Drug Overdoses Across the United States Driven by Synthetic Opioids Before and During the COVID-19 Pandemic. CDC, Georgia, USA.
- Kim HS, Feinglass J, McCarthy DM, Lank PM, Mason M (2021) Unintentional Opioid Overdose Death Characteristics in Illinois Before and During the COVID-19 Era, 2017 to 2020. JAMA Health Forum 2: 213699-213699.
- Uscher-Pines L, Sousa J, Raja P, Mehrotra A, Barnett M, et al. (2020) Treatment of opioid use disorder during COVID-19: Experiences of clinicians transitioning to telemedicine. J Subst Abuse Treat 118: 108124.
- Wakeman SE, Green TC, Rich J (2020) An Overdose Surge will Compound the COVID-19 Pandemic if Urgent Action is not Taken. Nat Med 26: 819-820.
- Huskamp HA, Busch AB, Uscher-Pines L, Barnett ML, Riedel L, et al. (2020) Treatment of Opioid Use Disorder among Commercially Insured Patients in the Context of the COVID-19 Pandemic. JAMA 324: 2440-2442.
- Niles JK, Gudin J, Radcliff J, Kaufman HW (2021) The Opioid Epidemic Within the COVID-19 Pandemic: Drug Testing in 2020. Popul Health Manag 24: 43-51.
- Substance Abuse and Mental Health Services Administration, Center for Behavioral Health Statistics and Quality (2020) Results from the 2019 National Survey on Drug Use and Health: Detailed Table. SAMHSA, CBHSQ, Rockville, USA.
- Barocas JA, White LF, Wang J, Walley AY, LaRochelle MR, et al. (2018) Estimated Prevalence of Opioid Use Disorder in Massachusetts, 2011-2015: A Capture-Recapture Analysis. Am J Public Health 108: 1675-1681.
Citation: Greenwood J, Guner N, Kopecky K (2022) Substance Abuse during the Pandemic: Implications for Labor-Force Participation. J Addict Addictv Disord 9: 087.
Copyright: © 2022 Jeremy Greenwood, et al. This is an open-access article distributed under the terms of the Creative Commons Attribution License, which permits unrestricted use, distribution, and reproduction in any medium, provided the original author and source are credited.