Journal of Addiction & Addictive Disorders Category: Clinical
Type: Research Article
The Influence of Attitudinal Variables on the Frequency of Water-Pipe Smoking and on Driving Ability
*Corresponding Author(s):
Wafa EliasDepartment Of Civil Engineering, Shamoon College Of Engineering, Beer Sheva, Israel
Tel: +972 88519342,
Email:wafael@sce.ac.il
Received Date: Jul 28, 2017
Accepted Date: Sep 12, 2017
Published Date: Sep 26, 2017
Abstract
Waterpipe Tobacco Smoking (WTS) has become increasingly more popular, especially among youth. The present study examined which factors influence the decision to engage in WTS and to what degrees. In addition, we examined the influence of WTS on driving abilities. The population of the study consisted of 100 Israeli Arabs (70 WTS users and 30 non-users). The study applied a case-control design, whereby WTS users completed driving tasks using a simulator before and after a single session of WTS and were compared to non-users who completed similar driving tasks. Physiological measures, heart rate and blood oxygenation, were taken before each task. Distinguishing between frequent and infrequent WTS users, participants were asked to complete a questionnaire based on Ajzen’s Theory of Planned Behavior. WTS status was found to be in a statistically significant negative correlation with driving abilities. Frequent users had a relatively higher risk for violations and crashes compared to infrequent users. The physiological symptoms displayed were consistent with those expected due to hypoxia. Planned Behavior Theory (PBT) proved efficient in predicting the decision to engage in WTS. The findings support the hypothesis that WTS causes a reduction in driving abilities via hypoxia while underscoring the role of PBC in determining WTS behavior. It is imperative that policymakers be made aware of the growing popularity of WTS, especially amongst youth, given the secondary life-threatening effects it may have. The influence of PBC has been demonstrated in regards to various health behaviors, including smoking, but has not WTS. In particular, future interventions should target the component of personal behavioral control in order to reduce WTS usage.
Keywords
Driving ability; Perceived behavioral control; Public health; Water-pipe tobacco smoking
INTRODUCTION
Waterpipe Tobacco Smoking (WTS) as a popular pastime has grown remarkably popular over the past 20 years, especially among youth and young adults. Studies have shown that approximately one-fifth of these populations, both in the US and in Europe, reported engaging in WTS [1-5]. Though WTS is commonly practiced among non-Western societies, recent years have been marked by a significant surge in its popularity [6]. Thus, alongside the rise in popularity leading scholars and medical associations have started to call attention to the many likely health implications of WTS, and the danger of an emerging global epidemic [7-11].
The waterpipe is a centuries-old smoking device, arguably originating in the Middle East. It has numerous variants known as Hookah, Nargilah, Argileh, Hubbly-Bubbly, Shisha and Goza. The term “waterpipe” has come to serve in the scientific literature as an umbrella category. Although these devices are not identical, they all share a mechanical principle: in order to smoke one places burning charcoal over flavored Tobacco, usually separated by an aluminum foil, using a hose the smoke first goes through a water-filled flask, which cools it before entering one’s body (Figure 1). Three main characteristics explain the appeal of WTS. First, WTS is often a social event, where is a member of a peer groups pass the hose between them in turns while passing the time together. Second, WTS is popularly considered to be less unhealthy than cigarette smoking. Third, unlike cigarettes, water-pipe tobacco is flavored. Both colloquial use and advertising emphasize the wide variety of flavors (that run the gamut of fruit and candy flavors) while downplaying it being a tobacco product [12]. It has also been argued that women in traditional societies use WTS as a way to escape the taboo against women’s cigarette smoking [13].
The waterpipe is a centuries-old smoking device, arguably originating in the Middle East. It has numerous variants known as Hookah, Nargilah, Argileh, Hubbly-Bubbly, Shisha and Goza. The term “waterpipe” has come to serve in the scientific literature as an umbrella category. Although these devices are not identical, they all share a mechanical principle: in order to smoke one places burning charcoal over flavored Tobacco, usually separated by an aluminum foil, using a hose the smoke first goes through a water-filled flask, which cools it before entering one’s body (Figure 1). Three main characteristics explain the appeal of WTS. First, WTS is often a social event, where is a member of a peer groups pass the hose between them in turns while passing the time together. Second, WTS is popularly considered to be less unhealthy than cigarette smoking. Third, unlike cigarettes, water-pipe tobacco is flavored. Both colloquial use and advertising emphasize the wide variety of flavors (that run the gamut of fruit and candy flavors) while downplaying it being a tobacco product [12]. It has also been argued that women in traditional societies use WTS as a way to escape the taboo against women’s cigarette smoking [13].

Figure 1: Youth smoking a water-pipe.
In Israel, the phenomenon of WTS has seen a significant rise in the past decade. Since the practice has been common for the past 400 years throughout the Middle-east, from North-Aferica to the Arabian Peninsula upto Pakistan [13], it is not surprising that it is more popular among the Arab minority in Israel. This is also reflect amongst youth in Israel, two recent governmental reports cover the full gamut of WTS use amongst junior high [14] and high school students [15]. 10% of all teens aged 12 have experimented in WTS, whilst 5.3% of Arab student of the same age smoke it on daily basis in comparison to 0.9% amongst Jews. Within four years it grows to 12% and 3%, respectively [14]. This tendency continues, with 40% of teens aged 17-18 have experimented in WTS. When disaggregating the data into the influence ethnicity and gender, two significant gaps are revealed, boys as a rule experiment with and participate in WTS more than girls, with 49.1% of all boys participating at least once a week in WTS compared to 30.7% of all girls. When examining ethnicity, Jewish girls have slightly higher probability than their Arab counterparts of participating in WTS, 31.1% and 29.1% respectively. Amongst boys, the probability is markedly higher however there is a significant gap with a staggering 56.1% of the Arab population participating in WTS at least once a week, in comparison to 47.2% of the Jewish population. In light of the fact the Arab minority comprises 20% of the general population of Israel and accounts for 27% of all car crash related deaths [16], the present article focuses on the Arab population in Israel as a target population. Nevertheless, it is the aim of this article to pave the way for a broader assessment of the influence of participating in WTS on traffic related risks, primarily driving.
There is considerable evidence that the harms of WTS may be equal to and from certain perspectives surpass those of cigarette smoking. WTS has been associated with an elevated risk for several types of cancer [8,11,17] respiratory diseases as well as low birth weight [9]. The current study relies on this literature to examine the influence of WTS on second-order tasks, primarily focusing on driving. The mechanism behind this hypothesized influence has been presented in detail elsewhere [18]. Succinctly, it is known that chronic cigarette smoking may lead to a condition of hypoxia, in which raised levels of Carbon Monoxide (CO) interfere with blood oxygenation leading to cellular instability and harming brain function. This is manifested in a reduction in cognitive and motor skills. In the case of WTS, the intensity of this experience is much higher. Studies estimate that WTS involves inhaling between 50-150 times the amount of smoke inhaled by cigarette smokers, and that CO levels in the blood after WTS are about 5 times higher than after smoking a cigarette [17,19]. Accordingly, we hypothesize that WTS, through hypoxia, may have stronger behavioral effects than smoking on driving, and that frequent WTS users will be more vulnerable to such influences due to the degraded condition of their cells.
While it has been suggested before that WTS may be associated with traffic crashes [20], the current study is the first to test the relations between WTS and driving behavior directly. The study first attempts to identify a causal mechanism linking WTS and risky driving behavior. After presenting evidence to support this hypothesis, the study examines the relatively neglected issue of why people choose to engage in WTS [21]. For this reason a PBC model was devised, similar to those used to assess people’s choices regarding smoking cigarettes, in order to break down the factors mitigating the decision to drive after partaking in WTS.
METHODOLOGY
The study included two parts. The first being an analytical case-control experiment measuring the influence of WTS on bodily functions and on the ability to drive. This design allows for a controlled and effective introduction of variables offering more certainty when arguing for causal relationships, making it preferable to observational studies or the reliance on self-reporting [20]. Control variables included age, education, marital status, gender, and driving experience. To control for habituation to the driving simulator, both groups underwent a similar set of multiple scenarios.
The second part consisted of a closed questionnaire aimed at capturing information about the experience of WTS users, their attitudes towards it, as well as economic and socio-demographic variables identified as relevant in the health behaviors literature. Ethical approval was obtained from the RivkaZiv Medical Center in Safed, Israel, in accordance with the Helsinki declaration.
The second part consisted of a closed questionnaire aimed at capturing information about the experience of WTS users, their attitudes towards it, as well as economic and socio-demographic variables identified as relevant in the health behaviors literature. Ethical approval was obtained from the RivkaZiv Medical Center in Safed, Israel, in accordance with the Helsinki declaration.
Procedure
The research population was limited to subjects between 18 and 65 who signed the agreement form, excluding the following high-risk groups: pregnant and breastfeeding women, people suffering from Asthma, COPD, allergy to smoking, anemia, cardiac diseases, cirrhosis of the liver, chronic renal failure, and cancer. In the experimental part participants drove the training scenario and scenario 1 (pre-WTS), and were tested by the pulse oximeter before each drive. This was followed by a session of WTS. All members of the case group used the same water-pipe and smoked it for 30 minutes in the same environment. Participants were then tested using the pulse oximeter and drove scenario 2. After waiting for 30 minutes, they were tested using the pulse oximeter and drove scenario 3. We used odds ratios to estimate the effects of WTS on driving behavior, measured as number of incidents (crashes and violations). The control group was used as a reference group.
In the second part, we used the results of the WTS Health questionnaires to compare frequent and infrequent WTS users. Categorical variables were compared using Pearson’s χ2 analysis and continuous variables were analyzed using Student’s t-test. The correlation between the different variables was tested using bivariate correlation analysis. Factor analysis was used to reduce the number of variables by identifying the smallest number of sets that are highly correlated and creating a set of factors to be treated as uncorrelated variables in further analyses. Finally, a binary logit model was developed to estimate variables that affect the frequency of WTS (high/low).
In the second part, we used the results of the WTS Health questionnaires to compare frequent and infrequent WTS users. Categorical variables were compared using Pearson’s χ2 analysis and continuous variables were analyzed using Student’s t-test. The correlation between the different variables was tested using bivariate correlation analysis. Factor analysis was used to reduce the number of variables by identifying the smallest number of sets that are highly correlated and creating a set of factors to be treated as uncorrelated variables in further analyses. Finally, a binary logit model was developed to estimate variables that affect the frequency of WTS (high/low).
Participants
The study’s population (n=100) was drawn from two Arab villages in northern Israel, Bini and Deir al-Asad. The participants were aged 18-60 (Mean=31.51, SD=10.31). The sample was divided into an experimental group of water-pipe smokers (n=70) and a control group of non-water-pipe smokers (n=30) (although they could have been cigarette smokers). Members of the control group either never engaged in WTS or did so very rarely (less than once per month). It may be the case that the familial culture of the specific group under investigation – Israeli Arabs – promotes WTS. At the same time, it is necessary to avoid an orientalist view and to keep in mind that WTS has also grown significantly in Mid-Eastern societies over the past 20 years. Table 1 presents the main demographic and socio-economic characteristics for the experimental and control groups.
| Variable | Experimental Group (WTS Smokers) | Control Group (Non-WTS Smokers) |
| Mean age (SD) | 29.47 (10.4) | 36.33 (13.92) |
| Education more than 12 years (%) | 31.4 | 40 |
| Married% | 44.3 | 50 |
| Employed % | 74.2 | 60 |
| Avg. years driving (SD) | 9.7(9.11) | 14.46(12.24) |
| Avg. number of cars in the household (SD) | 5.4 (3.53) | 5.07 (1.89) |
Table 1: Sample of socioeconomic characteristics.
In this specific sample, over 75% of the participants reported that their parents never engaged in WTS at the home, compared to 12.9% who reported that their parents engage in WTS at home at least once a week. Thus, WTS cannot be explained away as part of “tradition”.
Tools
A pulse oximeter, a non-invasive device designed to measure the pulse and level of blood oxygenation was used to measure the direct influence of WTS on bodily functions. A driving simulator was used to measure the behavioral effect of WTS on driving. It included four scenarios, all of which included driving on both inter- and intra-city road: a) Training - a 5 km drive; b) Pre-WTS (scenario 1) - a 10 km drive including 10 “events” aimed to measure reaction time, for example traffic lights, cars appearing from a side road, or pedestrian crossing; c) Post-WTS Immediate (scenario 2)- a 10 km drive also with ten events in different locations; and d) Post WTS 30 Minutes (scenario 3)- a 10 km drive also with ten events in different locations.
The WTS Health questionnaire was modeled on similar questionnaires using the Theory of Planned Behavior (TPB) [22] to study various health behaviors [23]. The attitudinal questions were drawn from Ajzen & Fishbein’s 1980 [24] questionnaire devised to assess and predict attitudes and behaviors. The questions were adapted to the current topic of WTS based on the literature review and the author’s experience. It was used to gather information socio-demographic data, the extent of the respondent’s exposure to WTS, as well as variables derived from the TPB model, including: personal attitudes towards WTS, subjective norms of one’s immediate environment, and perception of Personal Behavioral Control (PBC). Similar to smoking cessation studies, PBC was conceptualized as the participant’s ability to avoid the said behavior. All items were measured on a 7-level Likert scale (1= completely disagree; 7 = strongly agree).
The WTS Health questionnaire was modeled on similar questionnaires using the Theory of Planned Behavior (TPB) [22] to study various health behaviors [23]. The attitudinal questions were drawn from Ajzen & Fishbein’s 1980 [24] questionnaire devised to assess and predict attitudes and behaviors. The questions were adapted to the current topic of WTS based on the literature review and the author’s experience. It was used to gather information socio-demographic data, the extent of the respondent’s exposure to WTS, as well as variables derived from the TPB model, including: personal attitudes towards WTS, subjective norms of one’s immediate environment, and perception of Personal Behavioral Control (PBC). Similar to smoking cessation studies, PBC was conceptualized as the participant’s ability to avoid the said behavior. All items were measured on a 7-level Likert scale (1= completely disagree; 7 = strongly agree).
Variables
Control variables in the experimental part included age, education, marital status, gender, and driving experience. The dependent variables were risky driving incidents, including self-crashes, car crashes (with another car), pedestrian crashes, times exceeding the speed limit, number of traffic light tickets, number of centerline crossings, number of shoulder crossings, time exceeding the speed limit (% of total driving time in each scenario), time not keeping within the lane (% of total driving time in each scenario), and total number of risky incidents. Independent variables included 1) WTS user/non-user; 2) Driving scenario, a categorical variable including four conditions – training and scenarios 1-3.
For the second part, control variables included age, education, marital status, and employment. The dependent variable was water-pipe smoker/nonsmoker. Independent variables were constructed as the average score on responses to specific items in the WTS Health questionnaire.
For the second part, control variables included age, education, marital status, and employment. The dependent variable was water-pipe smoker/nonsmoker. Independent variables were constructed as the average score on responses to specific items in the WTS Health questionnaire.
RESULTS
The WTS Health Questionnaire
Participants started engaging in WTS at a relatively younger age- 43% began when they were under 18, and an additional 39% began between 19 and 25 (Figure 2). This indicates that WTS became increasingly popular among Israeli Arabs mainly over the last decade. In addition, the majority of respondents reported engaging on WTS on a regular basis, rather than only during weekends (Figure 3). This suggests WTS has become a regular part of the respondents’ lifestyle.
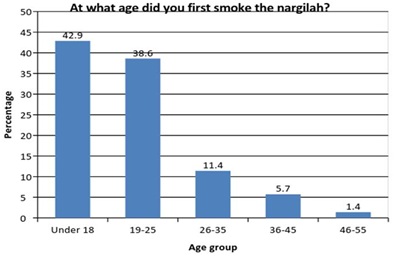
Figure 2: Distribution of participants’ age when first smoking a hookah.
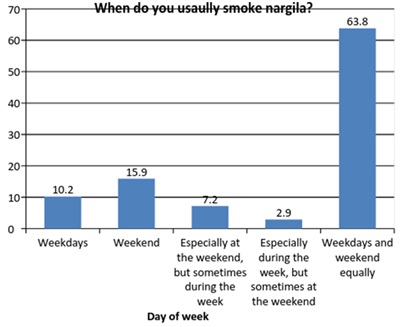
Figure 3: The day of the week on which the subject usually smoke a hookah.
Figure 4 shows the degree of agreement to the statement that prolonged smoking of a water-pipe may lead to addiction, with 7– strongly believe and 1 – completely disagrees. About half of the participants agree and strongly agrees that prolonged waterpipe smoking may lead to addiction. There is a positive correlation between the frequency of WTS and the belief that prolonged WTS may lead to its addiction, with participants who believe that prolonged smoking of a hookah may lead to its addiction being less likely to participate in WTS(p=0.061, r=0.617).
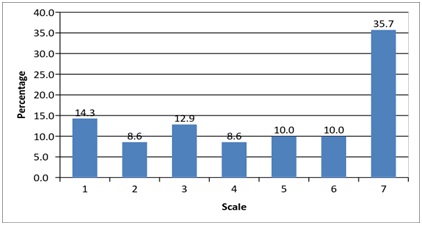
Figure 4: Distribution of the participant according their agreement to the statement that prolonged smoking of a water-pipe may lead to addiction.
All questionnaire items underwent factor analysis (principal component analysis with Varimax variation), giving rise to several clusters corresponding to the TPB model. Table 2 summarizes the results. Notably, this process generated a distinction between subjective norms relating to friends and to parents. This is consistent with recent studies suggesting that parents’ influence on WTS may be significant and separate from the influence of the peer group [25].
| Factor | Statement | Mean | S.D | Cronbach’s alpha (α) |
| Health risk perception | I believe that smoking a water-pipe may cause serious harm to health | 6.1 | 1.709 | 0.689 |
| I believe that smoking a water-pipe may injure my ability to perform mental and physical activities | 3.92 | 2.381 | ||
| I believe that a prolonged smoking of a water-pipe may injure my lungs | 6.1 | 1.775 | ||
| Personal behavioral control | I believe that even if my friends are addicted to smoking a water-pipe, I can spend time with them without smoking | 4.507 | 2.408 | 0.813 |
| It is possible for me to avoid smoking a water-pipe | 5.403 | 1.967 | ||
| If I want, I can avoid smoking a water-pipe even though everybody around me smoke | 4.656 | 2.501 | ||
| Subjective norms(friends) | Smoking a water-pipe with my friends helps me to be more popular in society | 2.104 | 1.876 | 0.811 |
| I believe that smoking a water-pipe will make me feel more relaxed and open with my friends | 2.194 | 1.69 | ||
| I believe that smoking a water-pipe will make me feel more at liberty with members of the other sex | 1.955 | 1.637 | ||
| If I smoke the water-pipe, I will have more friends | 2.642 | 2.274 | ||
| Subjective norms(parents) | Smoking a water-pipe with my family will help to become more popular in my family” | 1.621 | 1.506 | 0.691 |
| I believe that smoking a water-pipe will make me feel more relaxed and open with my family | 1.611 | 1.337 |
Table 2: Summary of the factor analysis.
Table 3 shows the estimated results of the WTS model featuring the TPB components. The model is a logistic regression in which the dependent variable has two alternatives – engaging in WTS frequently (at least every two weeks) or rarely (once a month). Participants with a higher level of Personal Behavioral Control (PBC) were significantly less likely to engage in WTS. Subjective norms relating to friends did not gain a significant impact on the frequency of WTS, while subjective norms relating to parents had a negative and significant impact on the frequency of WTS.
Table 3 shows the estimated results of the WTS model featuring the TPB components. The model is a logistic regression in which the dependent variable has two alternatives – engaging in WTS frequently (at least every two weeks) or rarely (once a month). Participants with a higher level of Personal Behavioral Control (PBC) were significantly less likely to engage in WTS. Subjective norms relating to friends did not gain a significant impact on the frequency of WTS, while subjective norms relating to parents had a negative and significant impact on the frequency of WTS.
| Variable | β | T-Statistic | Sig. | 95% C.I. for EXP(B) | ||
| Self – control (ordinal) | -0.884 | 2.135 | 0.033 | 0.931 | 0.183 | |
| Subjective norms-friends | 0.435 | 1.089 | 0.277 | 3.382 | 0.705 | |
| Subjective norms-parents [reversed] | -0.995 | 2.319 | 0.02 | 0.857 | 0.16 | |
| Health risk perception | 1.15 | 1.912 | 0.055 | 10.233 | 0.975 | |
| I believe that prolonged smoking of a water-pipe may lead to addiction to that sort of smoking (ordinal) | -1.356 | 2.07 | 0.041 | 0.949 | 0.07 | |
| Marital status (dummy, Married =1) | 2.106 | 1.663 | 0.096 | 98.247 | 0.686 | |
| Income (ordinal) | 0.133 | 0.185 | 0.853 | 4.651 | 0.28 | |
| Education (ordinal) | -3.099 | 1.989 | 0.047 | 0.956 | 0.002 | |
| Work status (dummy, salaried=1) | -1.356 | 2.136 | 0.033 | 0.681 | 0 | |
| Constant | 10.434 | 1.912 | 0.056 | |||
| -2 Log likelihood- final | 31.519 | Statistical summary | ||||
| Chi-square | 22.331 | |||||
| Sig. | 0.008 | |||||
| Cox & Snell R Square | 0.42 | |||||
| Nagelkerke R Square | 0.574 | |||||
Surprisingly, health risk perception has been shown to have a significant positive impact on the WTS frequency, with participants with elevated health risk perception more likely to engage in WTS. In contrast, concerns about addiction were instrumental in participants’ decision to avoid WTS.
In regards to the socio-economic characteristics, the estimated results show that married people are more likely to engage frequently in WTS. In contrast, people with a high education levels and are employed are less likely to engage in WTS frequently.
The Experiment
Driving behavior using the average of the measures in the three main driving scenarios (prior to WPS, immediately following WPS and half an hour subsequent to WPS) were calculated. These measures are the outcome of the driving scenarios for every participant and every scenario. Table 4 presents the means of the various driving measures for the experimental group and control groups only pre-WTS. The measures include total number of road crashes, road crashes (self crash), car accidents, pedestrian accidents, surpassing the speed limit (this measure tested the number of times the driver exceeded the speed limit), the total number of traffic light violations, centerline crossings, road shoulder crossings and speed limit violations (% time). This measure indicates the percentage of time relative to the total driving time the driver surpasses the speed limit. The final measure was for not driving within the lane (% time) which showed the percentage of time relative to the total driving time the driver drove over the center divider and the shoulder boundary. Table 4 shows that the driving measures within both groups the experimental before WPS and the control “scenario-1” are relatively similar and the differences between the measures are statistically insignificant at to a (p-value of 0.05).
| Accidents (road) | 2.13 | 1.5 | 1.95 | 1.77 | 0.542 | |
| Accident (car) | 2.61 | 2.47 | 2.86 | 2.99 | 0.381 | |
| Accident (pedestrian) | 0.75 | 1.3 | 0.91 | 1.3 | 0.982 | |
| Exceeding the speed limit | 6.75 | 8.6 | 7.22 | 10.48 | 0.228 | |
| Total number of traffic light tickets | 0.98 | 1.27 | 1.07 | 1.21 | 0.742 | |
| Centerline crossings | 4.73 | 5.87 | 6.53 | 7.03 | 0.382 | |
| Shoulder crossings | 5.09 | 6.3 | 6.72 | 7.65 | 0.327 | |
| Exceeding the speed limit (% time) | 9.27 | 10.09 | 10.75 | 13.38 | 0.128 | |
| Not being in within the lane (% time) | 6.01 | 6.38 | 6.67 | 7.22 | 0.539 |
Table 4: Mean of the various driving measures for the experimental group and control groups pre-WTS.
While immediately after WPS and half an hour after smoking all the driving measures were higher within the experimental group than the control group, which meaning more crashes, more violation and more risky driving [18].
The pre-WTS condition was used in order to control the socioeconomic characteristics, amongst which were age (experiment group 29.5 and control 36.33), and driving experience (9.7 and 14.5 respectively).
It is important to note that comparing means is not sufficient in examining the significance of the changes in driving behavior, since during the driving process, the participants - both those who smoke a hookah and those who do not, generate an experience. Therefore, to provide a control for the drivers’ driving experience, the odds ratio test is used.
Table 5 demonstrates that the influence of WTS on WTS users increased the risk of a crash by approximately 30% in the immediate condition (p=0.05; CI=1.008, 1,776). Even 30 minutes after engaging in WTS, WTS users still had a significantly higher risk of being involved in a crash - 28% more than non-WTS users (p=0.1, CI=0.961, 1.705). WTS users were also exposed to a higher risk of crossing centerlines (OR=1.306, p=0.05, CI=1.016, 1.679) and spent more time outside their lane (OR=1.329, p=0.05, CI=1.025, 1.772).
| Variable | Scenario 1 - Scenario 2 | Scenario 2 - Scenario 3 | ||||
| Odds Ratio | 95% Confidence Interval | Odds Ratio | 95% Confidence Interval | |||
| Lower | Upper | Lower | Upper | |||
| Accidents | 1.333** | 1.01 | 1.78 | 1.28* | 0.96 | 1.71 |
| Accidents (road) | 1.23 | 0.71 | 2.11 | 1.32 | 0.66 | 2.63 |
| Accident (car) | 1.35 | 0.91 | 2 | 1.29 | 0.88 | 1.88 |
| Accident (pedestrian) | 1.29 | 0.63 | 2.62 | 1.2 | 0.61 | 2.35 |
| Exceeding the speed limit | 0.91 | 0.74 | 1.11 | 0.96 | 0.79 | 1.18 |
| Total number of traffic light tickets | 1.65 | 0.91 | 3.02 | 1.5 | 0.73 | 3.08 |
| Centerline crossings | 0.94 | 0.75 | 1.19 | 1.306** | 1.02 | 1.68 |
| Shoulder crossings | 0.87 | 0.68 | 1.11 | 1 | 0.76 | 1.32 |
| Exceeding the speed limit (% time) | 0.85 | 0.72 | 1.01 | 1 | 0.83 | 1.19 |
| Not being in within the lane (% time) | 0.95 | 0.76 | 1.19 | 1.329** | 1.03 | 1.72 |
Table 5: Summary of the odds ratio test results.
Table 6 provides the results of the physiological indicators, i.e. pulse and blood oxygenation (saturation). There were no significant differences between the groups in the pre-WTS condition but, again, WTS users were much more influenced by WTS than non-users in the following conditions, manifested in significantly higher pulse and levels of saturation compared to the pre-WTS condition. The direction of change was similar for the control group, but the results were not statistically significant. These findings support the hypothesis that the reduction in driving ability is due to hypoxia.
Table 6 provides the results of the physiological indicators, i.e. pulse and blood oxygenation (saturation). There were no significant differences between the groups in the pre-WTS condition but, again, WTS users were much more influenced by WTS than non-users in the following conditions, manifested in significantly higher pulse and levels of saturation compared to the pre-WTS condition. The direction of change was similar for the control group, but the results were not statistically significant. These findings support the hypothesis that the reduction in driving ability is due to hypoxia.
| Sample | Scenario Pairs | T Statistic | Sig. (2-Tailed) | Confidence Interval of Paired Differences (95%) | Mean | Std. Deviation |
| Control group | Pulse 1- pulse 2 | 2.36 | 0.03 | 0.21, - 2.99 | 1.6 | 3.71 |
| Saturation 1 – saturation 2 | -0.57 | 0.57 | -0.31, -0.17 | -.07 | 0.64 | |
| Pulse 1- pulse 3 | 1.97 | 0.07 | -0.31, 5.64 | 2.67 | 4.68 | |
| Saturation 1 – saturation 3 | -0.56 | 0.59 | -0.41, 0.24 | -.08 | 0.51 | |
| Experimental group | Pulse 1- Pulse 2 | −11.84 | 0 | -17.14, -12.2 | -14.67 | 10.29 |
| Saturation 1 – Saturation 2 | 3.02 | 0 | 0.2, 0.96 | 0.58 | 1.59 | |
| Pulse 1- Pulse 3 | −5.54 | 0 | -10.11, -4.73 | -7.42 | 9.46 | |
| Saturation 1 – Saturation 3 | 3.01 | 0 | 0.16, 0.8 | 0.48 | 1.13 |
Table 6: Mean differences between the three scenarios.
Discussion and Conclusion
The results of the experimental part suggest that WTS users are at a higher risk for crashes and violations even before engaging in WTS directly (i.e., before the session), particularly due to driving outside their lane. The physiological indicators are in line with those identified with hypoxia in terms of blood saturation and pulse rates. These results support the study’s initial hypothesis: WTS creates a condition of hypoxia, thus harming motor and cognitive abilities and leading to reduced driving ability. Even if one is to dispute this physiological mechanism [18] the finding that WTS can be temporally linked to a greater driving risk still must be accounted for.
Previous studies of WTS behavior have applied Ajzen’s Theory of Reasoned Action (TRA), which examines attitudes and subjective norms [2,21]. In contrast, the current study used the TPB model, which is a later variant of the TRA model including the PBC component. The advantage of PBC is that it may suggest that if one feels unable to avoid WTS one is more likely to engage in WTS. This finding has both practical and theoretical implications. The TPB model distinguishes between one’s perceived ability to carry out a certain task and one’s actual ability to do so, assuming that experience reduces the gap between these components [22]. However, in this case, unlike drunk driving, it was found that WTS has greater influence on experienced users. Thus, paradoxically, experience increases the risk represented by a certain behavior rather than vice versa. This finding demonstrates the complex relations between psychological and physiological conditions, suggesting that health behavior models should be adjusted to account for the particularities of specific behaviors and their conditions. At the policy level, awareness campaigns should be designed in a way as to stress this finding, since it is only reasonable to assume that experienced users are likely to believe that their experience serves as a buffer from risk.
The study had several limitations. First, the water-pipe session was limited to 30 minutes, even though it can last as long as an hour [17]. This suggests that our results consist of a minimal threshold, leaving open the question of just how much more influence would a longer session have. Second, the study population all came from the same cultural background. Similarly, to other health behaviors, WTS has been shown to have a strong cultural component [25]. This can be read as strength of the current design, as it rules out the confounding influence of cross-cultural differences. At the same time however, the nature of the relations between WTS and culture is left unexplored. The role of cultural factors mediating the manifest influence of psychoactive substances, as such alcohol, is well established and should serve as a motivator for exploring the same in regards to WTS [26]. Thus, researchers should be wary of quick generalizations and future studies should include cross-cultural comparisons. Finally, the sample used here was not very large and was mostly male (89% of WTS smokers and 77% of non-smokers). Larger and more gender-equal samples would have strengthened the validity of the results.
As the social nature of WTS is considered to be one of its main attractions, it is possible that the tendency to engage in WTS reflects a tendency to engage in other activities susceptible to peer pressure, such as the consumption of alcohol. However, in the current sample 81% of WTS smokers reported they did not drink alcohol; thus, a link between WTS and alcohol consumption seems highly unlikely. Thus, it seems that each health behavior must be examined on its own terms.
From a broader view, the current study joins the ongoing theoretical discussion within the field of traffic safety regarding the conceptualization of traffic accidents. Historically, traffic accidents were perceived as either the fault of unsafe drivers (known as the “nut behind the wheel” narrative) or as a chance event, often termed “an act of god” [27]. Different experts, most notably from the public health field, have been disputing this perception, suggesting that accidents were the result of a complex interaction of multiple factors and therefore were not truly “accidental”; in order to stress this, they suggest replacing the term “accident”, which implies an element of chance, with “crash”, which provides a more neutral description of the event [28-29]. The current study provides a causal mechanism demonstrating how a seemingly un-related behavior such as WTS contributes to shaping driving behaviors. Understanding the mechanisms underlying them is a necessary step on the road to transforming traffic accidents - currently the 9thleading global cause of death [30] - to calculable, amenable traffic crashes, the target of informed and effective traffic policies.
Given the current empirical demonstration, showing that the health implications of WTS go beyond direct bodily influences and include second-order effects such as risky driving, it is clearly necessary to raise awareness to what many consider a rising global epidemic [10,16]. The finding that frequent WTS users are more sensitive to its influences is especially significant, as it stands to reason that people believe that their ability to control a certain effect grows with experience.
In addition, Personal Behavioral Control (PBC), overlooked by previous models [2,21], should be included in future research. Moreover, policymakers and educators who wish to conduct more effective campaigns should target PBC directly.
REFERENCES
- Grekin ER, Ayna D (2008) Argileh use among college students in the United States: an emerging trend. J Stud Alcohol Drugs 69: 472-475.
- Noonan D, Kulbok PA (2012) Beliefs and Norms Associated with Smoking Tobacco Using a Waterpipe among College Students. J Addict Nurs 23: 123-128.
- Jawad M, Abass J, Hariri A, Rajasooriar KG, Salmasi H, et al. (2013) Waterpipe Smoking: Prevalence and Attitudes among Medical Students in London. Int J Tuberc Lung Dis 17: 137-140.
- Palamar JJ, Zhou S, Sherman S, Weitzman M (2014) Hookah use among U.S. high school seniors. Pediatrics 134: 227-234.
- Pärna K, Usin J, Ringmets I (2008) Cigarette and waterpipe smoking among adolescents in Estonia: HBSC survey results, 1994-2006. BMC Public Health 8: 392.
- Rastam S, Ward KD, Eissenberg T, Maziak W (2004) Estimating the beginning of the waterpipe epidemic in Syria. BMC Public Health 4: 32.
- Maziak W, Ward KD, Afifi Soweid RA, Eissenberg T (2004) Tobacco smoking using a waterpipe: a re-emerging strain in a global epidemic. Tob Control 13: 327-333.
- American Lung Association (2007) An Emerging Deadly Trend: Waterpipe Tobacco Use. American Lung Association, Washington DC, USA.
- WHO (2005) TobReg - Advisory Note Waterpipe Tobacco Smoking: Health Effects, Research Needs and Recommended Actions by Regulators. World Health Organization, Geneva, Switzerland.
- Akl EA, Gaddam S, Gunukula SK, Honeine R, Jaoude PA, et al. (2010) The effects of waterpipe tobacco smoking on health outcomes: a systematic review. Int J Epidemiol 39: 834-857.
- Maziak W (2011) The global epidemic of waterpipe smoking. Addict Behav 36: 1-5.
- Primack BA, Rice KR, Shensa A, Carroll MV, DePenna EJ, et al. (2012) U.S. Hookah Tobacco Smoking Establishments Advertised on the Internet. Am J Prev Med 42: 150-156.
- Asfar T, Ward KD, Eissenberg T, Maziak W (2005) Comparison of patterns of use, beliefs, and attitudes related to waterpipe between beginning and established smokers. BMC Public Health 5: 19.
- The Knesset Research and Data Center (2012) Waterpipe Tobacco Smoking Amongst Teens.
- Ministry of Health ( 2015) The Minister of Health Report on Smoking in Israel in 2015. Ministry of Health, Israel.
- Central Bureau of Statistics (2015) Accidents with injuries in 2015, Part I: General Summaries. Central Bureau of Statistics, The National Road Safety Authority, Israel.
- Cobb C, Ward KD, Maziak W, Shihadeh AL, Eissenberg T (2010) Waterpipe tobacco smoking: an emerging health crisis in the United States. Am J Health Behav 34: 275-285.
- Elias W, Assy N, Elias I, Toledo T, Yassin M, et al. (2012) The detrimental danger of Water-Pipe (Hookah) transcends the hazardous consequences of general health to the driving behavior. J Transl Med 10: 126.
- Eissenberg T, Shihadeh A (2009) Waterpipe tobacco and cigarette smoking: direct comparison of toxicant exposure. Am J Prev Med 37: 518-523.
- Saadat S, Karbakhsh M (2010) Association of waterpipe smoking and road traffic crashes. BMC Public Health 10: 639.
- Noonan D, Kulbok P, Yan G. (2011) Intention to smoke tobacco using a waterpipe among students in a southeastern US College. Public Health Nurs 28: 494-502.
- Icek A (1991) The Theory of Planned Behavior. Organizational Behavior and Human Decision Processes 50: 179-211.
- Godin G, Kok G (1996) The theory of planned behavior: a review of its applications to health-related behaviors. Am J Health Promot 11: 87-98.
- Ajzen I, Fishbein M (1980) Understanding attitudes and predicting social behavior. Englewood Cliffs, NJ: Prentice-Hall.
- target="_blank"Afifi R, Khalil J, Fouad F, Hammal F, Jarallah Y, et al. (2013) Social norms and attitudes linked to waterpipe use in the Eastern Mediterranean Region. Soc Sci Med 98: 125-134.
- Craig MacAndrew, Robert B. Edgerton (1969) Drunken Comportment: A Social Explanation. Chicago: Aldine Publishing Company.
- Loimer H, Guarnieri M (1996) Accidents and acts of God: a history of the terms. Am J Public Health 86: 101-107.
- MacLennan CA (1988) From Accident to Crash: The Auto Industry and the Politics of Injury. Medical Anthropology Quarterly 2: 233-250.
- Davis RM, Pless B (2001) BMJ Bans ‘accidents’. BMJ 322: 1320-1321.
- Híjar M, Pérez-Núñez R, Inclán-Valadez C, Silveira-Rodrigues EM (2012) Road safety legislation in the Americas. Rev Panam Salud Publica 32: 70-76.
Citation: Elias W (2017) The Influence of Attitudinal Variables on the Frequency of Water-Pipe Smoking and on Driving Ability. J Addict Addictv Disord 4: 011.
Copyright: © 2017 Wafa Elias, et al. This is an open-access article distributed under the terms of the Creative Commons Attribution License, which permits unrestricted use, distribution, and reproduction in any medium, provided the original author and source are credited.
Journal Highlights
© 2026, Copyrights Herald Scholarly Open Access. All Rights Reserved!