The Processing Mechanism of HFD Induced Obese Mice by Electroacupuncture Based on UPLC-MS Metabolic Profiling
*Corresponding Author(s):
Yuancheng SiAcademy Of Acupuncture And Tuina, Guizhou University Of Traditional Chinese Medicine, Guiyang, China
Tel:+86 085188308024,
Email:siyuancheng039@gzy.edu.cn
Bo Chen
Academy Of Acupuncture And Tuina, Guizhou University Of Traditional Chinese Medicine, Guiyang, China
Tel:+86 085188308024,
Email:chenbo_med@163.com
Abstract
Background: In the development and progression of simple obesity, intestinal metabolites play a very important role.
Objectives: Though Ultra-high performance Liquid Chromatography-Mass Spectrometry (UPLC-MS) metabolic profiling method, we observe the changes of metabolites in the intestinal contents of High-Fat Diet (HFD) induced obese mice with electroacupuncture and explore its mechanisms.
Materials and methods: 10 of 60 SPF-grade C57BL/6 mice were randomly selected as the normal group (N), and the others were taken as the HFD induced obese model. 20 obese mice were divided into the model group (M) and the electroacupuncture group (EA). The EA group was pinpricked Guanyuan (CV4), Tianshu (ST25), Zushangli (ST36) and Sanyinjiao (SP6) with 30HZ and 1mA of electroacupuncture instrument parameters, 10 minutes each time, once a day. Used UPLC-MS metabolic profiling method to observe the differential metabolites in the intestinal contents, and analyze the Pearson correlation between differential metabolites and pharmacodynamic indicators.
Results: Before treatment, the body weight and Lee’s index of the M group and the EA group were significantly higher than those of the normal group, and decreased significantly after the EA intervention. The metabonomic analysis of the intestinal contents screened out 10 significantly different metabolites and 2 key metabolic pathways, which were Linoleic acid metabolism and Primary bile acid biosynthesis.
Conclusion: High-fat diet induced obese mice have disorders of intestinal metabolites. Adjusting intestinal lipid metabolism and intestinal metabolites may be one of the mechanisms of EA in the treatment of simple obesity.
Keywords
Electroacupuncture; HFD induced; Intestinal metabolites; Metabolic profiling; Obesity
Abbreviations
HFD: High-Fat Diet
UPLC-MS: Ultra-High Performance Liquid Chromatography and Mass Spectrometry
EP: Eppendorf
PCA: Principle Component Analysis
OPLS-DA: Orthogonal Artial Least-Squares-Discriminant Analysis
CE: Collision Energies
QC: Quality Control
VIP: Variable Influence on Projection
RT: Retention Time
EA: Electroacupuncture
CV4: Guanyuan
ST25: Tianshu
ST36: Zushangli
SP6: Sanyinjiao
Background
Simple obesity is a chronic metabolic disease caused by excessive accumulation or abnormal distribution of body fat [1,2]. Its formation and development are the risk factors of inducing various diseases (hypertension, diabetes, arthritis, etc.) [3,4]. It is also affected by a variety of factors, such as imbalance of intestinal flora, disorder of intestinal mucosal immune and abnormal metabolism of intestinal contents, etc. [5,6]. According to the latest WHO statistics, as of 2014, about 1.9 billion people in the world were overweight, of which 600 million reached the obesity standard [7]. The obesity situation in China is still severe, with the adult overweight rate as high as 31.5% and the obesity rate reaching 12.2% [8,9].
Acupuncture is an important part of traditional Chinese medicine, which can improve the treatment of many diseases, including obesity and other chronic metabolic diseases [10,11]. At the same time, its "simplicity, convenience, efficiency, and low cost" advantages make it promising in clinical applications [12]. The clinical acupuncture points in acupuncture method are selected as "Tianshu, Guanyuan, Zusanli" and "Sanyinjiao" points to achieve the effect of weight loss and cellulite removal [13].
Metabolic profiling is an important part of systems biology research, and it is also one of the current research hotspots in the field of omics [14]. It has the characteristics of "holistic, dynamic", and its nature of holistic, systematic and comprehensive is consistent with the "holistic, dynamic and dialectical views" of acupuncture and moxibustion research in traditional Chinese medicine. It’s a better way to explore the dynamic mechanism of acupuncture and moxibustion in traditional Chinese medicine [15]. Ultra-high Performance Liquid Chromatography and Mass Spectrometry (UPLC-MS) technology is one of the commonly used methods for studying metabolomics [16]. It is suitable for the analysis of metabolites that are difficult to volatile or have poor thermal stability. It has characteristics of high throughput, high resolution, and high sensitivity.
Objectives
At present, there are few reports on metabolic profiling research on acupuncture treatment of simple obesity. Use metabolic profiling to find the intestinal metabolism related to acupuncture treatment of simple obesity and to clarify the mechanism of acupuncture on the improvement of intestinal metabolism. Therefore, the research team explored the mechanism of electroacupuncture in the treatment of intestinal metabolites in nutritionally obese mice. The research results are now reported as follows.
Materials And Methods
Animals
C57BL/6 mice (aged 8 weeks old, half male and half male) were housed in the animal room of the Experimental Center of the School of Basic Medical Sciences, Guizhou University of Traditional Chinese Medicine, which has reached the care standard. Mice with a weight fluctuated at 19 ± 1g were safeguard at an appropriate temperature (22-25 °C) and humidity (40%–45%) on a 12–12 hr light and dark cycle, with ad libitum access to tap water and diet.
The formal experiment research was started after 1 week adaption. After that, mice were randomly allocated to normal group and the group of high-fat diet induction. Using computer random number generator to generate numbers to handle all random assignments. All mice in this study were obtained from Changsha Tianqin Biotechnology Co., Ltd, with an official license number (SCXK (Xiang) 2019-0013).
Our experiment mice were raised strictly in accordance with the National Institutes of Health Guide for the Care and Use of Laboratory Animals, especially those of the Institutional Ethics Committee of Guizhou University of Traditional Chinese Medicine (protocol no. 20210022). As for euthanasia, we use cervical dislocation, which was taken the recommendations of the Guidelines on Euthanasia of the American Veterinary Medical Association into consideration.
Establishment of high-fat diet induced mice
Obese mice were established by high-fat diet (composition: 60 kcal% fat, 20 kcal% carbohydrate, 20 kcal% protein; 5.24 kcal/g total energy content, H10060) [Certificate number: SCXK(Jing)2019-0008] from Beijing Huafukang Biotechnology Co., Ltd. [17]. 20 obesity mice were obtained after HFD for 8 weeks; their weights were 20% more than the normal group (N). Then, these obese mice were randomly divided into obesity model group (M), electroacupuncture group (EA). Eat and drink freely.
Electroacupuncture interventions
The mice in EA group accepted electrical stimulation (G6805-III, Suzhou Medical Supplies Co., Ltd., China) via vertical needling points of Tianshu (ST25) 4 mm, Guanyuan (CV4) 5 mm, Zusanli (ST36) 3 mm and Sanyinjiao (SP6) 4 mm for 10 min (from 18:00 to 20:00) with a parameter of continuous wave (CW), 1 mA and 30 Hz [18]. Such intensity was maintained just below the level that induced visible muscle contraction. EA was performed daily, alternatively at the left or right side of these points. Mice of the normal and model groups were fixed in same restrainers at 10 min without EA treatment.
Measurement of the body weight and Lee’s index
All mice were weighted per week by an electronic scale (range: 0–200 g, definition: 0.01 g) and measured body lengths weekly by a soft ruler (range:0–100 cm, definition: 0.2 cm). Then, the Lee’s index was calculated as: (Lee’s index= (weight (g) * 1000) ^ 1/3 / length (cm).
Sample preparation for metabolic profiling and UPLC-MS analysis
The contents of small intestine were sterilely collected in1.5-mL Eppendorf (EP) tubes and stored at -80°C refrigerator before intestinal metabolism analysis. After the intestine contents were unfroze on ice, 20 μL internal standard (2-chloro-l-phenylalanine in methanol, 0.3 mg/mL) was added to 25 mg of the samples, followed by grinding at 60 HZ for 2 min, ultrasonicating at ambient temperature (25 °C to 28 °C) for 10 min, storing at -20 °C for 30 min. The extract was centrifuged at 13000 rpm, 4 °C for 15 min to obtain the supernatant. The supernatants from each tube were collected using crystal syringes, filtered through 0.22 μm microfilters and transferred to UPLC vials [19]. The vials were stored at -80°C for subsequent UPLC-MS analysis.
ACQUITY UPLC I-Class system (Waters Corporation, Milford, USA) coupled with VION IMS QTOF Mass spectrometer (Waters Corporation, Milford, USA) was applied to analyze the metabolic profiling in both ESI positive and ESI negative ion modes using An ACQUITYUPLC BEH C18 column (2.1 × 100 mm, 1.7 μm) with a constant column temperature of 45 °C. After equilibration for 3 min, the column flow rate was at 0.4mL/min and the injection volume was 1 μL. Water and Acetonitrile/ Methanol 2/3(v/v), both containing 0.1% formic acid were used as mobile phases A and B, respectively. Linear gradient: 0 min, 1% B; 1min, 30% B; 2.5min, 60% B; 6.5min, 90% B; 8.5min, 100% B; 10.7 min, 100% B; 10.8 min, 1% B and 13min, 1%B [20].
A Triple TOF5600+ high-resolution tandem mass spectrometer (SCIEX California, USA) was used to analyze the eluted metabolites [21]. Data acquisition was performed in full scan mode (m/z ranges from 50 to 1000) combined with MSE mode, including 2 independent scans with different Collision Energies (CE) were alternatively acquired during the run. Parameters of mass spectrometry were as follows: a low-energy scan (CE 4 eV), and a high-energy scan (CE ramp 20-45 eV) to fragment the ions. Argon (99.999%) was used as collision-induced dissociation gas; scan rate: 0.2 s/scan; capillary voltage, 1 kV (negative mode) / 2 kV (positive mode); reference capillary voltage, 2.5 kV; cone voltage, 40 V; source offset, 60 V; source temperature, 115 °C; desolation gas temperature, 450 °C; desolation gas flow, 900 L/h, and cone gas flow, 50 L/h. Nitrogen (>99.5%) was employed as desolation and cone gas. For lock mass correction, a 250 ng/mL standard solution of leucine-enkephalin in acetonitrile/water/formic acid (50:49.9:0.1, v/v/v) was continuously infused (5 μL/min) through the reference probe and scanned every 30 s.
Data Preprocessing and UPLC-MS Analysis
UPLC/MS raw data were transformed into excel format including m/z, peak Retention Time (RT) and peak intensities, and RT–m/z pairs and processed using progenesis QI software (Waters Corporation, Milford, USA) for the following parameters [22]. Precusor tolerance was set 5 ppm, fragment tolerance was set 10 ppm, and RT tolerance was set 0.02 min. The internal standard was used for data Quality Control (QC) samples (reproducibility), which were injected at the beginning of the analysis and detected after every 7 samples to assess the stability of the UPLC/MS throughout acquisition. The resulting matrix was further reduced by removing any peaks with missing value (ion intensity = 0) in more than 50 % biological samples. Metabolites were identified by progenesis QI Software, based on public databases such as http://www.hmdb.ca/; http://www.lipidmaps.org/ and self-built databases. Principle Component Analysis (PCA) and Orthogonal Partial Least-Squares-Discriminant Analysis (OPLS-DA) were carried out to visualize the metabolic alterations among experimental groups, respectively. The correlations between the cecal compounds and bacterial profiles were evaluated with Spearman’s correlation test using R (version 3.2.1) with the vegan package [23]. Based on Variable Influence on Projection (VIP) values obtained from the OPLS- DA model and p values from a two-tailed Student’s t test on the normalized peak areas, the differential metabolites were considered as statistically significant threshold with VIP values larger than 1.0 and p values less than 0.05.
Experimental protocols
Experiment 1: Effects of EA on body weight and Lee’s index in high-fat diet induced mice: Ten of sixty mice were randomly divided in normal group, the other was fed with high-fat diet in 8 weeks to select obesity mice and divided randomly into model group and EA group, with ten mice in each group. All mice were fixed in same restrainers at 10 min per day (from 18:00 to 20:00) for 21days. Then EA group were executed during the 10 min daily for the subsequent 21 days. Body weight and Lee’s index were recorded every 7 days.
Experiment 2: Effects of EA on changes of metabolites in the intestinal contents through HPLC-MS metabolic profiling in high-fat diet induced mice: Experiment 2 was to research effects of metabolites in the intestinal contents through HPLC-MS metabolic profiling in high-fat diet induced mice. A total of 30 mice were used in Experiment 2, including group Normal, model, EA, with ten mice each group. EA group was executed for 21days and 10 min daily. After that, all rats got a 24 hr fast with free access to water. Then mice were anesthetized, the content samples of small intestine were sterilely collected in1.5-mL EP tubes and stored at -80°C refrigerator to analyze intestinal metabolisms by HPLC-MS metabolic profiling.
Statistical analysis
The results were statistically analyzed using IBM SPSS statistical software for Windows (V22.0; SPSS Inc., Chicago, IL). Data were indicated as Means ± Standard Deviation. Data were analyzed with one-way ANOVA. Differences between the groups were evaluated using Student–Newman–Keuls. Graphs were performed using Graph Pad Prism 5 (GraphPad, La Jolle, California, USA) software. Data were considered significantly different with each value of * p < 0.05, ** p < 0.01, *** p < 0.001.
Results
EA decrease body weight and Lee’s index in high-fat diet induced mice
As described previously, high-fat diet induced mice displayed to gain body weight and increase Lee’s index [8]. Body weight and Lee’s index in model group were significantly increased than normal group (p < 0.01). After the intervention of EA, compared with the model group, the body weight and Lee’s index of the EA group decreased significantly (p < 0.01) (Figure 1).
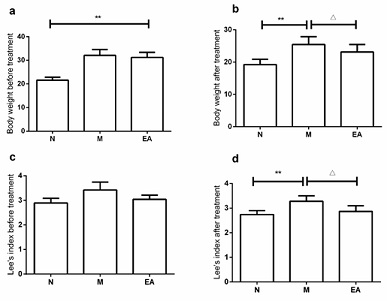 Figure 1: Fundamental Parameters of FHD-Induced Obesity by EA.
The body weight (a-b) and Lee’s index (c-d) in experiment period were measured. Data was expressed as mean ± SD, n=10. ** p < 0.01, compared to the N group; Δ p < 0.05, compared to the N group.
Stability verification of metabolomics analysis method
The base peak diagrams of the total particle flow of the intestinal contents of the experimental mouse (QC sample after uniform mixing) in the positive particle mode (Figure 2a) and negative ion mode (Figure 2b) are shown in Figure 2. It could be seen that the positive particle mode and the negative ion mode, and the samples were superimposed at least 6 times to show that the system of the detection instrument is stable, and its accuracy and reproducibility are good. The PCA model diagram (Figure 2c) obtained from the QC sample data after 7 cycles of cross-validation shows that the QC samples were tightly clustered; through the analysis of the metabolite intensity of the QC samples, a box diagram (Figure 2d) was drawn to show this During the experiment, the instrument has good detection stability and is suitable for application to detect the metabolic difference of intestinal contents.
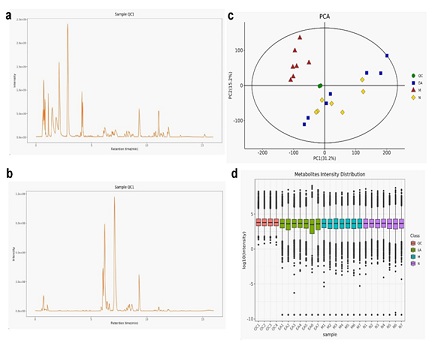 Figure 2: QC sample superimposed base peak diagram of total ion current.
a: Base peak graph in positive ion mode; b: Base peak graph in negative ion mode; c: principal component analysis graph; d: metabolite intensity distribution evaluation graph, n=7.
Metabolic profiling analysis of intestinal contents samples of each group
Used the data processing software Progenesis QI v2.3 to perform qualitative and relative quantitative analysis of the original data, perform standardized preprocessing of the original data, and perform multivariate statistical analysis [24]. The PCA of metabolites showed that the data of the normal group, model group and EA group were well separated, and the degree of aggregation within the group was higher (Figure 3a), indicating that the intestinal contents of each group of experimental mice Significant changes have occurred in the endogenous metabolites; the OPLS-DA score chart (Figure 3b) shows that R2 = 0.233, Q2 = -1.074, indicating that the OPLS-DA model was successfully established. The separation trend of metabolites in the contents is better.
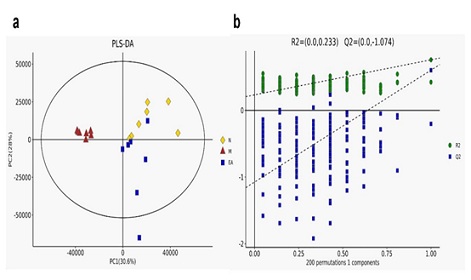 Figure 3: Orthogonal Partial Least Square Discriminant Analysis (OPLS-DA) score chart based on UPLC-MS analysis data of content samples.
Each point used three colors (yellow, normal group; red, model group; blue, EA group) to represent different samples. The OPLS-DA scores of the 3 groups were fitted and predicted performance (2 latent variables, R2 = 0.233, Q2 = -1.074).
Screening of differential metabolites in intestinal contents samples of each group
According to the criteria of VIP > 9 and p < 0.05, 10 differential metabolites were screened in the lipid metabolites of exosomes (Table 1), including fatty acid esters, glycerides and their derivatives.
|
No. |
Metabolites |
m/z |
RT (min) |
VIP |
p |
Compound ID |
Formula |
|
1 |
1,3,12-Trihydroxycholan-24-oic acid |
815.567 |
9.322 |
23.684 |
0.0167 |
HMDB0000371 |
C24H40O5 |
|
2 |
NeuAcalpha2-3Galbeta-Cer(d18:1/16:0) |
991.667 |
11.076 |
21.458 |
0.001 |
56047 |
C51H94N2O16 |
|
3 |
3alpha-Hydroxy-5beta-chola-7,9(11)-dien-24-oic Acid |
373.273 |
9.307 |
18.196 |
0.016 |
LMST04010330 |
C24H36O3 |
|
4 |
1-heptadecanoyl-sn-glycero-3-phosphocholine |
510.355 |
11.482 |
14.352 |
0.003 |
24068 |
C25H52NO7P |
|
5 |
2beta,3beta-Dihydroxy-6-oxo-5alpha-cholan-24-oic Acid |
811.536 |
8.386 |
12.347 |
0.003 |
LMST04010172 |
C24H38O5 |
|
6 |
3alpha,12beta-Dihydroxy-5beta-chola-7,9(11)-dien-24-oic Acid |
389.268 |
8.392 |
11.828 |
0.002 |
LMST04010401 |
C24H36O4 |
|
7 |
2-oleoyl-sn-glycero-3-phosphocholine |
544.339 |
10.799 |
10.338 |
0.015 |
HMDB0062651 |
C26H52NO7P |
|
8 |
Leurosine |
826.439 |
7.084 |
10.119 |
<0.001 |
67526 |
C46H56N4O9 |
|
9 |
3alpha-Hydroxy-6-oxo-5beta-cholan-24-oic Acid |
391.284 |
8.443 |
9.785 |
0.011 |
LMST04010146 |
C24H38O4 |
|
10 |
Cholic acid |
426.321 |
9.307 |
9.571 |
0.025 |
HMDB0000619 |
C24H40O5 |
Table1: Potential biomarkers in each group of intestinal contents samples.
Note: VIP: the importance of variables in the projection value of the OPLS-DA model. VIP > 9, p < 0.05.
Effect of electroacupuncture on the differential metabolites of intestinal contents samples
According to the different biomarkers, further analyze the intervention mechanism of EA. Figure 4a was the principal component analysis of the intestinal metabolites of each group of experimental rats, indicating that the differences in the intestinal contents of each group of experimental rats have been separated; the VIP values of the expression levels in the first 50 significantly different metabolites were drawn Hierarchical clustering heat map in figure 4b. The color from blue to red indicated the expression abundance of metabolites from low to high [25]. According to figure 4c, there were significant differences in metabolite enrichment between the three groups. Primary bile acid biosynthesis and glycerophospholipid metabolism were the main metabolic pathways of HFD-induced obesity, and they are also one of the only targets for EA.
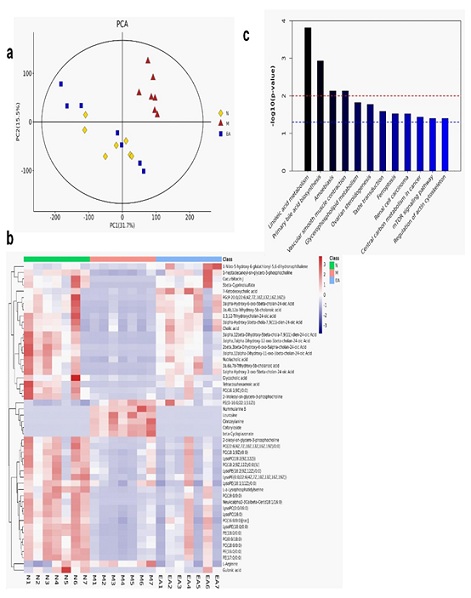 Figure 4: Multivariate analysis of UPLC-MS data in the metabolism of intestinal contents in each group of experimental mice.
a: Principal component analysis diagram of intestinal metabolites; b: hierarchical clustering of the first 50 significantly different metabolites; c: enrichment diagram of metabolic pathways of significantly different metabolites (p<0.05); n=7.
Discussion
In this study, a high-fat diet induced method was used to establish nutritional obesity. In the theoretical system of acupuncture meridian, acupuncture points of Tianshu (ST25), Guanyuan (CV4), Zusanli (ST36) and Sanyinjiao (SP6) can contribute to weight loss and cellulite reduction [12,13].
In recent years, the available disease data show that in the study of intestinal metabolomics, the metabolic pathways and metabolic phenotypes of obesity in human and animal models have changed [26,27]. In our research, the research group used HPLC-MS technology and multivariate statistical analysis methods [28] to analyze and compare the biological metabolites of the intestinal contents of each group of experimental mice, and found 10 biomarkers that are compatible with electroacupuncture for the treatment of nutritional obesity, such as 1,3,12-Trihydroxycholan-24-oic acid, NeuAcalpha2-3Galbeta-Cer(d18:1/16:0), 3alpha-Hydroxy-5beta-chola-7,9(11)-dien-24-oic Acid, 1-heptadecanoyl-sn-glycero-3-phosphocholine, 2beta,3beta-Dihydroxy-6-oxo-5alpha-cholan-24-oic Acid, 3alpha,12beta-Dihydroxy-5beta-chola-7,9(11)-dien-24-oic Acid, 2-oleoyl-sn-glycero-3-phosphocholine, Leurosine; 3alpha-Hydroxy-6-oxo-5beta-cholan-24-oic Acid, Cholic acid. The main pathways involved are primary bile acid biosynthesis, glycero phospholipid metabolism, and vascular smooth muscle contraction.
Cholic acid and chenodeoxycholic acid are the main bile acids in most species [29]. They played an important physiological role in promoting the absorption of vitamins and fats, as well as regulating bile acid biosynthesis and cholesterol homeostasis. L-arginine produces the metabolite of ornithine, which has been recommended as a candidate biomarker for chronic intestinal inflammation [30]. Under obesity, chronic inflammation of the intestine greatly stimulates the expression of ornithine decarboxylase in many cell types, thereby exacerbating the development of obesity [31]. The changes in the three groups were significantly different, indicating that electroacupuncture may regulate the metabolism of glycerophospholipids to reduce the development of obesity.
Therefore, in this study, the UPLC-MS-based non-targeted metabolic profiling method was used to identify the mechanism of electroacupuncture in the treatment of nutritionally obese mice, and 10 significant biomarkers were found, including fatty acylcholine and phosphatidylethanolamine , Bile acid, etc., involving metabolic pathways in primary bile acid biosynthesis, glycerophospholipid metabolism, and vascular smooth muscle contraction. The most obvious difference is the abnormal intestinal lipid metabolism, which is an important factor in the formation and development of simple obesity and one of the important targets of electroacupuncture treatment.
Conclusion
In summary, disorders of intestinal metabolites may be another pathogenesis of nutritional obesity. Therefore, disorders of markers of metabolites in intestinal contents can alleviate obesity and EA has advantage to high-fat induced obese. The possible mechanisms of EA may regulate 10 significant biomarkers of intestinal metabolites. The research team will continue to further explore the mechanism of EA to adjust intestinal metabolism.
Acknowledgment
The authors really appreciate the help of people from Guizhou University of Traditional Chinese Medicine. This investigation was supported by the National Natural Science Foundation of China (Grant no. 81860775), Science and Technology Fund Project of Guizhou Provincial Health and Family Planning Commission (No. gzwkj2022-005), Natural Science Foundation of Guizhou Province (No.Qianke Foundation-ZK(2022) General 484). The funding body did not participate in study design and data extraction.
Author’s Contribution
Chen-chen Ren: Conceptualization (equal). Erwei Zhang: Data curation (equal). Zhaoxia Kang: Data curation (equal). Yuan-cheng Si: writing – review and editing (equal). Bo Chen: Methodology (supporting); resources (equal).
Conflicts of Interests
The authors declare that they have no conflicts of interest.
Data Availability
The datasets used and analyzed during the current study are available from the corresponding author upon reasonable request.
Ethics Statement
The study received ethics approval from the ethical committee of Guizhou University of Traditional Chinese Medicine (No. 20210022) (Guiyang, China).
Consent for Publication
All authors consent to publish this study in Iranian Journal of Biotechnology.
References
- Koliaki C, Liatis S, Kokkinos A (2019) Obesity and cardiovascular disease: revisiting an old relationship. Metabolism 92: 98-107.
- Rivera HM, Kievit P, Kirigiti MA, Bauman LA, Baquero K, et al. (2015) Maternal high-fat diet and obesity impact palatable food intake and dopamine signaling in nonhuman primate offspring. Obesity (Silver Spring) 23: 2157-2164.
- Clemente JC, Ursell LK, Parfrey LW, Knight R (2012) The impact of the gut microbiota on human health: an integrative view. Cell 148: 1258-1270.
- Sommer F, Bäckhed F (2013) The gut microbiota—masters of host development and physiology. Nat Rev Microbiol 11: 227-238.
- Piché ME, Tchernof A, Després JP (2020) Obesity Phenotypes, Diabetes, and Cardiovascular Diseases. Circ Res 126: 1477-1500.
- Chao AM, Wadden TA, Berkowitz RI, Quigley K, Silvestry F (2020) The risk of cardiovascular complications with current obesity drugs. Expert Opin Drug Saf 19: 1095-1104.
- Kobyliak N, Virchenko O, Falalyeyeva T (2016) Pathophysiological role of host microbiota in the development of obesity. Nutr J 15: 43.
- Si YC, Miao WN, He JY, Chen L, Wang Y, et al. (2018) Regulating Gut Flora Dysbiosis in Obese Mice by Electroacupuncture. Am J Chin Med 46: 1-17.
- Tanaka M, Toldi J, Vecsei L (2020) Exploring the etiological links behind neurodegenerative diseases: inflammatory cytokines and bioactive kynurenines. Int J Mol Sci 21: 2431.
- Fang S, Wang M, Zheng Y, Zhou S, Ji G (2017) Acupuncture and Lifestyle Modification Treatment for Obesity: A Meta-Analysis. Am J Chin Med 45: 239-254.
- Yuan M, Li Y, Wang Y, Zhang N, Hu X, et al. (2016) Electroacupuncture at ST37 enhances jejunal motility via excitation of the parasympathetic system in rats and mice. Evid Based Complement Alternat Med 2016: 3840230.
- Gao T, Ma D, Chen S, Zhang X, Han Y, et al. (2021) Acupuncture for the treatment of leptin resistance in obesity: A protocol for systematic review and meta-analysis. Medicine (Baltimore) 100: 26244.
- Si YC, Ren CC, Chen B, Li QQ, Ding WJ (2021) Regulation of the intestinal dysbiosis of high–fat diet obese mice via gut microbia–TLR2/4 pathway by electroacupuncture. Rom Biotechnol Lett 26: 1355-1365.
- Zeng M (2010) Metabolomics research based on QMS and its application in childhood obesity and type 2 diabetes. Changsha: Zhong Nan University 2010: 78-85.
- An Y (2013) Study on the Change Law of Metabolome in the Process of Obesity in Rats. Beijing: Chinese Academy of Sciences University 2013: 65-68.
- Men L, Pi Z, Zhou Y, Wei M, Liu Y, et al. (2017) Urine metabolomics of high-fat diet induced obesity using UHPLC-Q-TOF-MS. J Pharm Biomed Anal 132: 258-266.
- King AM, Mullin LG, Wilson LD, Coen M, Rainville PD, et al. (2019) Development of a rapid profiling method for the analysis of polar analytes in urine using HILIC–MS and ion mobility enabled HILIC–MS. Metabolomics 15: 17-28.
- Guo Y (2021) Experimental Acupuncture. Beijing: China Traditional Chinese Medicine Press 2021: 107-125.
- Zhang A, Dou SSH, Sun W, Wu X, Wang P, et al. (2013) Metabolomics study on the hepatoprotective effect of scoparone using ultra-performance liquid chromatography/ electrospray ionization quadruple time-of-flight mass spectrometry. Analyst 138: 353-361.
- Wishart DS (2019) Metabolomics for investigating physiological and pathophysiological processes. Physiol Rev 99: 1819-1875.
- Zhong YM, Luo XC, Chen Y, Lai DL, Lu WT, et al. (2020) Acupuncture versus sham acupuncture for simple obesity: a systematic review and meta-analysis. Postgrad Med J 96: 221-227.
- Zhang P, Yu Y, Qin Y, Zhou Y, Tang R, et al. (2019) Alterations to the microbiota-colon-brain axis in high-fat-diet-induced obese mice compared to diet-resistant mice. J Nutr Biochem 65: 54-65.
- Zawada A, Rychter AM, Ratajczak AE, Masian AL, Dobrowolska A, et al. (2020) Does gut-microbiome interaction protect against obesity and obesity-associated metabolic disorders. Microorganisms 9: 18.
- King AM, Mullin LG, Wilson D, Coe M, Rainville PD, et al. (2019) Development of a rapid profiling method for the analysis of polar analytes in urine using HILIC-MS and ion mobility enabled HILIC-MS. Metabolomics 15: 17.
- Polis B, Samson AO (2020) Role of the metabolism of branched-chain amino acids in the development of Alzheimer's disease and other metabolic disorders. Neural Regen Res 15: 1460-1470.
- Takashina C, Tsujino I, Watanabe T, Sakaue S, Ikeda D, et al. (2016) Associations among the plasma amino acid profile, obesity, and glucose metabolism in Japanese adults with normal glucose tolerance. Nutr Metab (Lond) 13: 1-10.
- Socha E, Koba M, Piotr K (2019) Amino acid profiling as a method of discovering biomarkers for diagnosis of neurodegenerative diseases. Amino Acids 51: 367-371.
- Fei N, Zhao L (2013) An opportunistic pathogen isolated from the gut of an obese human causes obesity in germfree mice. ISME J 7: 880-884.
- Dimitrios A, Koutoukidis DA, Jebb SA, Otunla A, Henry JA, et al. (2022) The association of weight loss with changes in the gut microbiota diversity, composition, and intestinal permeability: a systematic review and meta-analysis. Gut Microbes 14:
- Qin J, Li R, Raes J, Arumugam M, Burgdorf KS, et al. (2010) A human gut microbial gene catalogue established by metagenomic sequencing. Nature 464: 59-65.
- Grigor’eva IN (2021) Gallstone disease, obesity and the firmicutes/bacteroidetes ratio as a possible biomarker of gut dysbiosis. J Pers Med 11: 13.
Citation: Si Y, Ren C, Zhang E, Kang Z, Chen B (2022) The Processing Mechanism of HFD Induced Obese Mice by Electroacupuncture Based on UPLC-MS Metabolic Profiling. J Altern Complement Integr Med 8: 252.
Copyright: © 2022 Yuancheng Si, et al. This is an open-access article distributed under the terms of the Creative Commons Attribution License, which permits unrestricted use, distribution, and reproduction in any medium, provided the original author and source are credited.