The Role of Remote Sensing in Epidemiological Studies and the Global Pandemic Surveillance
*Corresponding Author(s):
Dukiya JJCentre For Disaster Risk Management And Development Studies, Federal University Of Technology, Minna, Nigeria
Tel:+234(0)7035862582,
Email:duksat2000@futminna.edu.ng
Abstract
The fulfillment of the attribute of man as homosapience has brought about the in-depth probing of the spheres that is boomeranging in all phases of life in the form of Appolo-11, HIV/AID and even the Wet-market-SARSCoV-2. Disaster or pandemic in all its forms that are ravaging the present generation is also complicating the challenges facing the epidemiologist and geospatial scientist thereby favoring the emergence of new diseases and the re-emergence of old endemics. The present day occurrences of new viruses as in the case of visceral leishmaniasis are not unconnected to genetic engineering and synthetic food items. But timely information and early warning systems through remote sensing applications and artificial intelligent can help to identify and map the potential habitats of parasites and disease vectors; monitor and predict alterations in vector and parasite populations. This paper carried out an over view of the projects of remote sensing application in animal disease surveillance to re-establish the fact that; remote sensing and GIS with its real-time and repetitive ability is operational in animal disease control, forecasting and surveillance with multi-sensor Satellites in the outer space.
Keywords
Animal diseases; Epidemic; Geospatial; Satellite; Sensors; Surveillance
Introduction
It is a fact that the world demands healthier animals and animal products produced in an “environmentally safe, clean and in an ethical” way. This imposes new challenges for animal scientists whose primary concern is to improve livestock productivity [1]. Increasing understanding and transfer of technologies in animal nutrition, animal reproduction (breeding) and animal health, is critically important on a global scale for food security, poverty alleviation and environment protection. Nuclear applications are known to spearhead modern biotechnological research. For example, the most used disease monitoring technology is the Enzyme Linked Immunosorbent Assay (ELISA) that was developed through serological research using radioactive isotopes (Radioimmunoassay, Western Blot), and many still use gamma irradiated pathogens as safe antigens. Similarly, molecular diagnosis and characterization techniques were founded using radio isotopic applications. But technology diffusion and the Globalization of events have transfer the control and monitoring of diseases beyond the four walls of laboratories that now demands for multi-disciplinary and spatial approaches. Climatic change and global warming or “greenhouse effect” is now a household terminology but with major challenges on human and animal health.
Human interaction with his immediate environment has been that of “getting what I need from the land” attitude without giving a thought to what happens thereafter [2] in their study, identifies a number of key behavioral aspects involved in animal health surveillance systems and the need for applied research that has examined the interactions between resource allocation, cost-effectiveness, and behavioral considerations of actors throughout the livestock supply chain in a surveillance system context. The “natural world” is now in great conflict with the “human-managed world”, resulting in unsustainable natural resources. The present state of our ecological regions, especially in Nigeria (where there is a remarkable evidence of progressive change of the rainforest into savannah grassland), is the consequence of definitive occurrence in our socio-economic environment, which encourages depletion of these very important resources without appreciable plan for their replacement. Frequent natural and human–made fires in the tropical areas of Africa have also contributed to the reduction of natural ecological habitat, and have degraded the soils that support them, thus enhancing the rapid change in major ecological habitats. Another seemingly intractable phenomenon could be traced to rural migration resulting in urban population density explosion subsequently leading to bio-diversity. All these have combined with, and also influenced, dramatic change in the global climatic condition, leading to rapid disequilibria between the natural ecosystem and the human managed ecosystem.
At the end of 2003, the Highly Pathogenic Avian Influenza (HPAI) type A, subtype H5N1, virus (HPAI/H5N1) re-emerged in Asia, provoking an avian influenza epidemic. From Asia, it spread rapidly to Europe, the Middle-East and Africa. The rapid spread of this virus was said to be the result of uncontrolled poultry trade and infected migratory wild birds carrying the virus over long distances. Because HPAI is a major zoonosis with a mortality of more than 60% in man, a possible global pandemic influenza constitutes a grave threat with severe implications for human and animal health; serious socioeconomic impacts and the complicated political repercussions. The establishment and discoveries of the modern bacteriology, epidemiology and therapeutics led to enormous progress, improving life span and notably decreasing disease transmission and host susceptibility [3]. This progress shaped modern medicine and public health policies, reaching better nutrition and housing, safer food and water, and improving hygiene and sanitation. while we are certainly better than we ever were in terms of treatment, control and prevention of infectious diseases, the risk of spreading them also increases by changes in society, technology, and environment (natural and human-induced) Hence, in responding to the demands for help in the areas of detection, control and surveillance, remote sensing application techniques have proof operational and dependable [4, 5]. This paper is therefore aimed at re-echoing the crusade of remote sensing and GIS application in diseases surveillance, monitoring and epidemics control.
Remote Sensing Technology And Applications
Remote Sensing (RS) is imagery and map-based tools that can be used to study the distribution, dynamics, and environmental correlates of diseases, Hugh-Jones [6, 7] RS is an act of gathering digital images of the earth's surface from airborne or satellite platforms and transforming them into maps. While GIS is a data management system that organizes and displays digital map data from RS or other sources and facilitates the analysis of relationships between mapped features. The different types of resolution that are characteristic of each sensor define the information content for each scene obtained.
With this definition, the uniqueness of remote sensing technique in environmental issues like animal surveillance operation includes the following:
- • Real-time data-information collection.
- • Potential for direct Electro-transmission to receiving stations and action areas.
- • Comparatively low-cost of large area coverage.
- • Ability to operate day and night via thermal infrared and microwave sensors.
Remote sensing technique wholly depend on Electromagnetic sensors that operate within the various wave bands which ranges from the Gamma ray (0.03 micrometer) through the visible and infra-red band to the microwave band of 0.3-300centimer. The detectability of objects in the image depends on the ground resolution and, in relation to this, the image contrast, which influences the identification of details [8]. Thus in addition to spatial resolution, the spectral resolution of the image contributes to object identification and image interpretability. While the temporal resolution (revisit period) of the platform is also important for temporal spatial analysis. The band use and the type of platform together with the different payload determine application, type of target, spatial quality (resolution) and spectral resolution of the imaged product or raw data. See (Table 1) for some of the Satellite platforms and their characteristics.
|
Launched Date |
Satellite System |
Spatial Resolution XS/P (M) |
Swath (KM) |
Temporal Resolution |
Mission/Country
|
|
|
X (Km) |
||||||
|
1982 |
Landsat TM |
30 XS |
185 X 185 |
16 |
USA |
|
|
1986 |
Spot 4 |
20 XS |
60 X 60 |
26 |
France |
|
|
1991 &95 |
ERS 1 & 2 R |
12 (pixel) |
|
|
ESA |
|
|
1995 & 2003 |
Radarsat 1 & 2 R |
3-100 (Pixel) |
|
24 |
Canada |
|
|
1996 |
IRS – P5 |
6 XS |
30 X 30 |
|
India
|
|
|
2.5 P |
||||||
|
1999 |
Landsat ETM |
30 XS |
185 X 175 |
16 |
USA
|
|
|
15 P |
||||||
|
1999 |
IKONOS |
4 XS |
11 X 11 |
|
USA
|
|
|
1:00 PM |
||||||
|
2000 |
EROS |
1.8 P |
12.5 X 12.5 |
3 |
Israel |
|
|
2002 |
Spot 5 |
5 XS |
60 X 60 |
3 |
France
|
|
|
2.5 P |
||||||
|
2002 |
Quick Bird |
3.5 XS |
22 X 22 |
|
USA
|
|
|
0.6 P |
||||||
|
2002 |
Envisat R |
12 (Pixel) |
5 |
|
ESA |
|
|
2002 |
Alsat-1 |
32 |
600 X 570 |
1 |
Algeria (in DMC) |
|
|
2002 |
MSG-1 (weather) |
1 Km |
|
15 minutes |
ESA |
|
|
2003 |
NigeriaSat-1 * |
32 |
600 X 570 |
1 |
Nigeria (in DMC) |
|
(Adapted from konecny, 2002). (XS= multispectral, P=panchromatic, R=Radar)
Table 1: Sample Satellite Sensors and their Spatial Resolution
The Spectral resolution refers to the spectral range of each band in a given sensor and indicates the energy sample frequency. Since the targets display different responses in each of these spectral ranges, this information is used to identify such targets. For example, in an area of vegetation one observes a high reflectance value in the near-infrared region and a low value in the visible red band. And spatial resolution can be defined as the smallest possible area of terrain that can be individualized. While the temporal resolution indicates the time interval between two satellites passes over the same point on earth, (Figure 1 and 2) for remote sensing techniques and operation.
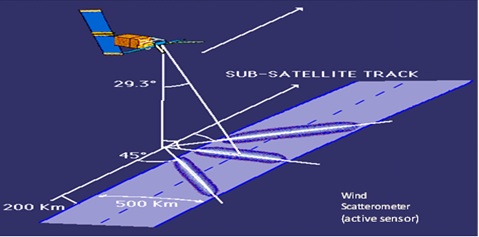 Figure 1: Satellite sensors image acquisition in its orbit
Source: Adapted from Peter Rabinowitz (2006)
 Figure 2: Inter connectivity of beacon points and Information tracking techniques.
Source: Adapted from Peter Rabinowitz (2006).
COVID-19; Virus Mutation And Genetic Engineering
SARSCoV-2 otherwise called COVID-19 emerged from Wuhan, Hubei Province of China and swiftly spread like fire throughout China and other countries around the world [9]. It was however declared by the WHO as global pandemic going by its enormity of impacts. Generally when it comes to virus mutation, coronaviruses are usually host specific: they attach to hosts with the spike protein and its particular shape normally fits only one host. The shape of the spike protein is determined by the ‘S’ gene. Therefore, the ‘S’ gene must have changed if a coronavirus jumps to a new host. This change cannot be a small set of point mutations as different animal species require quite different spike proteins. Consequently there seem to be a larger change in the ‘S’ gene in each of three cases of coronaviruses (SARS-CoV, MERS-CoV and SARS-CoV-2) that have recently jumped from an animal host to humans. Therefore there are two possible reasons for this larger change which are Recombination (a natural process) and Genetic Engineering.
One general problematic characteristic of coronaviruses is its common repeat infections, and this may be because the immune response against these viruses is not complete or it is short living. It is also possible that the spike protein changes over time so that antibodies do not give complete protection [10]. The spike protein is also the part of the virus that antibodies try to disable. This phenomenon can be noticed not only with SARS-CoV-2 but with all the three. For instance [11] revealed that camels that were given a vaccine expressing the spike protein of MERS showed antibodies and a significant reduction of excreted infectious virus. That is, they were still infectious even after being vaccinated, which means that coronaviruses activities should not be underestimated. The phylogeny flow network shows an initial emergence in Wuhan, China, in Nov-Dec 2019, followed by sustained human-to-human transmission at a global level which also shows clear genetic relationships through the transmission patterns of “A – D” as in (Figure 3).
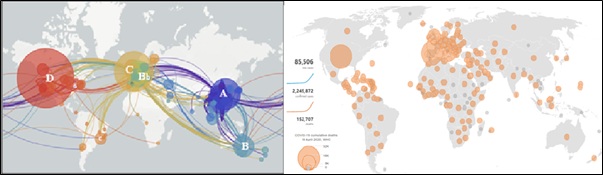 Figure 3: Global Phylogeny evolutionary of SARS-CoV-2 viruses and COVID-19 death as at April 2020,
Source: nextstrain.org, 2020.
Since 2002, three new serious human coronaviruses (SARS-CoV, MERS-CoV and SARS-CoV-2) have appeared. It is thought provoking to observe that SARS-CoV found in 2002 (called SARS) also originated in Guadong, China. SARS-CoV originates in bats and the intermediate host is likely to be a civet. Himalayan palm civet CoVs in a live-animal market in Guadong had nearly identical (99.8%) genomes to the human SARS-CoV [12]. SARS-CoV did not just arise from a civet CoV, It is either as a result of recombination events, as claims, or it was engineered. MERS-CoV that was found in 2012 was endemic in dromedary camels in East Africa and Middle East. Suggests that the original reservoir of MERS-CoV was bats, as bats are the main reservoir for many types of coronaviruses. Between 2009 and 2011, there were series of studies on bats that revealed that out of ten tested bats in Ghana only one, Nycteris bat, had 2c-beta coronavirus (i.e., of the type of MERS-CoV). One third of Nycteris bats had the virus. 14.7% of Pipistrellus bats from four European countries had 2c-beta coronavirus. Both 2c-beta coronaviruses are close to MERS-CoV. Archived serum samples from camels also revealed that the virus was already common in camels in the early 1980s in Sudan and Somalia.
Coronaviruses are RNA viruses, as is the Ebola virus, found in 1976. The phylogenetic tree drawn by [13]. so that recombination is not a major behaviour of this virus, but there has been a case of recombination in Zaire Ebola virus, described a recombinant event between two lineages between 1996 and 2001 was found to have caused a series of Ebola outbreaks between 2001 and 2003. Phylogenetic trees of traditional DNA viruses, like variola (smallpox) and the measles virus seem to be trees [14] [15].
The natural recombination explanation does not hold in the pangolin CoV: in the recombination explanation, a pangolin would have been infected with two CoV viruses, one from a bat with an S gene that does not infect humans, and the other from some other animal that has an S virus that can infect humans before the RNA of these viruses would recombine. But there seem no such other virus and assuming such will only complicate the problem further. The contending issue then is that mere random viruses mutations might not just produce enough changes to create a significantly different S gene because a virus population is very large, and this cannot be explain off genetically.
Remote Sensing Application in Disease Studies
The environmental factors most closely related to vector-borne endemics and amenable to observation from spatial platforms include: Temperature, Water, Soil Moisture, Plant cover conditions, Deforestation, Urban characteristics, Ocean color, and Topography. Satellite sensors are designed with a variety of temporal, spatial, and spectral characteristics and resolutions to provide measurements of many environmental change parameters, some for the first time. More than 90 different missions are on orbit carrying over 200 different instruments. Organisms in which changes in characteristics are known, can be measured to assess the extent of environmental contamination and its implication for human and animal health and to provide early warning of those implications [16-20, 6]. A series of outbreaks and epidemics of emerging diseases (e.g. Ebola hemorrhagic fever, hantavirus, SARS, H5N1 avian influenza), and re-emerging diseases (e.g. plague, Rift Valley fever, West Nile virus, malaria) indicate not only the impact of microbial and viral factors on public health but also the relevance of the dynamic interaction between these factors and social and environmental determinants [21]. While we are certainly better than we ever were in terms of treatment, control and prevention of infectious diseases, the risk of spreading them also increases by changes in society, technology, and environment (natural and human-induced). In recognition of these important trends, health organizations have called for the development and implementation of new disease surveillance tools (WHO, 2004). The new tools include the application of landscape epidemiology that should characterize climatic and environmental conditions of vector habitats and derive a spatial and temporal disease risk. Many of the parameters associated with environmental change and patterns of disease are now continuously sensed remotely by instruments onboard aircraft and satellites, and modeled spatially with specialized computer software.
Thus, remote sensing and Geographic Information Systems (GIS) technologies have been extensively used to describe local and landscape-level features that influence the patterns and prevalence of disease and then model the occurrence of the health event in space and time [22]. The temporal and spatial distribution of most infectious and vector-borne diseases (pathogens, vectors, zoonotic reservoirs) and their interactions with humans are influenced by a combination of environmental factors such as vegetation, temperature, landscape structure, humidity, and rainfall, [23] Most of these factors are currently measured, observed, and/or modeled with data from existing remote sensing systems [24-26].
The use of remote sensing Geographical Information System (GIS) has many applications in infectious surveillance systems because it provides to the end users the ability to respond to an epidemic threat promptly and effectively. Most bio surveillance research and development focuses on anomalies in automated news alert services (e.g., Bio Watch) and human clinical data (i.e., spikes in uses of International Classification of Disease diagnostic codes). The international community learns of outbreaks via ProMED, media tracking and official disease reports facilitated by the World Health Organization (WHO). Therefore, from the animal disease surveillance and forecasting, timely information concerning epidemic occurrences is very perspicuous. The use of communication satellite (Telecom) likes ‘palapa B2-p’ which helps in relaying message from one station to another over the world is of major benefit. These satellites operate at a much higher altitude even higher than the weather satellite, sometimes-called ‘Live Telecommunication’.
Statistical relationships often exist between mapped features and diseases in natural host or human populations. RS and GIS are most useful if disease dynamics and distributions are clearly related to mapped environmental variables. For example, if a disease is associated with certain vegetation types or physical characteristics (elevation, average precipitation), RS and GIS could identify regions where risk is relatively high. Past studies include the case of malaria in southern Mexico and in Asia [27]. Rift Valley fever in Kenya [28] Lyme disease in Illinois [29]. African trypanosomiasis, and schistosomiasis in both human and animals and livestock in the southeastern United States [30]. The spread of bluetongue and its vectors presents some of the strongest evidence to date; that climate change is driving vector-borne diseases into new regions, as warming and disease spread have occurred at the same times in the same places.
This is not the only threat to animals as can be seen from the Rift Valley fever outbreak in Kenya in 2005, where more than 150 people died and in Sudan 2007, where about 200 people died. As 75% of new human diseases in the last 25 years were of animal origin, i.e., classified as zoonotic, a “one medicine” approach to address the pressing needs of the world should now be taken further and realized. The detection and characterization of specific nucleic acids and proteins of medico- veterinary pathogens have proven invaluable for diagnostic purposes. The integration of amplification and signal detection systems including on-line real-time devices, has increased speed and sensitivity and greatly facilitated the quantification of target proteins and nucleic acids. Rugged portable real-time instruments for field use and robotic devices for processing samples are already available commercially. The Center for Health Applications of Aerospace Related Technologies (CHAART) at the NASA Ames has developed a set of web pages to evaluate sensors for health applications [31].
Since mid-1981, most studies of global or regional vegetation conditions have used data from the Advanced Very High Resolution Radiometer (AVHRR) instruments in the NOAA series of polar orbiting meteorological satellites [32,33]. Data from the AVHRR instruments that has been used for epidemiological studies includes apparent surface temperature, derived from the thermal channels. a set of remote sensing indications reveal unusual climatic conditions associated temporally and spatially with trigger points and leading edge of infectious and vector-borne diseases such as Ebola hemorrhagic fever, Rift Valley fever, and bubonic plague epidemics [34]. A few pilot studies are now underway in certain regions of New Mexico, Arizona, and Colorado (four corners states) to evaluate, validate and benchmark the use of datasets of the Moderate Resolution Imaging Spectroradiometer (MODIS) sensor aboard the Earth Observing System (EOS) Terra and Aqua Satellites, Landsat TM data, Shuttle Radar Topography Mission (SRTM), Tropical Rainfall Measuring Mission (TRMM), among other remote sensing platforms provided by NASA and NOAA.
Ebola hemorrhagic fever, named after the Ebola River in Central Africa, first appeared in June 1976, during an outbreak in Nzara and Maridi, Sudan. In September 1976, a separate outbreak was recognized in Yambuku, Democratic Republic of the Congo (DRC). One fatal case was identified in Tandala, DRC, in June 1977, followed by another outbreak in Nzara, Sudan, in July 1979. In October, an outbreak was identified in a chimpanzee community studied by primatologists in Taï, Côte-d’Ivoire, with one human infection. The largest Ebola hemorrhagic fever epidemic occurred in Gulu District, Uganda from August 2000 to January 2001. In December 2001, Ebola reappeared in the Ogooue-Ivindo Province, Gabon with extension into Mbomo District, The Republic of the Congo lasting until July 2002.
Ebola hemorrhagic fever and several other infectious diseases, e.g. Rift valley fever, Cholera, Hantavirus, have been studied using satellite data that suggest climatic modulation of incidence. Other collaborator agencies that major on animal diseases surveillance is EMPRES-I (information, intelligence, intervention). The newly developed EMPRES Global Animal Disease Information System (EMPRES-I) is a Web-based application that has been designed to support national veterinary epidemiologists and facilitate regional and global information sharing and collaboration on the progressive control and eradication of major TADs. As an example, the monitoring of climatic parameters indicative of drought, floods or other natural or human-induced disasters could help to understand the movement of animals and people with a subsequent impact on the spread of animal diseases.
When it comes to the potentials of remote sensing and GIS in cOVID-19, it is worthy of note that as of 2006, a team of researchers, comprising of epidemiologists and software developers at Boston Children’s Hospital, USA, uses online media sources for real-time surveillance of emerging public health threats to produce what is known as Health Map. They collates outbreak data from a range of sources, including validated official alerts (e.g., from the WHO) and expert to produce Health Map that is near-real-time with geolocated updates to better understand the progression of the pandemic. Spatial analysis methods are powerful tools for modelling disease spread; detect patterns and statistically significant hotspots, thereby predicting future pattern occurrences.
Conclusion
The world is getting stressed of all the human developmental activities both at the micro and macro level and natural forces that are to bring about self-sustenance are also getting disabled to the detriment of both animal and human life. The outbreak of diseases of any kind is a mere indicator of ecological disequilibrium which can be mitigated by early warning devices and tools to diagnose known and unknown emerging diseases as revealed in the works. Remote Sensing and GIS therefore is the most efficient technique of averting general environmental hazard at all level.
The way forward
In order to cope with the present dynamism in global ecology habitat and the spread of diseases, ICT, RS and GIS should be giving topmost priority al all level as already applied by researchers like [34] Once prioritized according to their relevance and impact on animal and human diseases surveillance, the following parameters should be monitored at both micro and macro level:
- • Climatic indicators.
- • Displacement of people/refugees in areas of civil unrest.
- • Livestock trade routes/patterns and changes; transhumance patterns.
- • Human-induced changes to the environment (irrigation schemes, dam construction, Deforestation).
- • Location of check-points/quarantine points/holding grounds.
- • Livestock and commodity market price fluctuations.
- • Major feast periods (e.g. the Hadj in Saudi Arabia)
This system will help to provide plausible prediction of disease epizootics and also highlight areas or regions where targeted surveillance should be implemented.
References
- Karimi H (2020) Application of Remote Sensing in Diseases Monitoring and Dispersion. International Journal of Health and Life Sciences.
- Rich KM, Denwood MJ, Stott AW, Mellor DJ, Reid SWJ, et al. (2013) Systems Approaches to Animal Disease Surveillance and Resource Allocation: Methodological Frameworks for Behavioral Analysis. PLoS ONE 8 :11.
- Schuller S, Francey T, Hartmann K, Hugonnard M, Kohn B, et al (2015) European consensus statement on leptospirosis in dogs and cats. JSAP 56: 159-179.
- Zhang Z, Ward M, Gao J, Wang Z, Yao B, et al. (2013) Remote sensing and disease control in China: past, present and future. Parasites Vectors 6: 11.
- Tran A, Fall AG, Biteye B, Ciss M, Gimonneau G, et al.(2019) Spatial modeling of mosquito vectors for rift valley fever virus in northern Senegal. Integrating satellite-derived meteorological estimates in population dynamics models. Remote Sens 11: 1024.
- Hugh-Jones M (1989) Applications of remote sensing to the identification of the habitats of parasites and disease vectors. Parasitology Today 5: 244-251.
- Glick G, Meade M (1980) Conceptual methodological issues in medical geography. University of North Carolina Press 170- 193.
- Jacobsen K (1993) Comparative analysis of the potential of satellite images for mapping. Proc ISPRS Workshop and Conference International Mapping from Space, Hannover 107-114.
- Chinese Centre for Disease Control and Prevention (2020) The Epidemiological Characteristics of an Outbreak of 2019 Novel Coronavirus Diseases (COVID-19)–China. CCDC Almeida JD, Berry DM, Cunningham CH, Hamre D, Hofstad MS, Mallucci L, et al. (1968) Virology: Coronaviruses. Nature 220: 650-650.
- Mohd HA, Al-Tawfiq JA, Memish ZA (2016) Middle East Respiratory Syndrome Coronavirus (MERS-CoV) origin and animal reservoir. Virology Journal 13:87.
- Guan Y, Zheng BJ, He YQ, He YQ, Zhuang ZX, et al. (2003) Isolation and characterization of viruses related to the SARS coronavirus from animals in southern China Science 302: 276-278.
- Holmes EC, Dudas G, Rambaut A, Andersen KG (2016) The Evolution of Ebola virus: Insights from the 2013–2016 Epidemic 538: 193-200.
- Furuse Y, Suzuki A, Oshitani H (2011) Origin of measles virus: Divergence from rinderpest virus between the 11th and 12th centuries, Virology Journal.
- Inbaraj KC, Chinnappan G, Vallavan R, Alagamuthu KK (2020) Surveillance of livestock diseases with geographical information system (GIS), Salem, South India. Adv. Anim. Vet. Sci. 8: 1147-1153.
- Malone JB, Bergquist R, Martins M, Luvall JC (2019) Use of Geospatial Surveillance and Response Systems for Vector-Borne Diseases in the Elimination Phase. Trop Med Infect Dis 4: 15.
- Lord JS, Torr SJ, Auty HK, Brock PM, Byamungu M, et al. (2018) Geostatistical models using remotely-sensed data predict savanna tsetse decline across the interface between protected and unprotected areas in Serengeti, Tanzania. J. Appl. Ecol 5: 1997-2007.
- Foley DH, Wilkerson RC, Dornak LL, Pecor DB, Nyari AS, (2012) Leveraging spatial data on sand fly vector distribution for disease risk assessments. Geospat Health.6: 25–30.
- Rogers D, Randolph S (1991) Mortality rates and population density of tsetse flies correlated with satellite imagery. Nature 351:739-741.
- Wood B, Beck LR, Washino RK, Palchick SM, Sebesta PD, et al (1991) Spectral and spatial characteristics of rice field mosquito habitat. International Journal of Remote Sensing 12: 621-626.
- Meade MS, florin JW, Gesler WM (1998) Medical Geography. The Guilford Press, New York. Social Science & Medicine 54: 998-999.
- Washino RK, Wood BL (1994) Application of remote sensing to arthropod vector surveillance and control. Am J Trop Med Hyg 50: 134-144.
- WHO (2004) Overview of the WHO framework for monitoring and evaluating surveillance and response systems for communicable diseases. Wkly Epidemiol Rec 79: 322-326.
- Wilson JM, Tucker CJ (2002) Use of Remote Sensing in Epidemic Surveillance and Response. World Meteorological Organ Bull 136-139.
- Beck LR, Rodriguez MH, Dister S, Rodriguez AD, Rejmankova E, et al. (1998) Remote sensing as a landscape epidemiologic tool to identify villages at high risk for malaria transmission. Am J Trop Med Hyg 51: 271-280.
- Linthicom KJ, Bailey CL, Davies FG, Tucker CJ, (1987) Detection of Rift Valley fever viral activity in Kenya by remote sensing imagery. Science 235: 1656-1659.
- Kitron U, Bouseman J, Jones C (1991) Use of the ARC/INFO GIS to study the distribution of Lyme disease ticks in an Illinois county. Prev Vet Med 11: 243-248.
- Malone J, Zukowski S (1992) Geographical models and control of cattle liver flukes in the southeastern USA. Parasitology Today 8: 266-270.
- NASA (2003) CHAART’s role in public health. Center for health applications of aerospace related technologies.
- Pinzón JE, Wilson JM, Tucker CJ, Arthur R, Jahrling P, et al. (2004) Trigger Events: Enviro-Climatic Coupling of Ebola Hemorrhagic Fever Outbreaks. Am J Trop Med Hyg 71: 664- 674.
- Pinzón JE, Brown ME, Tucker CJ, (2004) New vegetation index data set available to monitor global change. News, EOS 52: 565-569.
- Linthicum KJ, Anyamba A, Tucker CJ, Kelley PW, Myers MF, et al. (1999) Climate and satellite indicators to forecast Rift Valley fever epidemics in Kenya. Science 285: 397-400.
- Pinzon JE, Wilson JM, Tucker CJ (2005) Climate-based health monitoring systems for eco-climatic conditions associated with infectious diseases.
- Kamel-Boulos MN, Geraghty EM (2020) Geographical tracking and mapping of coronavirus disease COVID-19/severe acute respiratory syndrome coronavirus 2 (SARS-CoV-2) epidemic and associated events around the world: how 21st century GIS technologies are supporting the global fght against outbreaks and epidemics. Int J Health Geogr 19: 8.
- Cross ER, Perrine R, Sheffield C, Passaglia G (1984) Predicting areas endemic for Schistosomiasis using weather variables and a Landsat data base. Mil Med 149: 542-544.
Citation: Dukiya JJ (2021) The Role of Remote Sensing in Epidemiological Studies and the Global Pandemic Surveillance J Atmos Earth Sci 5:024.
Copyright: © 2021 Dukiya JJ, et al. This is an open-access article distributed under the terms of the Creative Commons Attribution License, which permits unrestricted use, distribution, and reproduction in any medium, provided the original author and source are credited.