The use of Remote Sensing and GIS Methodology in the Analysis of Urualla Gully Erosion site Imo State Nigeria
*Corresponding Author(s):
Sylvanus I. IroDepartment Of Geography And Environmental Management, Imo State University, Owerri, Nigeria
Tel:+2348036737854,
Email:sylvanusiro@gmail.com; s.iro@imsu.edu.ng
Abstract
The study of Urualla gully erosion is currently undermined by the inherent costs associated with consistent field monitoring and the lack of historic measurements to perform time series analysis. Remote sensing methodologies, via the Landsat archive, are used as a low-cost data source to allow analyses of gullies over the time period 2006 to 2021. In conjunction with long term environmental variables, the Landsat data is used to establish landcover changes over the time period, via pixel based classification, to identify its role in gully development. Aiming to link environmental characteristics and land cover changes with Urualla gully development and its rates of change, Digital Elevation Models (DEM) and remote sensing imagery are used to detect topographical and landscape characteristics and to calculate gully dimensions. Landscape analysis over the study period reveals a steady increase in Gully/Open land. The increasing area of Urualla gully consistently correlating with vegetation loss, (r=-0.97 (p<0.05)) and also, when correlated with Built-Up Area over the same period of time, the correlation shows (r=0.97 (p<0.05). Analysis of study area topography at 30m resolution reveals that Urualla gully site developed on high slope of more than 400 . The study offers a method of monitoring Urualla gully development from early stage to maturity and exemplifies the complexity and variability of erosion drivers in the study area. It presents a verified approach in the monitoring of gullies, enacted through use of low budget/computing cost remote sensing and classification technologies, and serves to embolden civilian and governmental efforts to manage the societal and environmental menace of gully erosion.
Keywords
GIS; Gully erosion; Remote sensing; Urualla
Introduction
The process of gully erosion and sediments are caused by rainfall, soil properties and topography and can be induced by anthropogenic interference including land management practices [1]. The rainfall intensity is high in this area of Nigeria and often persists for long durations. Storms with over 25 mm/h intensity have been reported by [2] to be particularly erosive. [3] observed in the region that most gullies develop at slopes, cuestas, fractures and joints which are common features in the gully-erosion-prone areas of Southeast Nigeria and have been identified as significant factors in the formation of gullies and subsequent erosion. Gully erosion has been a growing concern to mainly the developing world which could be due to both intentional and unintentional activities of humans on the physical environment [4]. In areas of southeast Nigeria, gully development has become one of the greatest environmental hazards in many villages and towns [5]. [6] pointed out that about 2% of the area is fast becoming hazardous to human habitation because of gully formation and subsequent degradation in the area.
Therefore, Urualla Gully erosion has been long neglected because it is difficult to study and to predict because of the caving walls. Gully processes have a three-dimensional nature affected by a wide array of factors and processes. Studies have indicated that Urualla gully erosion is commonly triggered or accelerated by land use change [1,6] and/or extreme climatic events. The focus of this study is to find out how these phsycal and human factors have contributed in causing Urualla gully over a studied period of time. Gully erosion results also from a long antecedent history that cannot be overlooked when attempting to understand spatial erosion patterns. Moreover, many gullies grow initially rapidly to large dimensions [7,8], making effective control technically difficult or prohibitively expensive. When gully erosion is not properly studied and monitored, the control of such gully will be difficult.
Study Area
Ideato North is a Local Government Area in Imo State, Nigeria. This local government was created in 1976 as Ideato Local Government, but was later divided into Ideato North, and Ideato south. Its administrative headquarters is in Urualla. Ideato North is located between 50 86’N 60 59’ N, 60 60’E, and 50 86’ N, 70 13’ covering a land area of approximately 190Km2 as shown in Figures 1 and 2. It is characterised by coexisting types of land use and land cover, which are mainly affected by gully erosion. The study area lies within the humid tropical rainforest belt with an annual rainfall of approximately 1800-3000mm [9]. Vegetation in the area is controlled by topography (which varies mainly from flat to swamp like regions), relief and lithology, with anthropogenic factors such as abandoned industrial sites also playing a defining role [10]. The vegetation ranges from rainforest to Guinea Savannah [11]. Dense vegetation with high trees is prominent around streams and shaley lowlands while guinea vegetation and isolated trees are prominent on sandy soils in highland areas [12]. The tropical soil of the area supports extensive plantation forests, such as Oil palm, Rubber, Cocoa and Bananas. Human activities such as bush burning, agriculture and construction works have greatly modified the natural vegetation in the area, potentially contributing to the creation and extent of gullies [13].
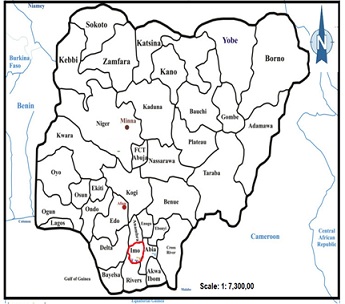 Figure 1: Nigeria Map Highlighting Imo State Nigeria.
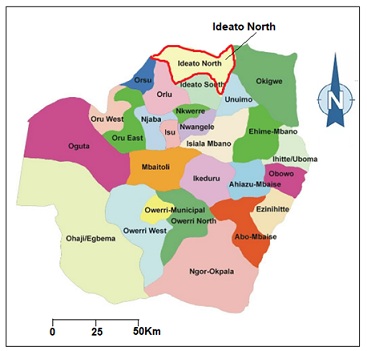 Figure 2: Map of Imo State showing Ideato North the study area.
Methodology
This study embraces remote sensing and GIS methodologies in processing the satellite data. This involves Landcover classification, study area DEM (Digital Elevation Model) analysis and gully area. In the case of this study, the remote sensing data used in this research were acquired from Landsat images (scientific satellite that studies and photographs the earth's surface by using remote-sensing techniques) from December 2006, 2007, 2008, 2009, 2010, 2011, 2012, 2013, 2014, 2015, 2016, 2017, 2018, 2019, 2020 and 2021. A total of 16 landsat imagies Figure 3 for 16 years, were classified according to landuse and landcover system. The use of Landsat in this study is warranted for several reasons. It is observed that no other current or planned remote sensing system, public or private, fills the role of Landsat in global, regional environmental change research, or in civil and commercial applications [14]. The Landsat archive contains data spanning over 40 years [15] and continues to be collected through Landsat 8 launched in February 2013. The spatial resolution of Landsat Images from 1986 onwards is 30m x 30m, and is applicable for the study area, as the study area covers an area of about 190Km2. The landsat classification of the land use of the area was done spanning the 16 years to find out anthropogenic contributions to the gully development of Urualla [16]. This was done to compare the rate of change of the gully over this period of time. In other to check the reliability of the classification, the points from the various classes (Water bodies, Vegetation, Gully/Open land and Built-Up Area) were taken and overlaid in a Google Earth that has a higher resolution , which gave a 88% to 98% confidence level. Again, the Urualla gully site were measured from the Landsat and Google Earth Imagies to compare reliability of the measurement. This was done from years 2006 to 2021 and compared with the classified imagies of Landsat. The gully measurements got from the 16 years under study, were used to correlate the pixel count of Vegetation and Built-Up Area to check the relationship. Further analysis of topography was conducted via analysis of gully locations in respect to the slope aspect. [16] maintained that slope orientation affects gully development which depends on the side that is receiving rainfall more which determines the amount of runoff. The Digital Elevation Model (DEM) Figure 4 of the study area was acquired to find out the physical contribution to the development of Urualla gully site. This is to find out the nature of the slope of the study area, to know whether it is contributing to the gully development of Urualla. This method was adopted by [17,18].
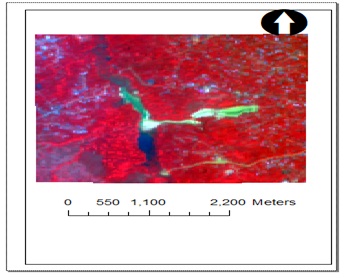 Figure 3: 2021 Colour Infrared Landsat Image of Urualla Gully area of Ideato North Imo State Nigeria with band combination of 5, 4, 3 for Landsat 8 and 4, 3, 2 for Landsat and cropped to leave only the region of interest. (USGS 2021).
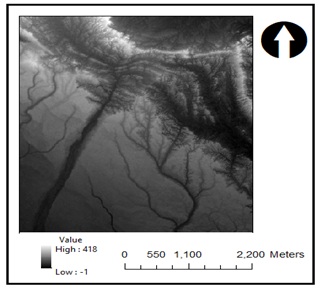 Figure: 4 An SRTM DEM image of the 190km2 study area, cropped to Area of Interest Black represents low elevation.
Presentation Of Result
The digital elevation map of the study area is produced from the SRTM (Shuttle Radar Topography Mission) data at 30 m (1 Arc-second) resolution Rendering Digital Elevation Models (DEM) to detect changes and calculate gully dimensions of focused gully site (to observe how slope and nature of slope, influence gully development)”. The adoption of Digital Elevation Model for this analysis is a new method that can easily reveal the nature of the landscape [18]. Land surface topography has been reported to significantly affect the processes of runoff and erosion. The presentation of the topographic analysis in this study looks into the natural causes of gully development in the study area although known to be caused by both the contributions of topographic and anthropogenic disturbances [17,19].
The slope gradient Figuer 5 is one of the most important factors affecting gully erosion. [20] also emphasizes the importance of slope by showing that the studied gullies are located at the base of slopes or hills. [17] observed that in the simplest terms, land located on steep inclines is more vulnerable to water erosion than flat land. 0 – 200 are mostly found in low lying areas which are mainly found on top of plateaux, flood plains, flat areas and areas liable to flooding. Areas with 21 - 800 and above accommodates the long stretch of the Urualla gully site revealing that these areas are where gullies are most commonly developing. Figure 5, provides a graphic showing slope and elevation.
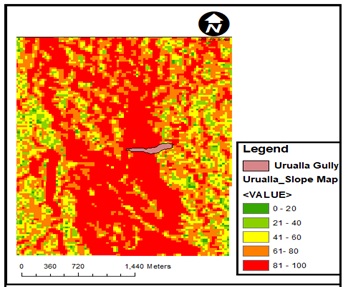 Figure 5: Maximum slope map of the study area shown as a degree gradient (flat areas have 0 – 20, 21 - 400 gentle slope and 410 and greater are higher). Overlaid with 2021 Urualla Gully shapefile.
Land Cover Classification
This section used remote sensing data (Landsat) Figure 6 to determine change in land-cover through Pixel based Image Analysis classification over a maximum 16-year period (2006-2021) in the study area”. There acceptability were based on the accuracy assessment conducted with Google Earth Image. Many researchers have attributed landcover removal as the main source of gully development. In South East Nigeria, [21-23] have separately agreed that gullies mostly develop on soil on which vegetal growth has been disturbed due to infrastructural developments, for example roads and housing developments. Land cover classification is one of the modern methods of ascertaining the level of land cover removal by human interference. By 2021, over a period of almost 16 years, this classified vegetated proportion of the total land surface has reduced to 74.5% according to Pixel based approache classification from 82.9% recorded in 2006. It is evident from the percentage changes that converse to the vegetation loss the Gully/open-land classification has followed a significant and steady increase in area covered over the same time period. With respect to the regional land cover classification presented in Table 1 for each of the available study years, the significant loss in vegetation is predominantly attributable to increases in Urban-land and gully development.
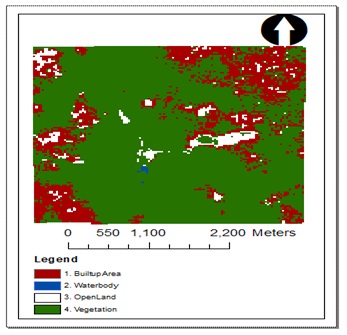 Figure 6: Example of the result of pixel based classified image of Landsat 2021 of the study area. (Vegetation class is dominant, but when zommed in on a GIS software the hidden classes can be clearly observed).
|
|
Classes |
2006 |
2007 |
2008 |
2009 |
2010 |
2011 |
2012 |
2013 |
2014 |
2015 |
2016 |
2017 |
2018 |
2019 |
2020 |
2021 |
|
|
|
% |
% |
% |
% |
% |
% |
% |
% |
% |
% |
% |
% |
% |
% |
% |
% |
|
1 |
Built up Area |
13.9 |
14.1 |
14.1 |
14.8 |
15.0 |
15.1 |
15.1 |
15.2 |
15.2 |
15.3 |
15.4 |
16.1 |
17.9 |
17.9 |
18.7 |
21.2 |
|
2 |
Water body |
0.1 |
0.1 |
0.1 |
0.1 |
0.1 |
0.1 |
0.1 |
0.1 |
0.1 |
0.1 |
0.1 |
0.1 |
0.1 |
0.1 |
0.1 |
0.1 |
|
3 |
Open Land |
3.1 |
3.3 |
3.4 |
3.5 |
3.6 |
3.6 |
3.6 |
3.7 |
3.7 |
3.7 |
3.8 |
3.9 |
4.0 |
4.0 |
4.0 |
4.2 |
|
4 |
Vegetation |
82.9 |
82.6 |
82.4 |
81.6 |
81.3 |
81.2 |
81.1 |
81.1 |
81.0 |
80.9 |
80.7 |
80.0 |
78.1 |
78.0 |
77.1 |
74.5 |
Table:1 Pixel based Classification Result as Percentage of total area classified. Total area size =.190km2.
As can be observed, as the vegetation is decreasing, the Gully/Open Land is increasing in size for example, by 2006, the vegetation was 83% and Gully/Open Land was 3% but onwards to 2021, vegetation has decreased to 76% and Gully/Open land was 4%. Also when compared the gully/open land and Built up areas, it reveals that as built up area increases so also the Gully/Open land is increasing. For example by 2006, the built up area was 14% also, the Gully/Open Land was 3%, equally, the Built up area and Gully/Open Land recorded 21% and 4% in 2021 respectively.
Analysis of gully site and area and % change
This section tries to assess the gully area and their % change from 2006 – 2021, Table 2 shows how the gully has been growing in size starting from 2006 when the Urualla Gully has not formed to 2021 when it has increased in size. From 2006, the gully was 0m2 and the gully developed in 2007 with the size of 18170m2. The Urualla gully has increased in size in 2021 to 202364m2, this has shown a difference of 184194m2 from 2007 when it developed Figure 7. The absolute values of area covered by the Gully/Openland class are shown in Table 2 and Figure 8 where the graph is dispicting how the gully has been growing in size from years 2006 to 2021.
|
No of Years |
Urualla_m2 |
No of Years |
Urualla_m2 |
|
2006 |
0 |
2016 |
37000 |
|
2007 |
18170 |
2017 |
37714 |
|
2008 |
20532 |
2018 |
171084 |
|
2009 |
25665 |
2019 |
179624 |
|
2010 |
30235 |
2020 |
193560 |
|
2011 |
30842 |
2021 |
202364 |
|
2012 |
34268 |
|
|
|
2013 |
38342 |
|
|
|
2014 |
40678 |
|
|
|
2015 |
43570 |
|
|
Table 2: Area covered in m2 by Urualla Gully from 2006-2021.
 Figure 7: Urualla Gully shapefile 2021 overlaid by 2007 shapefile.
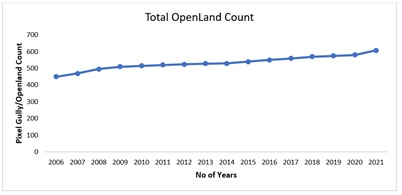 Figure 8: The gully areas and % change graphs show how the gullies have been changing over the years.
Correlation Analyses
Gully/Open land verses Vegetation and Built-up Area
The Urualla gully and vegetation class have shown a strong negative correlation coefficient of -0.9 with (P < 0.05) the correlation coefficient is statistically significant from years 2006 to 2021. This has shown that as gully area continues to grow in area size, the vegetation class continues to decrease in area size. This has shown that the vegetation loss around the gully area could be linked to Urualla Gully development. The same can be attributed to Urualla gully and Built-Up Area, a strong positive correlation coefficient of 0.9 with (P < 0.05) the correlation coefficient is statistically significant from years 2006 to 2021. Also, the development in Built-Up Area around the Urualla gully has shown that it could be one of the reasons why the Urualla gully is growing in area size. As the community continues to disturb the vegetation of the area to build and construct on it, these could be contributing to generate the Urualla gully from 2006 to 2021.
Discussion
Land cover changes influenced by anthropological activities
The Urualla gully erosion which started in 2007, shown that it has been growing in size which could be attributed to land use activities and nature of topography. From the year 2006, the gully has not stopped expanding and closing into residential areas.
Correlation analyses examining the relationship between vegetation area and the occurrence of Gully/open-land development was examined in the results section using Pearson’s, correlation coefficients. The analysis was conducted for Pixel based classification methodology incorporated in this study within a broader analysis of land cover change in the study area. In terms of the correlation between vegetation area and gully/openland development, Pixel based classification produced a correlation of r= -0.9 (p < 0.05). A similar strength of correlation was exhibited for Built Up Area with r= 0.9 (p < 0.05) with both results indicating a very strong and significant negative and positive correlation respectively, between the amount of vegetated area and Gully/open-land development and Built-up Area verses Gully/Open land over the study period 2006-2021. Although such a strong and apparent correlation is evident and fundamentally expected, what cannot be conclusively determined from the analysis is whether the vegetation loss had a causal effect on gully development. Based on the correlation levels and from referring to studies such as [24-27]; and the causal effect is highly probable. These referenced studies from different time periods and regions agreed that the removal of vegetation begins a detrimental series of events which affect soil quality and stability which then directly result in gully development.
The vegetation land cover reduction exhibited on the regional scale in this study, across approximately 190km2, is predominantly enacted through anthropological activities, with anthropogenic landcovers inversely related with vegetation cover. Similar correlation analyses undertaken with the built-up class showed that the resulting correlation between Vegetated area and Urban-land increase was r= 0.9 (P < 0.05) for Pixel classifications, showing reasonably strong positive association.
Topographical influences on gully development
Topography has a strong influence on gully development. In agreement to this study, several studies have identified topography as the main link to gully development. [17,28-31] observed that topographical influence was the prime reason for gully development in different locations. Some of the topographical factors include the contribution to runoff as the amount and intensity of rainfall combines with these. In southeast Nigeria, rainfall data is high because it is influenced by tropical monsoon climate which generates over 1000mm of monthly rainfall every year during rainy season (March - November). The slope of land, properties of soil, and the nature and extent of ground cover are all deemed essential contributors to gully formation as reported in, [8], and. In Nigeria, many works such as, found that there is a positive relationship between relief and gully erosion leading to more pronounced and aggressive gully erosion in areas with valley topography such as Urualla gully, than areas with flat land. This is expected due to the physics of the scenario. Ofomata pointed out that in areas like Agulu-Nanka, Njaba, Nekede-Owerri, Iyioku, Okigwe, Afikpo, Ohafia, and Umuahia, the gullies can be traced to the natural slope of the topography, as pointed out in this work, but the occurrence of gullies must be influenced by more than just this, otherwise gullies would form on all steep topography. The result of this study tends to agree with Ofomata on the importance of slope by showing that the studied gully is located at the base of slopes. The slope degree of Urualla gully is between 400 and above, with the gully evidently developing at the base of the slope because it is the area where runoff converges to form the gully head before it develops.
Conclusion
This long period of data collection and analysis provided enough information on what has been happening in the past and the anthropogenic activities that are responsible for gully development. The Urualla gully was studied in detail, traced, and tracked from 2006 – 2021. This was primarily to observe their relationship with landcover and topography of the study area. It was observed from the analysis that as the vegetation of the study area continues to reduce, Gully/open lands continues to develop while new gullies are expected to form. The open land development that was tied to vegetation loss could be responsible for the gully development as can be found from the location of Urualla gully shapefile overlaid on classified satellite image.
Following the identified causes of gullies in the study area which has shown the ability of using remote sensing and GIS to monitor gully development, mitigation measures can now be put in place to prevent further gully development and be able to control already developed ones on a local and regional level and through civilian or governmental pathways.
Recommendation
- Proper land management should be adopted by the community of Urualla and its environs to stop farming around the gully, cutting of trees and using heavy earth moving machines around the area.
- Since the study area is located on areas where the elevation is high, retention and infiltration of surface water should be provided in areas were run off is high to avoid high runoff which erodes the soil from upland.
- Construction of buildings and other construction activities should be stopped around the study area because, as shown in the study, as built-up area continues to increase, the gully area continues to increase in area size.
References
- Abayomi YA, Fadayomi O, Babatola JO,Tian G (2001) Evaluation of selected legume cover crops for biomass production, dry season survival and soil fertility improvement in a moist savanna location in Nigeria. Afri. Crop Sci. J. 9: 615-629.
- Boardman J (2006) Soil erosion science: reflections on the limitations of current approaches. Catena 68: 73-86.
- Bochet E, García-Fayos P (2004) Factors controlling vegetation establishment and water erosion on motorway slopes in Valencia, Spain. Restoration Ecology 12: 166-174.
- Duke M (2012) Erosion and Depositions in Akamkpa Cross River state, Nigeria Environmental Society Team Nigeria. June Ed. 20-25.
- Egboka B C (1993) The Raging War: A Publication of Anambra State Government of Nigeria.
- AwkaEzezika OC, Adetona O (2011) Resolving the Gully Erosion Problem in Southeastern Nigeria. Journal of Soil Science and Environmental Management, 2: 286-291.
- Hudson J (1981) Soil and Water Conservation in Semi-arid areas. Food and Agricultural Organisation. Issue 57
- Igbokwe JI, Akinyede JO, Dang B, Alagac T, Onoa MN et.al (2008) Mapping and Monitoring of the Impact of Gully Erosion in Southeastern Nigeria with Satellite Remote Sensing and Geographic Information System; The International Archives of the Photogrammetry, Remote Sensing and Spatial Information Sciences.
- Igwe CA (2012) Gully Erosion in Southeastern Nigeria: Role of Soil Properties and Environmental Factors.
- Igwe LU (2004) Soil erosion in the northern parts of the Orlu Uplands, Nigeria, Niger. J. Ministry of Geology. 13: 6-1
- Igwe UO (2005) Harnessing information technology for the 21st Century: Library education in Nigeria. Library Philosophy and Practice. 7: 2.
- Ijeoma F, Okey UN (2005) Soil degradation assessment in southeastern Nigeria, Erosion processes as quantified by rainfall. 23: 51-63.
- Iloeje PN (2010) A New Geography of Nigeria. Longman Nigeria; Published by Longman, United Kingdom
- Iro S (2020) Application of Geographic Information System in the Mapping of Otamiri River. International Journal of Engineering Sciences Watershed in Owerri, Nigeria, 3: 1-5
- Iro S (2020) Determining Causes of Gully Erosion and Associated Rates of Change in South-east Nigeria, Using a Remote Sensing and GIS Methodology.
- Kosmas C, Danalatos N, Cammeraat LN, Chabart M, Diamantopoulos J, et.al (1996) The role of soil in the Gully erosion development in Anambra, Nigeria. Hydrology. 7: 358-389.
- Madu FH, Okaro GM, Uko WL (2006) Role of Vegetation in the control of water Erosion in Okigwe, Nigeria, Soil Erosion. 1:22-32.
- Marquisee JA (2010) Factors Influencing Gully Development on Roadcuts in Southeastern Ohio, a thesis presented to the faculty of the College of Arts and Sciences of Ohio University, Department of Geography and the College of Arts and Sciences Ohio
- Nachtergaele FO, Van-lynden JW, Batjes NH (2002) Soil and terrain databases and their applications with special reference to physical soil degradation and soil vulnerability to pollution in Central and eastern Europe.
- National Air Space Agency (1999) Human Exploration and Operations.
- Nyom (2005) Soil Erosion Management and control in Baminda southern Cameroun, Land management Journal 7 -17.
- Obiadi II, Nwosu CM, Ajaegwu NE, Anakwuba EK, Onuigbo NE et al. (2011) Gully Erosion in Anambra State, Southeast Nigeria: Issues and Solution. International Journal of Environmental Sciences.
- Ofomata GEK (2002) Geology in Ofomata (ed) A survey of the Igbo Nation Africa. Onitsha: FEP.
- Ofomata GEK (2008) Soil erosion in the Enugu area of Nigeria. Niger Geography J 8: 45-59.
- Onyekwere JK (2001) The Effect of Human Impact on Ground Cover and Subsequent Erosion in Southeast Nigeria, Environmental Research: 55-63.
- Poesen J, Valentin C (2003) Gully Erosion and Global Change. Proc. First International Symposium on Gully Erosion, Leuven, Belgium, April 2000. Catena 50: 87-62.
- Posser IP, Slade CJ (1994) Gully Formation and the Role of Valley floor vegetation south-eastern Australia Geology 22: 1127-1130
- Taruvinga K (2008) Gully mapping using remote sensing: case study in Kwazulu Natal South Africa, Ontario, Canada, University of Waterloo, MSc thesis.
- Ujoh F, Ifatimehin O, Baba AN (2011) Detecting Changes in Landuse/Cover of Umuahia, South-Eastern Nigeria Using Remote Sensing and GIS Techniques, Confluence Journal of Environmental Studies.
- Valentin C, Poesen J (2005) "Gully erosion: Impacts, factors and control". Catena, 63: 132-153.
- Zhang Y, YQ W, Liu BY, Zheng QH J, Yin Y (2007) Characteristics and factors controlling the development of ephemeral gullies in cultivated catchments of black soil region, northeast China. Soil Tillage Res 96: 28-41
Citation: Iro S, Duru PN, Achalonu CA (2022) The use of Remote Sensing and GIS Methodology in the Analysis of Urualla Gully Erosion site Imo State Nigeria. J Environ Sci Curr Res 5: 030.
Copyright: © 2022 Sylvanus I. Iro, et al. This is an open-access article distributed under the terms of the Creative Commons Attribution License, which permits unrestricted use, distribution, and reproduction in any medium, provided the original author and source are credited.