Use of a Case Series to Determine which Sub-scores Best Correlate with the Total Dynamic Movement Assessment Score
*Corresponding Author(s):
Kellie R SticklerPhysical Therapist, Cerner Corporation, 5344 Nall Ave, Roeland Park, KS 66202, United States
Tel:+1 8165893001,
Email:kellierstickler@gmail.com
Abstract
Keywords
INTRODUCTION
Risk factors for knee injury, both intrinsic and extrinsic, include altered biomechanics [8,12] decreased lower extremity strength [7], poor neuromuscular control [15] and hormonal differences [16,17]. Biomechanically, if an athlete has an aberrant movement pattern, such as landing with knee abduction moment [10] and less knee flexion, then his or her peak ground reaction force could be increased greater than 3-6 times body weight [12]. Also, neuromuscular fatigue has been shown to change landing mechanics in both men and women [18].
Performance programs have been developed to decrease the risk of injury in sports such as soccer [19-21], however, results are inherently variable and the risk of re-injury persists. Tools have been utilized to assess quality of movement and patterns of movement of athletes. The Functional Movement Screen (FMS), a commonly used musculoskeletal screen, is used to determine risk of injury based on seven functional movements [5]. The FMS has been utilized for athlete screening and return to sport testing, however, it is recommended to be cautious when applying it to injury prevention [22]. The lack of predictive accuracy for decreasing the risk of athletic injury generated the development of the Dynamic Movement Assessment (DMA). The DMA boasts a multi-planar movement analysis with built-in fatigue model. The DMA is a sequence of 6 physical performance tests with video analysis to assess biomechanics and potential risk for injury. The 6 physical performance tests include full squat, step up, single leg squat, single leg hop, plank test, and side plank. This case series is used to evaluate which DMA sub-scores best correlate with the total DMA score.
METHODS
Experimental Approach to the Problem
Subjects
PROCEDURES
The DMA was conducted by a PT on 15 female soccer players pre-season. Testing was standardized using a line of reference (12 inches) for positioning the athlete to ensure image capture by HD camera (Logitech, 90 FPS) and to avoid individual variation. The athlete was within a three-foot circumference of the reference line at all times. The camera was positioned 25 feet from the reference line (Figure 1). Body position was determined for trunk, hip, knee, and ankle/foot position with reference to a plumb line. Common body position faults noted were adduction past midline (Figure 2) and corkscrewing (Figure 3). Tests were conducted in the following order to ensure a graduated level of fatigue: Full squat test, Step-up test, Single leg squat test, Single leg hop test, Plank test, Side plank test. No rest periods were allowed in between tests. If pain was reported during a test, testing was stopped and the athlete was scored a zero.
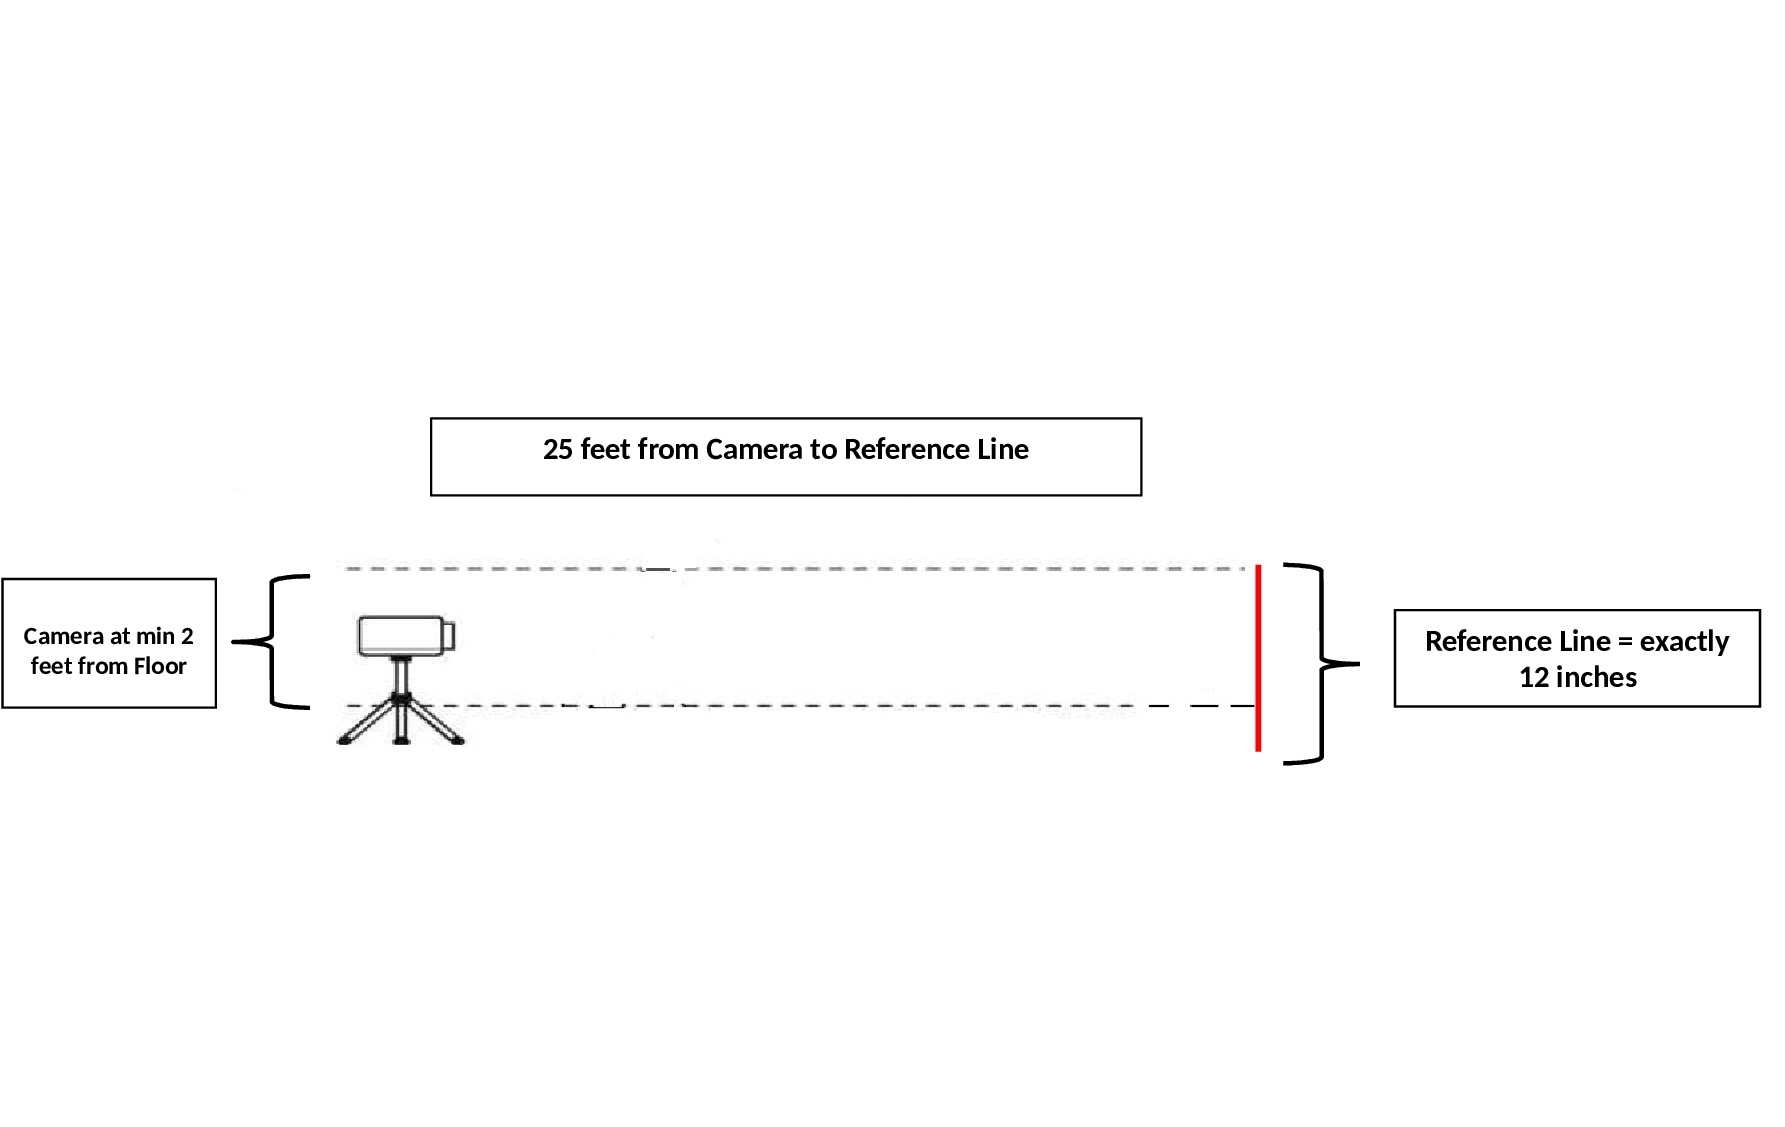 Figure 1: Camera Set-Up.
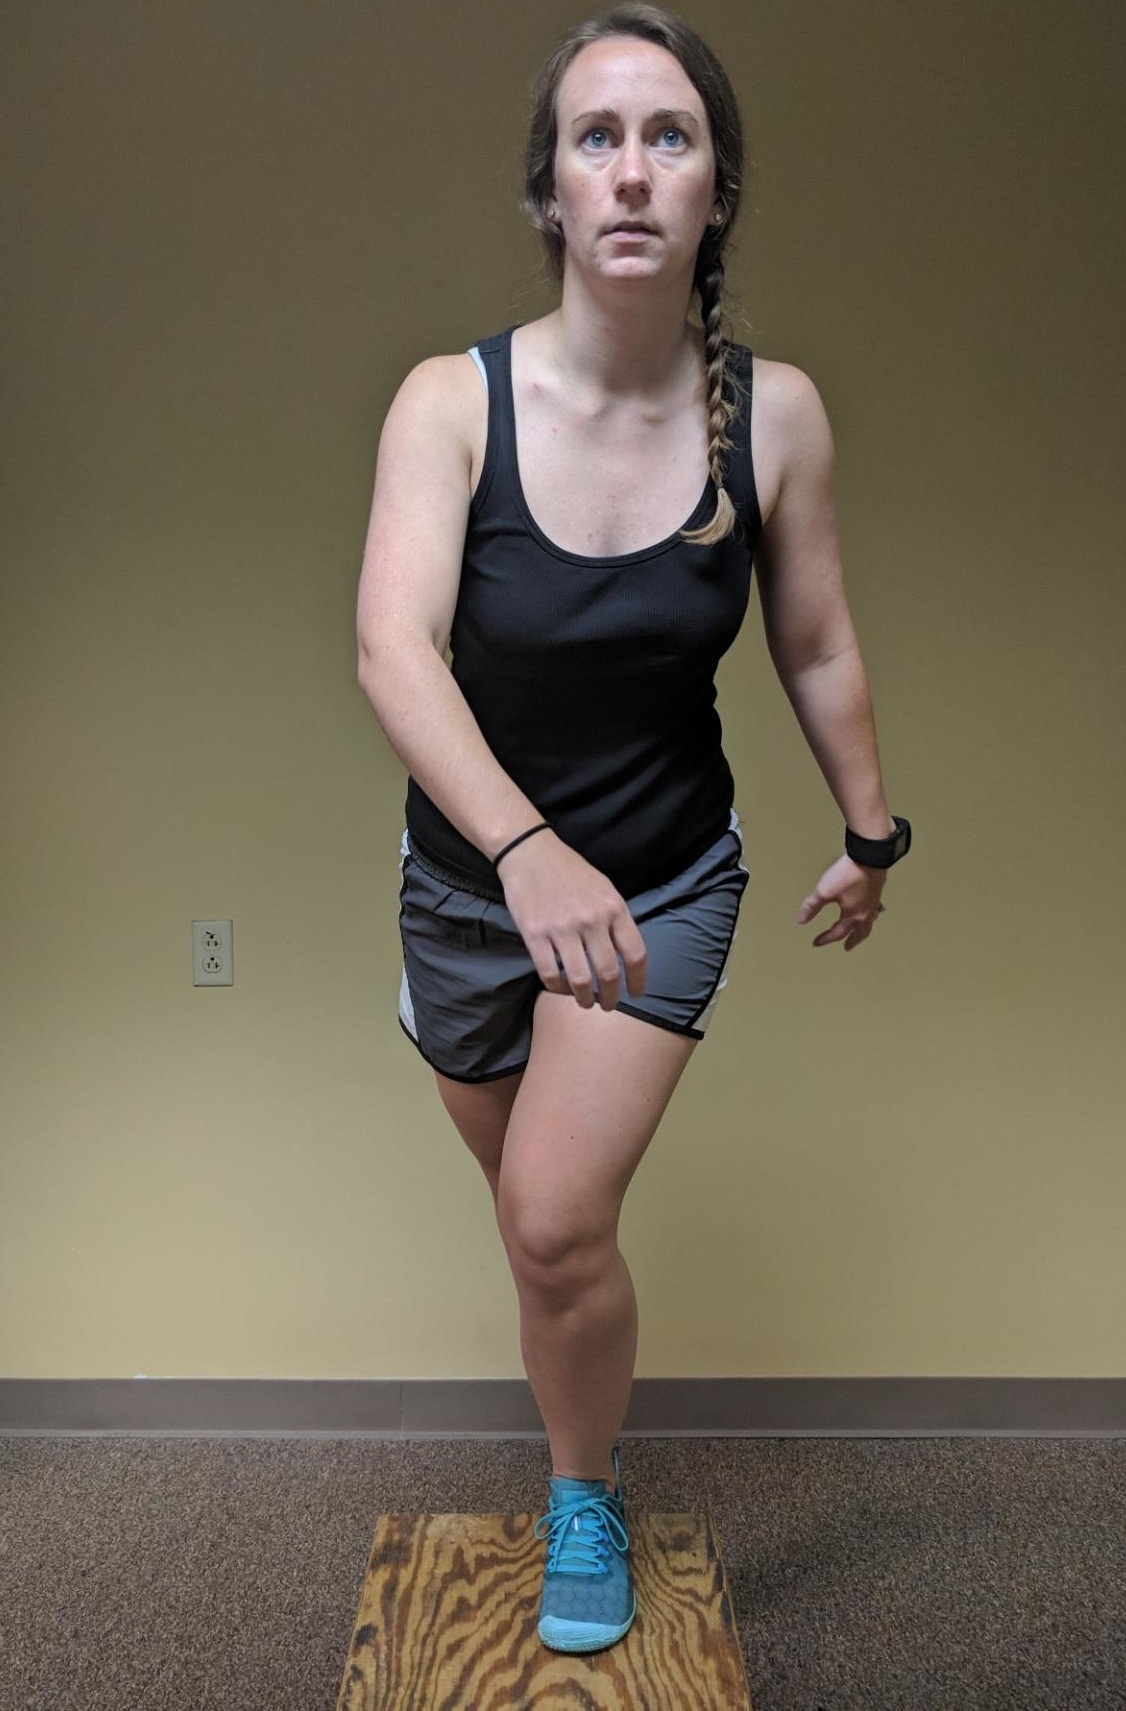 Figure 2: Knee Adduction Fault.
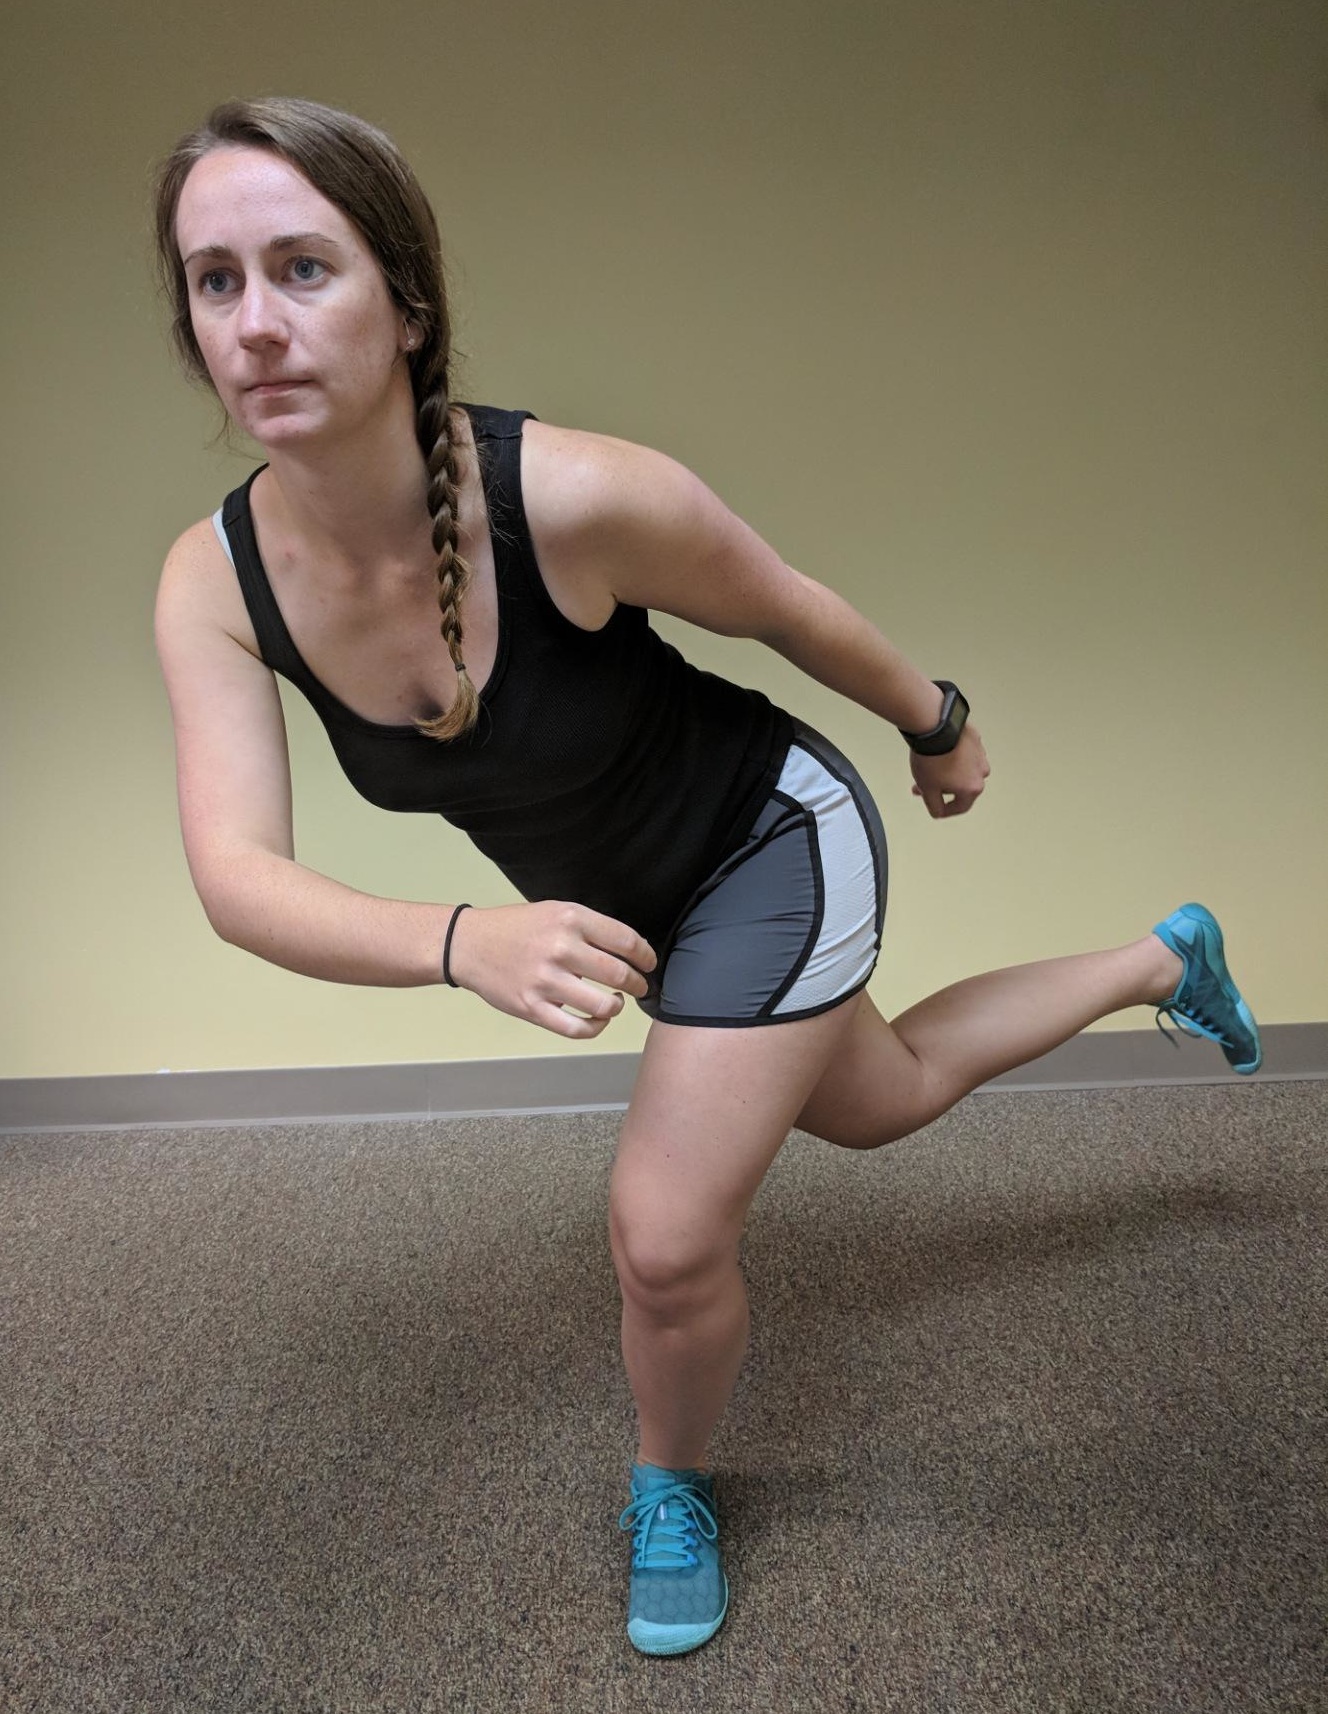 Figure 3: Corkscrew Fault.
Full Squat Test
Step-Up Test
Single Leg Squat Test
Single Leg Hop Test
Plank Test
Side Plank Test
A complete fatigue assessment protocol includes 80 repetitions and 3 minutes of plank exercises. Athletes were instructed they might feel soreness following the test. Pre-season data was collected by the PT via DMA scoring system and recorded on computer using de-identifying coding ID for each athlete. Injury data was collected by the team athletic trainer and provided to the PT for the corresponding athlete. A spreadsheet was developed utilizing the de-identified information for all details including DMA scores, risk profile and recorded injury.
Statistical Analysis
RESULTS
Individual DMA assessment scores are shown in Table 1. Athletes scored the highest on the Plank Test (2.20 ± 0.86) followed by Side Plank Test-Left (2.00 ± 0.92) and the Side Plank Test-Right (1.93 ± 0.88). After stratifying by adduction status, participants who were observed performing adduction past midline recorded lower scores (higher risk rating) compared to participants whose adduction status were properly limited to the midline. There were statistically significant differences in risk rating scores between the adduction statuses within the Step-up Test (Past Midline = 1.33 ± 0.78 vs To Midline = 2.67 ± 0.57; p = 0.02), Single Leg Squat Test (Past Midline = 1.00 ± 0.60 vs To Midline = 2.00 ± 0.0; p = 0.02) and the Single Leg Hop Test (Past Midline = 1.25 ± 0.86 vs To Midline = 2.67 ± 0.57; p = 0.02).
|
DMA Assessment |
Overall |
Past Midline Adduction |
Midline Adduction |
p-value1 |
No Corkscrew |
Corkscrew |
p-value1 |
|
(N=15) |
(N=12) |
(N=3) |
(N=6) |
(N=9) |
|||
|
Mean (SD) |
Mean (SD) |
Mean (SD) |
Mean (SD) |
Mean (SD) |
|||
|
Full Squat Test |
1.53 (0.83) |
1.41 (0.79) |
2.00 (1.00) |
0.22 |
1.67 (0.81) |
1.44 (0.88) |
0.43 |
|
Step-up Test |
1.60 (0.91) |
1.33 (0.78) |
2.67 (0.57) |
0.02 |
2.16 (0.98) |
1.22 (0.67) |
0.04 |
|
Single Leg Squat Test |
1.20 (0.67) |
1.00 (0.60) |
2.00 (0.0) |
0.02 |
1.50 (0.83) |
1.00 (0.50) |
0.12 |
|
Single Leg Hop Test |
1.53 (0.99) |
1.25 (0.86) |
2.67 (0.57) |
0.02 |
2.50 (0.83) |
0.89 (0.33) |
0.002 |
|
Plank Test |
2.20 (0.86) |
2.16 (0.83) |
2.33 (1.15) |
0.69 |
2.50 (0.83) |
2.00 (0.87) |
0.25 |
|
Side Plank Test-Right |
1.93 (0.88) |
1.91 (0.90) |
2.00 (1.00) |
0.93 |
2.33 (0.81) |
1.67 (0.86) |
0.15 |
|
Side Plank Test-Left |
2.00 (0.92) |
1.91 (0.90) |
2.33 (1.15) |
0.45 |
2.33 (0.81) |
1.78 (0.97) |
0.26 |
Note: 1Wilcoxon Rank Sum to compare DMA Assessment Scores between groups.
Similar to the Past midline adduction, participants who performed corkscrews during activity observed lower assessment scores (higher risk ratings) compared to others who did not perform corkscrews. The Step-up Test and the Single Leg Hop Test scores showed statistically significant differences in scores between the Corkscrew (No Corkscrew = 2.16 ± 0.98 vs Corkscrew = 1.22 ± 0.67; p = 0.04) and No Corkscrew (No Corkscrew = 2.50 ± 0.83 vs Corkscrew = 0.89 ± 0.33; p = 0.002) groups, respectively. With respect to aggregate DMA assessment scores, statistical significance was observed between the Adduction groups (Past Midline = 11.0 ± 3.24 vs To Midline = 16.0 ± 2.64; p = 0.03) and the Corkscrew groups (No Corkscrew = 15.0 ± 2.60 vs Corkscrew = 10.0 ± 2.87; p = 0.007), respectively.
Univariate linear regression reported that the Single Leg Squat Test observed the highest relationship to the aggregate assessment scores (Beta (95% CI) = 0.37 (0.13, 0.61); p = 0.005), followed by Side Plank Test-Right (Beta (95% CI) = 0.32 (0.15, 0.48); p = 0.001), and Side Plank Test-Left (Beta (95% CI) = 0.31 (0.16, 0.46); p = 0.001), respectively. However, the stepwise variable selection showed that the DMA assessment tools that best predict the aggregate assessment scores were Full Squat Test (Beta (95% CI) = 0.16 (0.06, 0.25); p = 0.004), Single Leg Squat Test (Beta (95% CI) = 0.17 (0.04, 0.31); p = 0.02), Single Leg Hop Test (Beta (95% CI) = 0.09 (0.002, 0.17); p = 0.04), and the right side of the Side Plank Test (Beta (95% CI) = 0.24 (0.14, 0.33); p < 0.001) (Table 2).
|
Model 1 |
p-value |
Model 2 |
p-value |
Adjusted R2 |
|
|
DMA Assessment |
Beta (95% CI)1 |
Beta (95% CI)1 |
|||
|
Full Squat Test |
0.20 (- 0.04, 0.43) |
0.09 |
0.16 (0.06, 0.25) |
0.004 |
0.87 |
|
Step-up Test |
0.16 (- 0.06, 0.38) |
0.14 |
|||
|
Single Leg Squat Test |
0.37 (0.13, 0.61) |
0.005 |
0.17 (0.04, 0.31) |
0.02 |
|
|
Single Leg Hop Test |
0.17 (- 0.03, 0.37) |
0.09 |
0.09 (0.002, 0.17) |
0.04 |
|
|
Plank Test |
0.26 (0.05, 0.46) |
0.02 |
|||
|
Side Plank Test-Right |
0.32 (0.15, 0.48) |
0.001 |
0.24 (0.14, 0.33) |
< 0.001 |
|
|
Side Plank Test-Left |
0.31 (0.16, 0.46) |
0.001 |
Table 2: Linear regression to assess the relationship between each DMA assessment tool to the Aggregate DMA score.
Model 2 calculated using Multiple Linear Regression adjusting for all other predictors in the model following a stepwise variable selection.
1Coefficients represent the percent change in the log aggregate score per 1 unit increase within the separate assessment scores.
The primary outcome of aggregate DMA score observes a normal distribution following a log transformation.
DISCUSSION
The inability to maintain proper knee alignment with single leg activities and the presence of corkscrewing were the two most significant indicators of high aggregate risk scores. Knee adduction or knee valgus past midline correlated with a high risk and represents poor mechanics associated with athletic movements such as cutting [23,24]. Improved biomechanical outcomes with external focus cueing have gained favor over using limb symmetry for double and single-leg testing [25]. The lack of knee stability and poor positioning can be identified in double limb activities such as the functional squat or single-limb squat tests. Use of 2-D motion analysis, as used in our study, identified knee valgus during a single-leg hop test over visual observation [26]. Thus the use of DMA to identify faulty biomechanics in both double and single-leg tests is enhanced with video capture compared to other assessment tools. Our study found that knee valgus with the Single Leg Squat Test, Step-up Test, and Single Leg Hop Test was all related to higher aggregate DMA scores. Both double and single leg tests require trunk control and any trunk displacement will alter lower extremity kinematics [27,28].
Core stability had a negative correlation with high aggregate risk score, as measured by side planks. In addition, core stability has been shown in the literature [24,28] to have an effect on lower extremity injuries. A lack of core stability would cause the pelvis to rotate or tilt [27] similar to the corkscrew compensation demonstrated by athletes in the current study. Trunk endurance testing, based on the McGill battery as described by Werner, et al., [29] would be beneficial to prevent lower extremity re-injury. Whyte [24] proposes a dynamic core stabilization program for 6 weeks to improve core stabilization and in effect decrease risk of lower extremity injury. Core stability and endurance play an important role in a soccer player maneuvering around an opponent while trunk position during a single limb stance during a kick requires postural control [30]. Trunk position predicts lower extremity kinematics, therefore intervention exercises that incorporate trunk strengthening may reduce the potential for athletic injury.
This case series does have multiple limitations. Primarily, the small sample size and inclusion of only female collegiate soccer athletes limits the generalize ability of the study results. Also, this manuscript only discusses the DMA as an assessment tool without a post-season assessment following intervention. Further research is necessary to investigate the effect of biomechanical training and strengthening on risk and injury and the relationship to aggregate scoring of assessment tools.
REFERENCES
- Brophy RH, Schmitz L, Wright RW, Dunn WR, Parker RD, et al. (2012) Return to play and future ACL injury risk after ACL reconstruction in soccer athletes from the Multicenter Orthopaedic Outcomes Network (MOON) group. Am J Sports Med 40: 2517-2522.
- Chomiak J, Junge A, Peterson L, Dvorak J (2000) Severe injuries in football players. Influencing factors. Am J Sports Med 28: 58-68.
- Peterson L, Junge A, Chomiak J, Graf-Baumann T, Dvorak J (2000) Incidence of football injuries and complaints in different age groups and skill-level groups. Am J Sports Med 28: 51-57.
- Ardern CL, Webster KE, Tayler NF, Feller JA (2011) Return to sport following anterior cruciate ligament reconstruction surgery: A systematic review and meta-analysis of the state of play. Br J Sport Med 45: 596-606.
- Kolodziej M, Jaitner T (2018) Single Functional Movement Screen items as main predictors of injury risk in amateur male soccer players. Ger J Exerc Sport Res 48: 349-357.
- Roos K, Marshall S (2014) Definition and usage of the term “overuse injury” in the US high school and collegiate sport epidemiology literature: A systematic review. Sport Med 44: 405-421.
- O’Kane JWO, Neradilek M, Polissar N, Sabado L, Tencer A, et al. (2017) Risk Factors for Lower Extremity Overuse Injuries in Female Youth Soccer Players. Orthop J Sport Med 5: 1-8.
- Owusu-Akyaw KA, Kim SY, Spritzer CE, Collins AT, Englander ZA, et al. (2018) Determination of the Position of the Knee at the Time of an Anterior Cruciate Ligament Rupture for Male Versus Female Patients by an Analysis of Bone Bruises. Am J Sports Med 46: 1559-1565.
- Lislevand M, Andersen TE, Junge A, Dvorak J, Steffen K (2014) Injury surveillance during a 2-day national female youth football tournament in Kenya. Br J Sports Med 48: 924-928.
- Myer GD, Ford KR, Stasi SL Di, Foss KDB, Micheli LJ, et al. (2015) High knee abduction moments are common risk factors for patellofemoral pain (PFP) and anterior cruciate ligament (ACL) injury in girls?: Is PFP itself a predictor for subsequent ACL injury?? Br J Sport Med 49: 118-122.
- Faude O, Junge A, Kindermann W, Dvorak J (2006) Risk factors for injuries in elite female soccer players. Br J Sports Med 40: 785-790.
- Leppanon M, Pasanen K, Kujala UM, Vasankari T, Kannus P, et al. (2016) Stiff Landings Are Associated With Increased ACL Injury Risk in Young Female Basketball and Floorball Players. Am J Sports Med 45: 386-393.
- Nagelli CV, Hewett TE (2017) Should Return to Sport be Delayed Until 2 Years After Anterior Cruciate Ligament Reconstruction? Biological and Functional Considerations. Sport Med 47: 221-232.
- Nilstad A, Andersen TE, Bahr R, Holme I, Steffen K (2014) Risk Factors for Lower Extremity Injuries in Elite Female Soccer Players. Am J Sports Med 42: 940-948.
- Distefano LJ, Frank BS, Root HJ, Padua DA (2017) Dissemination and Implementation Strategies of Lower Extremity Preventive Training Programs in Youth?: A Clinical Review. Sports Health 9: 524-531.
- Stijack L, Kadija M, Djulejic V, Aksi? M, Petronijevi? N, et al. (2015) The influence of sex hormones on anterior cruciate ligament rupture?: Female study. Knee Surg Sport Traumatol Arthrosc 23: 2742-2749.
- Stijak L, Kadija M, Djulejic V, Aksi? M, Petronijevi? N (2015) The influence of sex hormones on anterior cruciate ligament ruptures in males. Knee Surg Sport Traumatol Arthrosc 23: 3578-3584.
- Kernozek TW, Torry MR, Iwasaki M (2008) Gender Differences in Lower Extremity Landing Mechanics Caused by Neuromuscular Fatigue. Am J Sports Med 36: 554-565.
- Grimm NL, Jr JCJ, Kim J, Denney BS, Shea KG (2015) Anterior Cruciate Ligament and Knee Injury Prevention Programs for Soccer Players A Systematic Review and Meta-analysis. Am J Sports Med. 43: 2049-2056.
- Nessler T, Denney L, Sampley J (2017) ACL Injury Prevention: What Does Research Tell Us? Curr Rev Musculoskelet Med 10: 281-288.
- Yoo JH, Lim BO, Ha M, Lee SW, Oh SJ, et al. (2010) A meta-analysis of the effect of neuromuscular training on the prevention of the anterior cruciate ligament injury in female athletes. Knee Surgery, Sport Traumatol Arthrosc 18: 824-830.
- Kazman J, Galecki J, Lisman P, Deuster P, O’Conner F (2014) Factor structure of the functional movement screen in marine officer candidates. J Strength Cond Res 28: 672-678.
- Brown SR, Brughelli M, Hume PA (2014) Knee Mechanics During Planned and Unplanned Sidestepping?: A Systematic Review and Meta-Analysis. Sport Med 44: 1573-1588.
- Whyte EF, Richter C, O’Connor S, Moran KA (2018) Effects of a dynamic core stability program on the biomechanics of cutting maneuvers: A randomized controlled trial. Scand J Med Sci Sport 28: 452-462.
- Benjaminse A, Holden S, Myer GD (2018) ACL rupture is a single leg injury but a double leg problem?: too much focus on ‘ symmetry ’ alone and that ’ s not enough! Br J Sport Med 52: 1029-1030.
- Ramirez M, Negrete R, Hanney WJ, Kolber MJ (2018) Quantifying frontal plane knee kinematics in subjects with anterior knee pain?: the reliability and concurrent validity. Int J Sports Phys Ther 13: 86-93.
- Hewett TE, Ford KR, Hoogenboom BJ, Myer GD (2010) Understanding and preventing acl injuries: current biomechanical and epidemiologic considerations- update 2010. N Am J Sports Phys Ther 5: 234-251.
- Zazulak BT, Hewett TE, Reeves NP, Goldberg B, Cholewicki J (2007) The Effects of Core Proprioception on Knee Injury: A prospective biomechanical-epidemiological study. Am J Sports Med 35: 368-373.
- Werner DM, Barrios JA (2018) Trunk Muscle Endurance in Individuals with and Without a History of Anterior Cruciate Ligament Reconstruction. J Strength Cond Res.
- Silva MG, Struber L, Brandão JGT, Daniel O, Nougier V (2018) Influence of dual-task constraints on the interaction between posture and movement during a lower limb pointing task. Exp Brain Res 236: 963-972.
Citation: Stickler KR, Nessler TR, Kang P, Denney LM (2019) Use of a Case Series to Determine which Sub-scores Best Correlate with the Total Dynamic Movement Assessment Score. J Orthop Res Physiother 5: 046.
Copyright: © 2019 Kellie R Stickler, et al. This is an open-access article distributed under the terms of the Creative Commons Attribution License, which permits unrestricted use, distribution, and reproduction in any medium, provided the original author and source are credited.