Vegetation Drought Analysis in Tunisia: A Geospatial Investigation
*Corresponding Author(s):
Eman GhoneimDepartment Of Earth And Ocean Sciences, University Of North Carolina Wilmington, Wilmington, United States
Tel:+1 9109622795,
Email:ghoneime@uncw.edu
Abstract
Drought is one of the natural hazards that has an immense impact on nations and affects many people every year. In this study, satellite remotely sensed data were employed to estimate multiple drought indices for the growing season over Tunisia for 13 successive years. The Vegetation Condition Index (NDVI), and the Land Surface Temperature (LST) index, were combined to calculate the Vegetation Health Index (VHI). Moreover, the Precipitation Condition Index (PCI) was calculated and added to form a newly modified Vegetation Temperature Precipitation Condition Index (VTPCI). The effectiveness in drought monitoring by these indices was supported by comparing them with the Food and Agriculture Organization (FAO) annual crop yield. These indices indicated that year 2002 was the driest year in Tunisia, a result that was confirmed by the crop yield statistical data. The results revealed that four governorates of the Southern Tunisia are highly prone to drought and that grassland and cropland are the most susceptible vegetation types to drought events in Tunisia. The VTPCI shows higher correlation with the annual crop yield data than the commonly used VHI index, particularly on the sub-national scale, therefore this index is recommended to be adopted to monitor vegetation drought elsewhere in semi-arid regions where surface weather data are scarce.
Keywords
Natural hazards; Satellite land surface temperature; TRMM rainfall data; Vegetation health indices
INTRODUCTION
Various types of satellite-based remote sensing data and remote sensing algorithms have been widely used over the past few decades to effectively monitor the drought phenomenon worldwide. For example, a remote sensing based drought study conducted on China using the HJ-1 and microwave MASR satellite data [12,10], and in India, Philippines and Australia using MODIS data [13,14], confirmed the effectiveness of such data in the national drought monitoring. Moreover, a large number of remote sensing indices based on, for instant, the NDVI-LST relationship such as Vegetation Health Index (VHI), Temperature-Vegetation Drought Index (TVDI), Vegetation Supply Water Index (VSWI), Drought Severity Index (DSI), and Normalized Vegetation Supply Water Index (NVSWI) have been proposed and successfully tested [15-18] .
Many other simple indices based on remote sensing data were proposed to monitor drought. For example, the Normalized Difference Vegetation Index (NDVI), developed by Rouse et al., [19] is based on the ratio between the maximum absorption of radiation in the red channel, due to the leaf’s chlorophyll content and the maximum reflection of radiation in the Near-Infrared (NIR) channel, due to the cell structure of the leaf [20]. The Vegetation Condition Index (VCI) was introduced first by Kogan [21,22] to measure changes in NDVI signal over time. In 1995, Kogan developed TCI (Temperature Condition Index) to normalize temperature data. Later, Kogan developed another index called the Vegetation Health Index (VHI), which is a combination of VCI and TCI. Many studies were carried out in many regions worldwide to evaluate the use of VCI, TCI and VHI indices in drought monitoring [23-25].
In addition to the above remotely sensed drought indices, the inclusion of rainfall conditions is also an important factor for drought studies. The Tropical Rainfall Measuring Mission (TRMM) provides precipitation data needed for comprehensive drought analysis. Rhee et al., [26] proposed the new multi-sensor Scaled Drought Condition Index (SDCI), which combined scaled NDVI, LST and TRMM data with assigned weights (1/4 scaled NDVI + 1/4 scaled LST + 1/2 scaled TRMM). The SDCI outperformed VHI and other existing indices in the arid region of Arizona and New Mexico and also in the humid region of the Carolinas [26]. In the present study, a newly modified drought index, namely Vegetation Temperature Precipitation Condition Index (VTPCI), based on the SDCI, was developed, examined over the study area, and compared against other drought indices. The VTPCI combines the vegetation health, temperature condition and precipitation aspects in order to gain a better understanding of the drought phenomenon in the area under investigation.
The purpose of this paper is threefold. First, to evaluate the potential of a modelling based approach for the detection of vegetation areas sensitive to drought in a data-limited semi-arid nation, such as Tunisia, using information derived from satellite remote sensor data. Second, to provide information on locations at frequent threat of drought and determine which vegetation cover type is more susceptible to frequent drought risk in Tunisia. Third, to perform a comparison of the spatial occurrences of drought detected by commonly used remotely sensed indices with the newly VTPCI index and examine the efficiency of each index using annual crop yield data.
STUDY AREA
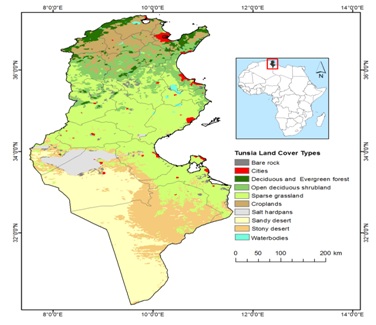 Figure 1: Location of Tunisia in North Africa and the different types of dominant land use/cover in the study area.
DATA AND METHODS
Data and pre-processing procedures
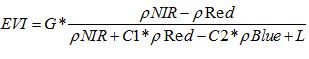
Where ρ are the full or partially atmospheric-corrected (for Rayleigh scattering and ozone absorption) surface reflectance; ???? is the canopy background adjustment for correcting nonlinear, differential NIR and Red radiant transfer through a canopy; C1 and C2 are the coefficients of the aerosol resistance term; and ???? is a gain or scaling factor. The EVI derived from the MODIS Terra MOD13A3 product, the following formula is used:
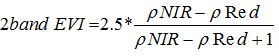
A total of 78 EVI scenes of the study area were downloaded from the U.S. Geological Survey (http://glovis.usgs.gov/) and converted from sinusoidal projection to 1 km gridded geotiff Albers Area Projection (WGS84), using nearest neighbor resampling method. Since the objective of the study is to monitor and analyze the vegetation drought in Tunisia, a mask file of the most possible vegetation coverage was created for the study area.
For Land Surface Temperature (LST) data, the MODIS Terra MOD11A1 product, with a 1-km spatial resolution, daytime data with 8-day average coverage (four scenes per month) was used. A total of 312 MODIS-LST images were downloaded, re-projected, masked out and temperature values were converted from Kelvin to degree Celsius. Due to the cloud contamination of several LST images, the best scene out of the four available scenes for each month has been included in the analysis. Moreover, the Low-Pass filtering algorithm was applied to each scene in order to minimize the amount of missing data in some LST scenes and produce more homogeneous images [33].
Drought originates mostly from a shortage of rainfall over a protracted time period [34]. For the precipitation data, the Tropical Rainfall Measuring Mission (TRMM) 3B43 product was used to characterize rainfall amount and spatial distribution over the study area. TRMM is a joint mission between NASA and the National Space Development Agency (NASDA) of Japan and was launched on the 27th of November, 1997.
The land cover data for Tunisia were obtained from the NASA’s Earth Observing System Data and Information System (EOSDIS). MODIS Land Cover MCD12Q1 product was chosen for the present study. This product provides a detailed vegetation biomass cover with a spatial resolution of 500 meters. According to the Food and Agriculture Organization (FAO) of the United Nations [35], wheat is the most extensive crop in Tunisia, which accounts for almost 80% of total production. Nation-wide annual wheat yield data were obtained from the FAO Statistical Division dataset (http://faostat3.fao.org) for the period of 2000-2013 to validate the modeled drought maps. Moreover, the annual crop yield data for the period of 2000-2008 for one of the most agro-productive regions of Tunisia, Siliana governorate, were obtained and used to estimate the efficiency of the remote sensing drought indices on the local scale [36].
Methodology
The VCI was first proposed by Kogan [22] and related to the long-term minimum and maximum NDVI. The assumption of VCI for drought monitoring is that a harsh drought will affect vegetation growth and result in the lowest values (closer to zero) in the multiyear observations. Conversely, the highest VCI values (closer to 100) will represent an optimal climatic condition [4]. The VCI is a pixel based normalization of the NDVI and it is calculated using the following formula (in the present study, the NDVI values were replaced with EVI ones):
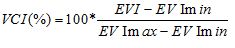
EVImax and EVImin are the absolute multi-year maximum and minimum, respectively, calculated by the corresponding pixels in the same month from the entire EVI records (2000-2013). VCI values range between 0 and 100 (%), reflecting relative change in the vegetation condition from extreme to optimal. Monthly VCI values for the entire dataset were calculated for the study area.
The TCI, also proposed by Kogan [22], proposed that drought episode will cause a land surface thermal stress and a reduction in soil moisture which could trigger higher temperature values in the drought year than the same month of non-drought years. Accordingly, a low surface temperature in the vegetation growing season indicates more favorable conditions while high land surface temperature shows unfavorable drought conditions. The TCI can be estimated using the following formula:
 Where LST is the average temperature value for the current month, LSTmax and LSTmin are the absolute maximum and minimum temperature values, respectively.
 The VHI is a weighted average of the above two indices (VCI and TCI) that represents the overall vegetation health for the area under investigation [21]. The VHI can be calculated using the following formula:
While VHI has proven to be a fairly good indicator of drought conditions in low-latitudes, mainly in arid, semi-arid, and sub-humid climatic regions, this drought index only accounts for the vegetation condition and the land surface temperature [37]. As indicated earlier, abnormally low rainfall is the primary cause of drought. Therefore, the importance of the precipitation as an influencing factor should be also considered in a comprehensive drought analysis. TRMM Accumulated Rainfall in millimeters with 3-hour intervals was obtained as a set of 0.25° x 0.25° gridded data in ASCII format. These data were imported and averaged in Excel to provide a monthly rainfall data. All the monthly data were then uploaded to ArcGIS and converted to shapefiles. Using the Kriging algorithm, the point data were interpolated to provide continuous rainfall data for each month (2000-2013) in the raster format. The Kriging method estimates unknown values from observed values at surrounding locations based on regression against values of surrounding data points. This interpolation technique proved to be successful for an application with scarce precipitation data availability [38]. The Precipitation Condition Index (PCI), based on microwave remote sensed TRMM precipitation, was recently proposed by Zhang and Jia [10]. The PCI was calculated using the following formula:
The VHI index can be used to monitor drought from vegetation and soil temperature aspects, whereas the PCI index accounts for the rainfall condition only. Until recently; however, no indices could suitably reflect the comprehensive information of drought from both meteorological and agricultural aspects. Rhee et al., [26] proposed a new remote sensing-based drought index, known as the SDCI. This index was utilized for agricultural drought monitoring in both arid and humid regions and uses multi-sensor data. SDCI performed better than existing remote sensing drought indices in the arid region of Arizona and New Mexico as well as in the humid region of the Carolinas [26]. In line with the previous SDCI, a newly modified drought index (named VTPCI) from the SDCI, was adopted in the present study. The VTPCI combines the VCI, TCI, PCI values using the following formula:

Land Use Land Cover (LULC)
Efficiency estimation of VHI and VTPCI using crop yield data
Several researchers suggest that the variation in final crop yield is explained by plants phenological cycle [4,26,39,40]. Therefore, wheat growing stages for the Tunisia region were also considered and incorporated in the analysis. According to the USDA/Foreign Agriculture Service reports for Tunisia (www.thecropsite.com/reports/?id=3644), wheat flowering in Tunisia occurs in March, harvest follows in June/July, but most importantly, April serves as the most critical month for moisture, because plants are in their grain-fill stage and heavily rely on water to boost the grain weight. April rainfall is the most influential factor in the local farmer decision-making. Thus, yearly April drought data along with the multi-year annual mean drought data for both VHI and VTPCI were investigated in the analysis. The drought affected areas identified by VHI and VTPCI as drought-prone were calculated on a pixel basis, with the scaled index values below 30 (extreme, severe and moderate drought combined). The derived crop mask was applied to limit the analysis to agricultural areas only. Linear regression analysis was employed to investigate the strength of the correlation between the crop yield data and those areas indicated by the studied drought indices in order to estimate their effectiveness.
RESULTS AND DISCUSSION
Spatial and temporal comparisons of remote sensing drought indices
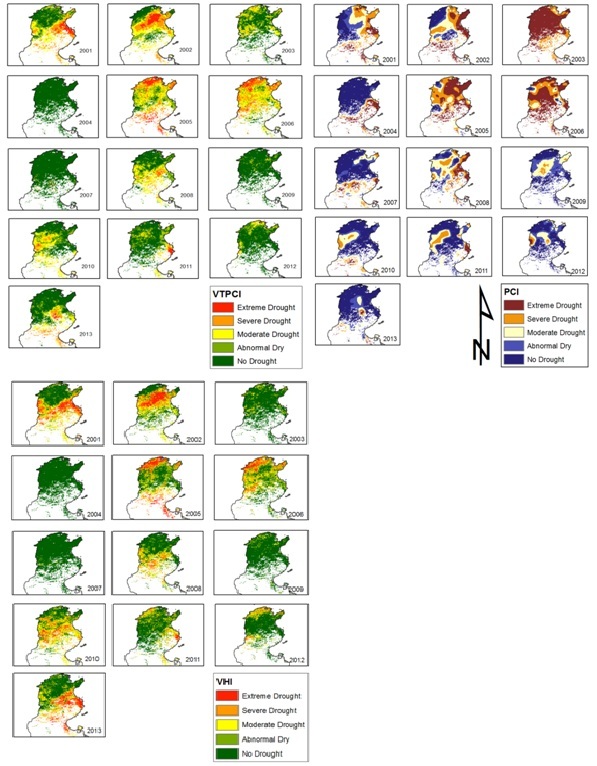 Figure 2: Distribution of VHI, PCI and VTPCI for March for years 2001 through 2013.
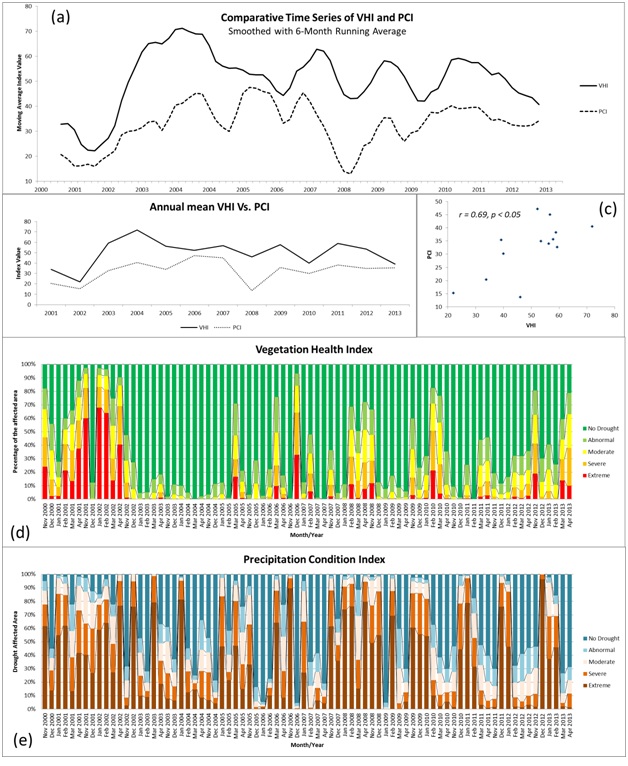 Figure 3: Temporal variations in VHI and PCI: (a) In a time series smoothed with 6-month running average (b) Annual mean VHI vs. annual mean PCI (c) The correlation scatterplot (d) Time series of proportion of study area in each drought severity category identified by VHI (e) Time series of proportion of study area in each drought severity category identified by PCI.
| Drought Indices Values | Drought Conditions |
| <10 | Extreme drought |
| 10-20 | Severe drought |
| 20-30 | Moderate drought |
| 30-40 | Abnormal dry |
| >40 | No drought |
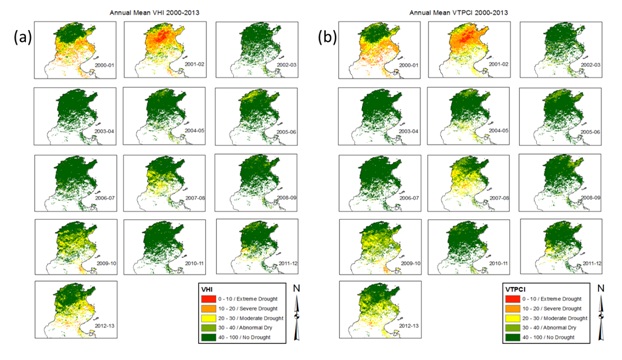 Figure 4: Spatial distribution of annual mean (a) VHI and (b) VTPCI.
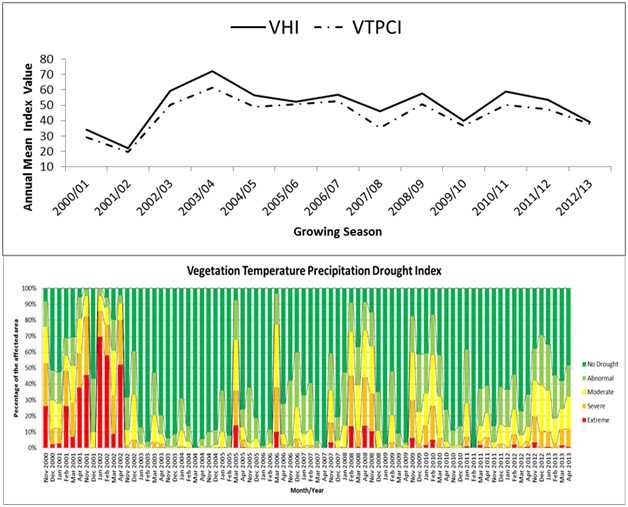 Figure 5: (a) Time series of annual mean VHI versus annual mean VTPCI, (b) Temporal distribution of mean VTPCI versus the amount of drought affected areas.
Evaluation of VHI and VTPCI using LULC and crop Yield data at the national scale
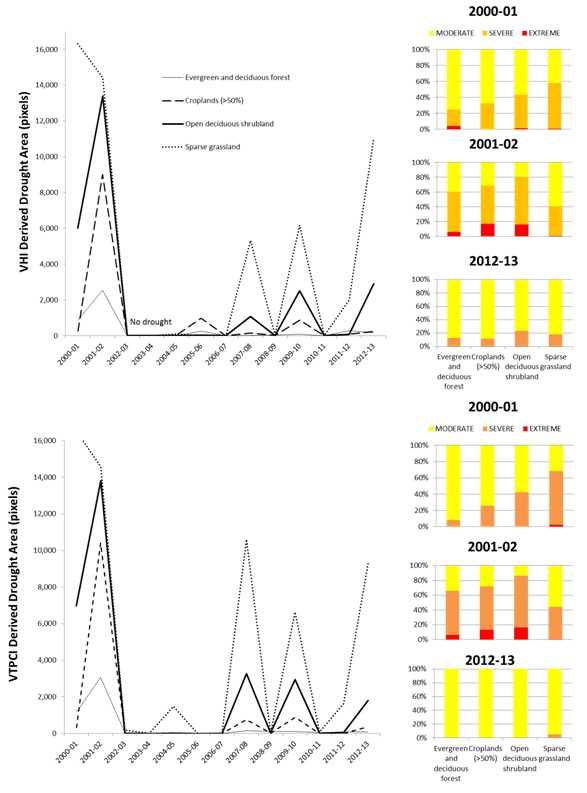 Figure 6: Vegetation response to drought derived from VHI (upper figure) and VTPCI (Lower figure). It shows that the most vulnerable vegetation type to drought conditions is sparse grassland, whereas evergreen and deciduous forests are the least susceptible to changing drought conditions.
The cropland cover also appeared to be susceptible to dry conditions. Both indices generally showed similar behavior throughout the time series, with the exception of 2005/06 period, when VHI index was able to detect the cropland and the forest response to the effects of drought. Visual inspection of the annual mean VHI spatial distribution for the 2005/06 season together with the LULC, revealed that the areas affected by moderate drought lie within the cropland and the deciduous forest land cover. Both indices highlighted the 2001/02 season as the most crucial with more than 10% of the affected croplands experiencing extreme drought conditions. Both VHI and VTPCI revealed that cropland was hit hard in 2002, but it recovered quickly in 2003. This suggests that cropland is sensitive to drought, but it is also resilient and is able to recover fast.
The relevance of using VHI and VTPCI indices in terms of drought monitoring was tested through the correlation between the area affected by drought, according to VHI and VTPCI, versus the wheat yield for the entire region. Regardless of the small sample size (13 consecutive years of observations) and at a significance level (α) of 0.10, there was a moderate but significant (p = 0.08) inverse correlation, between the national crop yield and the size of the area experiencing extreme drought (Table 2). It is worth noting that many factors such as, soil quality, atmospheric conditions, water distribution, and socio-economic stability affect crop yield. Moreover, variation in crop yield is influenced by pests, diseases, fertilizers and farm management practices. Since these numerous elements affect crop yield, an absolute correlation was not expected from the computed satellite-derived indices.
| Targeted Land Cover Type | Temporal Extent | Drought Index/ Severity Type | VHI | VTPCI |
| National Cropland Cover | Annual | 0 - 30 Combined | - 0.60 | - 0.56 |
| March | 0 - 30 Combined | - 0.83 | - 0.75 | |
| April | 0 - 30 Combined | - 0.34 | -0.44 | |
| Sub-National Cropland Cover | Annual | 0 - 30 Combined | - 0.60 | - 0.56 |
| April | 0 - 30 Combined | - 0.83 | -0.85 |
A time series clearly shows the relationship between drought index values and crop yields over the past 13 years (Figure 7). The results show that correlation coefficient values are higher in March (-0.83 and -0.75) than April (-0.34 and -0.44) for VHI and VTPCI. This could be ascribed to wheat flowing in March. Results also indicated that VTPCI are higher in April compared to VHI which could be due to the grain filling stage when precipitation is critical. In contrast, the VTPCI is slightly lower than VHI in March, as a consequence of the excessive rainfall during the flowering stage that makes wheat more susceptible to scabs disease, as explained by Herbek and Lee [42], leading to decreased yield. Consequently, including the precipitation in the index efficiency analysis may have lowered the March correlation coefficients values.
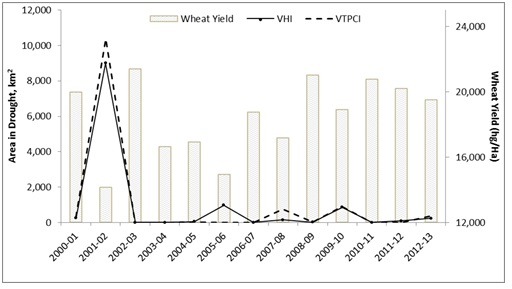 Figure 7: National wheat yield and annually averaged VHI and VTPCI for Tunisia (correlation coefficients r = -0.60 and r = - 0.56, respectively).
Comparison of VHI and VTPCI performance at the sub-national scale
Correlation analysis showed that both VHI and VTPCI indices performed slightly better in estimating drought at the regional scale (0.61 and 0.66, respectively) than at the national scale (0.60 and 0.56, respectively). This result demonstrates the high relevance of VHI and VTPCI indexing for spatial monitoring of agricultural drought. Additionally, the VTPCI outperformed VHI in terms of correlation coefficients at both national and regional scale (Table 2). The higher correlation of April month of VTPCI (0.85) than VHI (0.83) suggests a strong negative relationship of VTPCI drought index with crop yield during the wheat grain filling stage.
Identification of drought-prone administrative districts in Tunisia
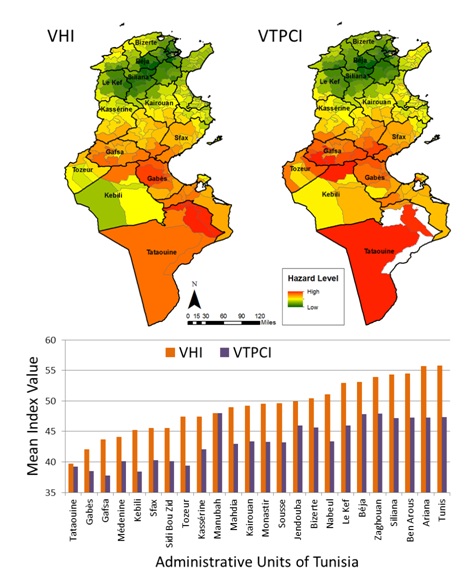 Figure 8: Distribution of VHI and VTPCI mean values within governorates and sub-governorates units of Tunisia.
CONCLUSION
Remote sensing is a useful tool for drought study, particularly in large areas with limited access due to security restrictions as in the present study site (since the start of the Arab Spring in 2011). The method conducted is a low cost approach, a repeatable procedure and a viable alternative to field measurements for drought analysis and monitoring on the national scale. Tunisia witnessed its worst drought in the year 2002. This finding is consistent with the report of FAO [35], which based on analyzed tree-ring records, considered the 2002 drought to be the worst drought year in Tunisia since the mid-15th century. With this information, Tunisian officials could make informed land management decisions including where to continue with agricultural endeavors and where to protect pasture lands and forested areas. The approach used in this study allows for rapid identification of drought hotspot in Tunisia and highlights those areas and districts that are prone to extreme and severe drought. This information is essential for future agricultural and rangeland planning purposes and could be used to help decision makers enact appropriate protection measures to alleviate future drought events. The proposed procedures could be adapted, with appropriate modifications, to other countries in the Middle Eastern region.
ACKNOWLEDGMENT
REFERENCES
- Heim RR (2002) A review of twentieth-century drought indices used in the United States. American Meteorological Society 83: 1149-1165.
- Bayarjargal Y, Karnieli A, Bayasgalan M, Khudulmur S, Gandush C, et al. (2006) A comparative study of NOAA-AVHRR derived drought indices using change vector analysis. Remote sensing of Environment 105: 9-22.
- Li X, Zhang Q, Ye X (2013) Dry/Wet Conditions Monitoring Based on TRMM Rainfall Data and Its Reliability Validation over Poyang Lake Basin, China. Water 5: 1848-1864.
- Du L, Tian Q, Yu T, Meng Q, Jancso T, et al. (2013) A comprehensive drought monitoring method integrating MODIS and TRMM data. International Journal of Applied Earth Observation and Geoinformation 23: 245- 253.
- Wetherald RT, Manabe S (2002) Simulation of Hydrologic changes associated with global warming. Journal of Geophysical Research 107: 1-15.
- Trenberth K, Overpeck J, Solomon S (2004) Exploring drought and its implications for the future. EOS 85: 27.
- Lin ML, Chen CW (2011). Using GIS-based spatial geocomputation from remotely sensed data for drought risk-sensitive assessment. International Journal of Innovative Computing, Information and Control 7: 657-668.
- McKee TB, Doesken NJ, Kleist J (1993) The Relationship of Drought Frequency and Duration to Time Scales. Eighth Conference on Applied Climatology, Anaheim, California. 17-22.
- Ghoneim E (2009) A Remote Sensing Study of Some Impacts of Global Warming on the Arab Region. In: Tolba MK, Saab NW (eds.). Arab Environment: Climate Change, The Arab Forum for Environment and Development (AFED), Chapter 3: 31-46.
- Zhang A, Jia G (2013) Monitoring meteorological drought in semiarid regions using multi-sensor microwave remote sensing data. Remote Sensing of Environment 134: 12-23.
- Ghoneim E, Mashaly J, Gamble D, Halls J, AbuBakr M (2015) Nile Delta exhibited a spatial reversal in the rates of shoreline retreat on the Rosetta promontory comparing pre- and post-beach protection Geomorphology 228: 1-14.
- Yang B, Wang Q, Wang C, Wan H, Yang Y, et al. (2010) Drought monitoring in North China using HJ-1 satellite remote sensing data. Proceedings of the SPIE 7841.
- Parida BR, Oinam B (2008) Drought monitoring in India and the Philippines with satellite remote sensing measurements. EARSeL eProceedings 7: 81-91.
- Caccamo G, Chisholm LA, Bradstock RA, Puotinen ML (2011) Assessing the sensitivity of MODIS to monitor drought in high biomass ecosystems. Remote sensing of Environment 115: 2626-2639.
- Sandholt I, Rasmussen K, Andersen J (2002) A simple interpretation of the surface temperature/vegetation index space for assessment of surface moisture status. Remote Sensing of the Environment 79: 213-224.
- Carlson TN, Gillies RR, Perry EM (1994) A method to make use of thermal infrared temperature and NDVI measurements to infer surface soil water content and fractional vegetation cover. Remote Sensing Review 9: 161-173.
- Mu Q, Zhao M, Kimball JS, McDowell NG, Running SW (2013) A remotely sensed global terrestrial drought severity index. Bulletin of the American Meteorological Society 94: 83-98.
- Abbas S, Nichol N, Qamer F, Xu J (2014) Characterization of Drought Development through Remote Sensing: A Case Study in Central Yunnan, China. Remote Sensing 6: 4998-5018.
- Rouse JW, Haas RH, Schell JA, Deering DW (1974) Monitoring vegetation systems in the Great Plains with ERTS. Proceedings, Third Earth Resources Technology Satellite-1 Symposium, Greenbelt: NASA, 309- 317.
- Campbell JB (2006) Introduction into Remote Sensing, (4thedn). Guilford Publications, New York, USA.
- Kogan FN (1997) Global drought watch from space. Bulletin of the American Meteorological Society 78: 621-636.
- Kogan FN (1995) Application of vegetation index and brightness temperature for drought detection.
- Tsiros E, Domenikiotis C, Spiliotopoulos M, Dalezios NR (2004) Use of NOAA/A VHRR-based Vegetation Condition Index (VCI) and Temperature Condition Index (TCI) for drought monitoring in Thessaly, Greece.
- Bhuiyan C, Singh RP, Kogan FN (2006) Monitoring drought dynamics in the Aravalli region (India) using different indices based on ground and remote sensing data. International Journal of Applied Earth Observation and Geoinformation 8: 289- 302.
- Zarei R, Sarajian M, Bazgeer S (2013) Monitoring Meteorological Drought in Iran Using Remote Sensing and Drought Indices. Desert 18: 89-97.
- Rhee J, Im J, Carbone GJ (2010) Monitoring agricultural drought for arid and humid regions using multi-sensor remote sensor data. Remote Sensing of Environment 114: 2875 - 2887.
- IPCC (2007) The Physical Science Basis. In: Solomon S, Qin D, Manning M, Chen Z, Marquis M, et al., (eds.). Contribution of working group I to the fourth assessment report of the Intergovernmental Panel on Climate Change. Cambridge United Press, Cambridge, United Kingdom and New York, USA. Pg no: 996.
- Beaumont P (2002) Water policies for the Middle East in the 21st century: The New Economic Realities. International Journal of Water Resources Development 18: 315 - 334.
- Baban Serwan MJ, Foster Ian DL, Tarmiz B (1999) Environmental protection and sustainable development in Tunisia: an overview. Sustainable Development 7: 191-203.
- Liu HQ, Huete AR (1995) A feedback based modification of the NDV I to minimize canopy background and atmospheric noise. IEEE Transactions on Geoscience and Remote Sensing 33: 457-465.
- Huete A, Justice C, Leeuwen WV (1999) Modis Vegetation Index (mod 13) Algorithm Theoretical Basis Document. The Allen Institute for Artificial Intelligence, Washington, United States.
- Bolton KD, Friedl MA (2013) Forecasting crop yield using remotely sensed vegetation indices and crop phenology metrics. Agricultural and Forest Meteorology 173: 74-84.
- Williamson SN, Hik DS, Gamon JA, Kavanaugh JL, Flowers GE (2014) Estimating temperature fields from MODIS Land Surface Temperature and air temperature observations in a sub-arctic alpine environment. Remote Sens 6: 946-963.
- Knutson C, Hayes M, Phillips T (1998) How to Reduce Drought Risk. Western Drought Coordination Council, Nebraska, USA.
- Food and Agriculture Organization of the United Nations (2004) Progress Achieved in Developing Strategies for Drought Mitigation and Preparedness Planning in the Near East Region. Food and Agriculture Organization of the United Nations, Doha, Qatar.
- Bergaoui M, Lopez-Francos A (2010) The drought impact on agricultural crop production in Tunisia. Economics of drought and drought preparedness in a climate change context, Zaragoza, Options Méditerranéennes 95: 71-74.
- Karnieli A, Bayasgalan M, Bayarjargal Y, Agam N, Khudulmur S, et al. (2007) Comments on the use of the Vegetation Health Index over Mongolia. International Journal of Remote Sensing 27: 2017-2024.
- Wagner P, Fiener P, Wilken F, Kumar S, Schneider K (2012) Comparison and evaluation of spatial interpolation schemes for daily rainfall in data scarce regions. Journal of Hydrology 464-465: 388- 400.
- Smith RCG, Adams J, Stephens DJ, Hick PT (1995) Forecasting Wheat Yield in a Mediterranean- type Environment from the NOAA Satellite. Australian Journal of Agricultural Research 46: 113-125.
- Vicente-Serrano SM, Gouveia C, Camarero JJ, Beguería S, Trigo R, et al. (2013) Response of vegetation to drought time-scales across global land biomes. Proceedings of the National Academy of Sciences of the United States of America 110: 52-57.
- Wan Z, Wang P, Li X (2004) Using MODIS Land Surface Temperature and Normalized Difference Vegetation Index products for monitoring drought in the southern Great Plains, USA. Remote Sensing, 25: 61-72.
- Herbek J, Lee C (2009) A Comprehensive Guide to Wheat Management in Kentucky. Growth and Development 6-12.
Citation: Ghoneim E, Dorofeeva A, Benedetti M, Gamble D, Leonard L, et al. (2017) Vegetation Drought Analysis in Tunisia: A Geospatial Investigation. J Atmos Earth Sci 1: 002.
Copyright: © 2017 Eman Ghoneim, et al. This is an open-access article distributed under the terms of the Creative Commons Attribution License, which permits unrestricted use, distribution, and reproduction in any medium, provided the original author and source are credited.