Acoustic Survey of an Estuarine Marine Protected Area and of its Close Vicinity: Analysis and Monitoring Prospective
*Corresponding Author(s):
Jean GuillardCentre Alpin De Recherche Sur Les Reseaux Trophiques Et Les Ecosystemes Limniques, UMR Carrtel, INRA, USMB, 75 Bis, Avenue De Corzent, F-74203 Thonon-les-Bains Cedex, France
Tel:33 0 4 50 26 78 51,
Email:jean.guillard@inra.fr
Abstract
Facing the loss of fish biodiversity and the decrease of fish stocks since several decades, a proposed solution is the multiplication of Marine Protected Areas (MPA). In Senegal, one MPA has been implemented in 2003 in one of the channels composing the Sine Saloum estuary. A monitoring program was carried out based on hydro-acoustic survey and the two main metrics extracted from hydro-acoustic data: Fish biomass proxy and fish size distribution proxy. The surveys were performed using vertical beaming at different seasons from 2003 to 2010. In the MPA, a light increase of the fish biomass proxy and an increase of the fish size proxy during the dry season were observed. The biomass proxy recorded in a close but not protected tributary were higher than in the MPA, probably due to a strong connection with open marine water, aggregative behavior of preys in the MPA due to higher predation, and a stronger avoidance phenomenon in the MPA. The high variability of the MPA environment submitted to both estuarine and marine influences and the size of the MPA may explain the lack of clear results. However, the learned lessons enable us to make recommendations to monitor fish population in MPAs using hydroacoustic methods. Evaluation procedures using these methods are proposed highlighting the importance of a rigorous survey protocol to insure the exploitation of the entire acquired time series.
Keywords
INTRODUCTION
In Senegal (West Africa), the Sine-Saloum estuary is characterised by an important mangrove forest, an inverse salinity due to freshwater input scarcity and high evaporation, and a high biodiversity of fish population [11,12]. Because of its important ecological [11] and economical roles [13,14] it was essential to preserve this ecosystem. The Sine-Saloum estuary (800 km²) is made up of three main channels, Saloum, Diomboss and Bandiala, from North to South. These three main channels are interconnected by a network of small channels, including the Bamboung channel (Figure 1), where a MPA has been implemented in 2003 [15]. This MPA is a no-take area where fishing is completely banned [15,16]. Under these conditions and since its creation, the Bamboung MPA is monitored using hydro-acoustical methods to survey its fish assemblage [17].
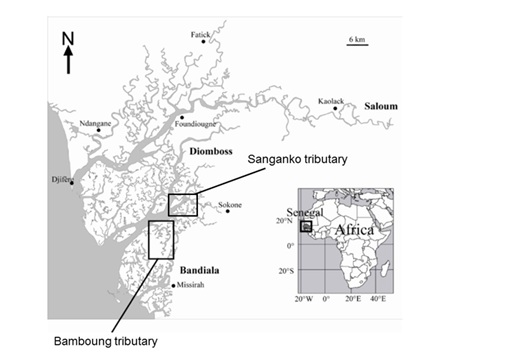 Figure 1: Map of the Sine-Saloum estuary and the tributaries studied: The Bamboung tributary, where is the MPA and the Sangako tributary.
Hydro-acoustics is a widely used approach to monitor fish population in various environments [18] including estuaries in temperate and tropical areas [19-22]. This non-intrusive method provides high resolution observations, allowing the monitoring of fish stocks at large scales [18]. Using acoustic data collected from 2003 to 2010 in the Bamboung MPA, and from 2008 to 2010 in a surrounding area, the main objectives of this work are: 1/ to describe the fish assemblage changes over time in the MPA in terms of fish biomass and fish size, 2/ to evaluate the influence of the MPA onto the outside close area on fish biomass, and 3/ to document and discuss the inputs and limits of this approach in such an ecosystem, and more generally, of the use of the hydro-acoustics for MPA’s monitoring.
MATERIALS AND METHODS
Study site
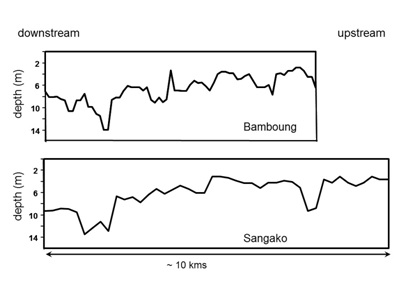 Figure 2: Bathymetry of the Bamboung and Sangako tributaries from left to right going upstream.
Experimental protocol
|
Date |
Season |
BBG |
SGK |
|
17/10/2003 |
Wet |
X |
|
|
10/3/2004 |
Dry |
X |
|
|
26/10/2005 |
Wet |
X |
|
|
23/03/2006 |
Dry |
X |
|
|
12/10/2006 |
Wet |
X |
|
|
2/4/2008 |
Dry |
X |
X |
|
13/10/2008 |
Wet |
X |
X |
|
7/4/2009 |
Dry |
X |
X |
|
7/10/2009 |
Wet |
X |
X |
|
16/03/2010 |
Dry |
X |
X |
|
13/10/2010 |
Wet |
X |
X |
The used equipment was a SIMRAD EY500 echosounder, with a split-beam 120 kHz transducer, beaming vertically fixed to the side of the boat at 0.50 m below the surface. The transducer was circular, with a total beam angle of 7.1° at -3 dB, the pulse length used was the medium one (0.3 ms) [26]. Windy conditions preclude the use of horizontal beaming [30].
Acoustic data processing
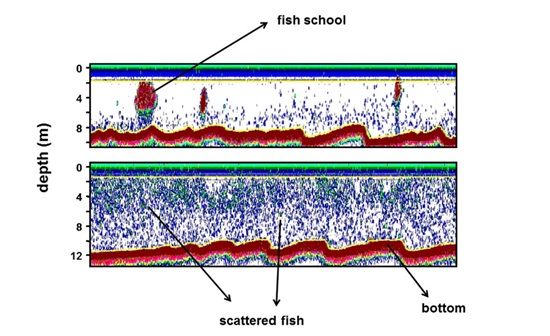 Figure 3: Examples of two echograms, (up) showing the school structure and (bottom) showing the assemblage with scattered fish.
RESULTS
Changes of fish assemblage inside the MPA from 2003 to 2010
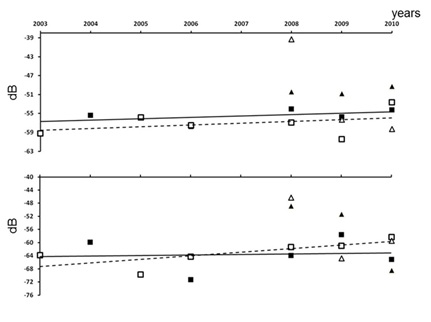 Figure 4: Change of mean Sv values (in dB) per year in the Bamboung (squares) and in the Sangako (triangles) tributaries: Black is the dry season and white the wet season. The upper figure shows the results including the schools, and the lower one excluding them.
|
Areas |
Sv |
TS |
||
|
Bamboung |
with schools |
Wet/Dry |
0.5127 |
NA |
|
without school |
Wet/Dry |
0.5127 |
0.0209 |
|
|
with/without schools |
Wet |
0.1266 |
NA |
|
|
with/without schools |
Dry |
0.0495 |
NA |
|
|
Sangako |
with schools |
Wet/Dry |
0.5127 |
NA |
|
without school |
Wet/Dry |
0.8273 |
0.0495 |
|
|
with/without schools |
Wet |
0.2752 |
NA |
|
|
with/without schools |
Dry |
0.5127 |
NA |
|
|
Bamboung/Sangako |
with schools |
Wet |
0.5127 |
NA |
|
without school |
0.8273 |
0.2752 |
||
|
with schools |
Dry |
0.0495 |
NA |
|
|
without school |
0.5127 |
0.2752 |
The mean TS for the wet season of the fish assemblage did not show any change over time, conversely to the mean TS in the dry season, which increased over the years but not statistically significantly (at a p level of 0.05) (Figure 5). However, the mean acoustic sizes in the dry season were larger than those in the wet season, with a highly significant difference (Table 2).
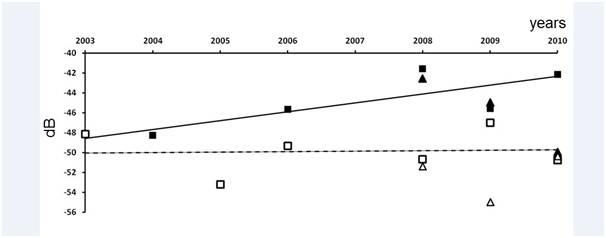 Figure 5: Change of mean TS (in dB) per year in the Bamboung (squares) and in the Sangako (triangles) tributaries: Black is the dry season and white the wet season.
Fish assemblage inside the Sangako tributary
Comparison between inside and outside the MPA
DISCUSSION
Due to practical and safety reasons, acoustic data have been collected only during daytime. Several acoustic studies have shown that if night-time datasets are different from daytime datasets [38,39], there is a positive significant correlation between the acoustic densities obtained for the two periods [40]. Thus, even if night-time data may be more accurate (the fish is usually scattered, that allows the extraction of a higher number of individual targets, and provides a more homogeneous distribution of the fish), the analysis of daytime data can be accepted as it has been done in other aquatic ecosystems [27,41].
Horizontal acquisitions are often used in this type of environment [20,42], but they are difficult to perform under windy conditions and data are difficult to analyse [30,43]. Furthermore, despite works exploring the biases in horizontal data analysis [20], vertical beaming provides more accurate data than horizontal beaming, as there is less variability in the fish answers relative to its sound directivity. The mean depth of the tributaries allowed to work in vertical beaming in an appropriate way as shown by Guillard et al. [26,44]. Surveys were carried out with a comparative approach and did not aim at obtaining absolute stock estimates.
For TS analysis, the number of targets in such a shallow environment is too low. So, after trying several spatial resolutions, it has been necessary to analyse the tributaries in their whole, and to use the overall average results.
According to the acoustic biomass proxy, Sv, the fish density lightly increased from 2003 to 2010 in the Bamboung tributary but the trends were not statistically significant. For the TS data recorded during the dry season, the trend was an increase over the years, with a low statistical significance (p<0.2) due to the low number of samples. The increase of the mean fish size in the protected area was in accordance with observations done in similar ecosystems [45,46]. During the wet season, the recruitment leaded to lower values of TS, due to the presence of small fish; TS were statistically different from those in the dry season, but no trend was apparent throughout the years. It clearly evidences the importance of the young fish in the population after the recruitment periods, which may have hidden the more permanent trends.
The densities recorded during the dry season were higher in the Sangako than in the Bamboung. No such conclusion can be inferred from the wet season data, however for 2 of the 3 years, this was still true. Keeping in mind that this observation was made on a sample of only 3 years, some interpretations can be considered. According to the orientation of the Sangako tributary relative to the main channel, straight connected to the sea, these acoustic results question a possible marine influence that may be higher on the Sangako than on the Bamboung tributary. This configuration could lead to more exchanges between the tributary and the marine zone. Furthermore, as more bigger fish (i.e., top predators) were observed inside the Bamboung MPA than outside [47], fish may form numerous small schools, a well-known aggregative behaviour against predators [48-50]. Finally, avoidance behaviour [51-53], could be more developed in the Bamboung MPA than in the other tributaries. Fishing being prohibited inside the MPA, boats passing through it are scarce conversely to the Sangako tributary which is edged by numerous villages and is highly fishery exploited. Thus, fish schools inside the MPA got less used to boat noises, and schools of bigger fish could easily escape and avoid detection, more than schools from other zones where passing boats and fishing activities are substantial. The fish size composition for the tributaries of Bamboung and of Sangako did not show significant differences, whereas fishing was recorded in the Sangako: Monitor fish assemblage within a shallow MPA using hydroacoustics, was a challenge [20,54] although it is feasible.
Due to practical constraints, the data proved to be not enough regular or time series not enough long to provide statistically significant conclusions on the change of the biomass, size distributions of the fish assemblage in the close vicinity of the MPA, especially due to the great connectivity of this area with outside channels and the small size of the protected area. Acoustic approaches should be appropriate for MPAs monitoring because of their non-intrusive characteristics, and of their high-resolution data acquisition in such a highly variable environment. But they ought to be complementary to traditional sampling techniques in estuarine environments [55-57]. The Bamboung fish assemblage is unusual for an estuarine environment, because there are no species of continental origin: Fresh water comes only from rain and some resurgence and not from fluvial sources. In this particular context, the estuary and the mangrove play their nursery role [58], and the population was dominated by marine-estuarine and estuarine-marine species. Strict estuarine species were poorly represented and therefore the stable part of the population was weakly represented. This implies that even without a strong variability of the environment, the population itself will undergo strong seasonal variations due to ontogenetic migrations. The seasonal cycle in the Bamboung tributary can be outlined as follows [47]:
End of rainy season: Entry of juveniles of marine origin causing a high abundance increase of small individuals. This leads to a higher specific diversity and to a decrease of the mean sizes.
End of dry cool season: Recruitment inside and outside the MPA continues along with the juveniles grow. This leads at this season, to an increase of the abundance, and to a peak of biomass and mean sizes.
End of dry warm season: Species are mainly in a phase of maturation, and start to leave the tributary to get into the marine environment. Biomass and abundance of the marine species strongly decrease; the mean size of the assemblage decreases also compared to the end of the dry cool season.
The assemblage from marine origin has a strong influence on this cycle, it produces an inter-season variability as a large amount of these species leaves the tributary for reproduction, and permanent species are scarce. This effect can be observed differently depending on the estuaries, but is highly significant in the case of an atypical estuary such as the Saloum, resulting in important biomass exports which may hide the positive effects within the MPA.
Our observations were consistent with such trends. Nevertheless to ensure reliable and statistically significant measurements, in order to follow the variations of biomass and size structure indicators in such variable environments, a precise application of a standard protocol is essential. Thus, any variability due to the experimental protocol is contained. The standard protocol is defined by the acquisition procedure, but is also constrained by the environmental conditions. In addition to the disturbance caused by boats, other parameters may cause variability such as the seasons [26], the effects of brightness or tides [59]. It is necessary to overcome the variability caused by these parameters by performing the surveys in strictly similar environmental conditions. When patterns are well described, it is later possible to focus on one or two periods of the year. Moreover, in such estuaries, tributaries are in connection with each others. As a complement to surveys, the migrations inwardly and outwardly from the protected areas, should therefore be accurately studied, to clarify the trends observed for the fish assemblage. Fixed transducers could be set at the entrance of the tributary, coupled with environmental probes (temperature, light, turbidity) and flow meters, to analyse the migration rhythms between the main channel and the protected area. In order to overcome the avoidance phenomenon, it could be added in the monitoring protocol of MPAs, data acquisition at moored stations during day and night [26]. It could provide a better understanding of the behaviour of fish populations, increase the number of individual TS, and so improve the understanding of ecosystem functioning. In the same way, to extend observations Unmanned Vehicle (UVs) technology which is developing rapidly can improve data collection [60,61]. It seems absolutely necessary to perform a prior assessment of the environment, in areas that are planned to be closed for protection, in order to define and to perform a proper survey protocol. For this purpose and even, upstream of it, a whole study of the biological information on targeted species, physical information’s on hydrodynamics, bathymetry, etc. must be done [62], and the method of mapping fish habitat [63] for example may support the choice of the areas to be protected. Then some remote sensing measurements of environment parameters [64] may be useful to define monitoring protocol. In addition, Moffitt propose to define spatial and time scales used to evaluate the efficiency of a MPA, in terms of “generation time” and “dispersal units” (the latter also previously mentioned by Kenchington [65], instead of absolute duration or distance. The scales are thus clearly related to the concerned assemblages. They indicate also that the assessment of the efficiency of a MPA by means of a time series approach provides better results than through an inside/outside comparison approach. This may be applicable to the Bamboung situation facing inside/outside exchanges.
Within the various possible methods, hydro acoustic monitoring can be a valuable tool to survey MPAs because of its advantage of being non intrusive, with certain conditions: Apply accurate protocols, perform a sampling rate in time allowing to get rid of the short term variability in order to better estimate the long term variability, include acoustics within a complete environment study, and look for known fish behaviour patterns over time.
ACKNOWLEDGEMENT
REFERENCES
- Pauly D, Watson R, Alder J (2005) Global trends in world fisheries: Impacts on marine ecosystems and food security. Philos Trans R Soc Lond B Biol Sci 360: 5-12.
- Daan N, Gislason H, Pope JG, Rice JC (2011) Apocalypse in world fisheries? The reports of their death are greatly exaggerated. International Council for the Exploration of the Sea Journal of Marine Science 68: 1375-1378.
- Roberts CM, Bohnsack JA, Gell F, Hawkins JP, Goodridge R (2001) Effects of marine reserves on adjacent fisheries. Science 294: 1920-1923.
- Hilborn R, Stokes K, Maguire JJ, Smith T, Botsford LW, et al. (2004) When can marine reserves improve fisheries management? Ocean and Coastal Management 47: 197-205.
- Mora C, Sale PF (2011) Ongoing global biodiversity loss and the need to move beyond protected areas: A review of the technical and practical shortcomings of protected areas on land and sea. Marine Ecology Progress Series 434: 251-266.
- Rice J, Moksness E, Attwood C, Brown SK, Dahle G, et al. (2012) The role of MPAs in reconciling fisheries management with conservation of biological diversity. Ocean & Coastal Management 69: 217-230.
- Nikitine J, Wilson AMW, Dawson TP (2018) Developing a framework for the efficient design and management of large scale marine protected areas. Marine Policy 94: 196-203.
- Kelleher G (1999) Guidelines for marine protected areas. International Union for Conservation of Nature, Gland, Switzerland.
- Allison GW, Lubchenco J, Carr MH (1998) Marine reserves are necessary but not sufficient for marine conservation. Ecological Applications 8: 79-92.
- Marinesque S, Kaplan DM, Rodwell LD (2012) Global implementation of marine protected areas: Is the developing world being left behind? Marine Policy 36: 727?737.
- Diouf PS (1996) The Fish communities of West African estuaries: The example of the Sine-Saloum hyperhaline estuary. Doctorat d’Université. Université de Montpellier 2, France.
- Simier M, Blanc L, Aliaume C, Diouf PS, Albaret JJ (2004) Spatial and temporal structure of fish assemblages in an “inverse estuary”, the Sine Saloum system (Senegal). Estuarine, Coastal and Shelf Science 59: 69-86.
- Dia IMM (2003) Élaboration et mise en œuvre d’un plan de gestion intégrée : La reserve de biosphere du delta du saloum, senegal. Union Internationale pour la Conservation de la Nature, Gland, Switzerland.
- Deme M, Failler P, Van de Walle G (2010) Dynamiques d’exploitation et de valorisation des ressources halieutiques dans la Réserve de Biosphère du Delta Du Saloum (RBDS). Institut Sénégalais de Recherches Agricoles 9: 1-19.
- Breuil C (2011) Marine protected areas: Country case studies on policy, governance and institutional issues. Sanders JS, Greboval D, Hjort A (eds.). Marine protected areas. FAO technical paper, Rome, Italy.
- Faye D, Tito de Morais L, Raffray J, Sadio O, Thiawa OT, et al. (2011) Structure and seasonal variability of fish food webs in an estuarine tropical marine protected area (Senegal): Evidence from stable isotope analysis. Estuarine, Coastal and Shelf Science 92: 607-617.
- Sow I, Guillard J (2010) Suivi par hydroacoustique du peuplement piscicole d’une Aire Marine Protégée du Sine-Saloum (Sénégal): Bilan 2003-2007. Journal des Sciences Halieutique et Aquatique 1: 21-32.
- Simmonds J, MacLennan D (2005) Fisheries Acoustics: Theory and practice. 2nd edition. Blackwell Science, Oxford, UK.
- Krumme U, Hanning A (2005) A floating device for stationary hydroacoustic sampling in shallow waters. Fisheries Research 73: 377-381.
- Boswell KM, Wilson MP, Wilson CA (2007) A lightweight transducer platform for use in stationary shallow water horizontal-aspect acoustic surveys. Fisheries Research 85: 291-294.
- Boswell KM, Wilson MP, MacRae PSD, Wilson CA, Cowan JH (2011) Seasonal estimates of fish biomass and length distributions using acoustics and traditional nets to identify estuarine habitat preferences in barataria bay, louisiana. Marine and Coastal Fisheries 2: 83-97.
- Samedy V, Josse E, Guillard J, Pierre M, Girardin M, et al. (2013) Comparisons of vertical hydroacoustic survey strategies for monitoring fish distributions in the Gironde estuary (France). Estuarine, Coastal and Shelf Sciences 134: 174-180.
- Albaret JJ, Simier M, Sadio O (2005) Suivi biologique des peuplements de poissons d’une aire protégée en zone de mangrove: Le bolong de Bamboung (Sine Saloum, Sénégal), IRD, Pg no: 1-80.
- Tito de Morais L, Simier M, Raffray J, Sadio O, Ecoutin JM (2012) Suivi biologique des peuplements de poissons d’une aire protégée en zone de mangrove: Le bolong de Bamboung (Sine-Saloum, Sénégal). IRD, Dakar, Senegal.
- Ecoutin JM, Sadio O, Simier M, Raffray J, Tito de Morais L (2012) Comparaison des peuplements de poissons d’une aire protégée en zone de mangrove (le bolon de Bamboung, Sine Saloum, Sénégal) avec les peuplements de deux sites proches non protégés de l’exploitation halieutique: Années 2008-2010.
- Guillard J, Albaret JJ, Simier M, Sow I, Raffray J, et al. (2004) Spatio-temporal variability of fish assemblages in the Gambia Estuary (West Africa) observed by two vertical hydroacoustic methods: Moored and mobile sampling. Aquatic Living Resources 17: 47-55.
- Guillard J, Darchambeau F, Masilya P, Descy JP (2012) Is the fishery of the introduced Tanganyika sardine (Limnothrissa miodon) in Lake Kivu (East Africa) sustainable? Journal of Great Lakes Research, 38: 524-533.
- Foote KG, Knudsen HP, Vestnes DN, DN MacLennan, EJ Simmonds (1987) Calibration of acoustic instruments for fish density estimation: A practical guide. International Council for the Exploration of the Sea Journal of Marine Science 144: 1-69.
- Aglen A (1989) Empirical results on precision-effort relationships for acoustic surveys. International Council for the Exploration of the Sea Council Meeting document, Pg no: 1-30.
- Knudsen FR, Sægrov H (2002) Benefits from horizontal beaming during acoustic survey: Application to three Norwegian lakes. Fisheries Research 56: 205-211.
- Balk H, Lindem T (2006) Sonar 4, Sonar 5, Sonar 6-Post-processing Systems. Operator Manual. University of Oslo, Norway.
- Love RH (1977) Target strength of an individual fish at any aspect. Journal of Acoustical Society of America 62: 1397-1403.
- MacLennan D, Fernandes PG, Dalen J (2002) A consistent approach to definitions and symbols in fisheries acoustics. ICES Journal of Marine Science 59: 365-369.
- Emmrich M, Winfield IJ, Guillard J, Rustadbakken A, Vergès C, (2012) Strong correspondence between gillnet catch per unit effort and hydroacoustically derived fish biomass in stratified lakes. Freshwater Biology 57: 2436-2448.
- Guillard J (1998) Daily migration cycles of fish populations in a tropical estuary (Sine-Saloum, Senegal) using a horizontal-directed split-beam transducer and multibeam sonar. Fisheries Research 35: 23-31.
- 36. Fréon P, Soria M, Mullon C, Gerlotto F (1993) Diurnal variation in fish density estimate during acoustic surveys in relation to spatial distribution and avoidance reaction. Aquatic Living Resources 6: 221-234.
- Fréon, P, Gerlotto F, Misund OA (1993) Consequences of fish behaviour for stock assessment. International Council for the Exploration of the Sea Journal of Marine Science 196: 190-195.
- Mous PJ, Van Densen WLT, Machiels MAM (2004) Vertical distribution patterns of zooplanktivorous fish in a shallow, eutrophic lake, mediated by water transparency. Ecology of Freshwater Fish 13: 61-69.
- Vondracek B, Degan DJ (1995) Among-and within-transect variability in estimates of shad abundance made with hydroacoustics. North American Journal of Fisheries Management 15: 933-939.
- Guillard J, Perga ME, Colon M, Angeli N (2006) Hydroacoustic assessment of young-of-year perch, Perca fluviatilis, population dynamics in an oligotrophic lake (Lake Annecy, France). Fisheries Management and Ecology 13: 319-327.
- Everson I, Taabu-Munyaho A, Kayanda R (2012) Acoustic estimates of commercial fish species in Lake Victoria: Moving towards ecosystem-based fisheries management. Fisheries Research 139: 65-75.
- Kubecka JA, Duncan (1998) Diurnal changes of fish behaviour in a lowland river monitored by a dual-beam echosounder. Fisheries Research 35: 55-63.
- Mouse PJ, Kemper J (1996) Applications of a hydroacoustic sampling technique in a large wind-exposed shallow lake. Cowx IG (eds.). Stock Assessment in Inland Fisheries. Wiley-Blackwell, Pg no: 179-195.
- Guillard J (1996) Utilisation des méthodes acoustiques en milieu peu profond: Rivières, estuaires, zones côtières. Oceanis 22: 39-50.
- Lester SE, Halpern BS, Grorud-Colvert K, Lubchenco J, Ruttenberg BI, et al. (2009) Biological effects within no-take marine reserves: A global synthesis. Marine Ecology Progress Series 384: 33-46.
- Guisado DD, Cole RG, Davidson RJ, Freeman DJ, Kelly S, et al. (2012) Comparison of methodologies to quantify the effects of age and area of marine reserves on the density and size of targeted species. Aquatic Biology 14: 185-200.
- Béhagle N, Brochier T, Guillard J, Laë R, Lebourges Dhaussy A, et al. (2013) L’aire marine protégée communautaire de Bamboung (Sine Saloum): Synthèse 2003-2011. Ecoutin JM (eds.). IRD, Dakar, Sénégal.
- Zheng M, Kashimori Y, Hoshino O, Fujita K, Kambara T (2005) Behavior pattern (innate action) of individuals in fish schools generating efficient collective evasion from predation. J Theor Biol 235: 153-167.
- Parrish JK (1999) Using behavior and ecology to exploit schooling fishes. Environmental Biology of Fishes 55: 157-181.
- Partridge BL (1982) The structure and function of fish schools. Sci Am 246: 114-123.
- Draštík V, Kube?ka J (2005) Fish avoidance of acoustic survey boat in shallow waters. Fisheries Research 72: 219-228.
- Gerlotto F, Castillo J, Saavedra A, Barbieri MA, Espejo M, (2004) Three-dimensional structure and avoidance behaviour of anchovy and common sardine schools in central southern Chile. International Council for the Exploration of the Sea Journal of Marine Science 61: 1120-1126.
- Brehmer P, Gerlotto F, Samb B (2000) Measuring fish avoidance during surveys. International Council for the Exploration of the Sea, Council Meeting document K: 07.
- Thorne RE (1998) Review: Experiences with shallow water acoustics. Fisheries Research 35: 137-141.
- Bethke E, Arrhenius F, Cardinale M, Håkansson N (1999) Comparison of the selectivity of three pelagic sampling trawls in a hydroacoustic survey. Fisheries Research 44: 15-23.
- Frear PA (2002) Hydroacoustic target strength validation using angling creel census data. Fisheries Management and Ecology 9: 343-350.
- Guillard J, Simier M, Sow I, Raffray J, Albaret JJ, et al. (2012b) Fish biomass estimates along estuaries: A comparison of vertical acoustic sampling at fixed stations and purse seine catches. Estuarine, Coastal and Shelf Science 107: 105-111.
- Vidy G (2000) Estuarine and mangrove systems and the nursery concept: Which is which? The case of the sine saloum estuary system (Senegal). Wetlands Ecology and Management 8: 37-51.
- Krumme U, Saint-Paul U, Rosenthal H (2004) Tidal and diel changes in the structure of a nekton assemblage in small intertidal mangrove creeks in northern Brazil. Aquatic Living Resources 17: 215-229.
- Liu Z, Zhang Y, Yu X, Yuan C (2016) Unmanned surface vehicles: An overview of developments and challenges. Annu Rev Control 41: 71-93.
- Guillard J, Le Meaux O, Vincent-Falquet R, Goulon C (2018) The harle: An autonomous vehicle for non-intrusive fish population studies in lakes. ELLS-IAGLR-2018 Big Lakes-Small World September 23-28, 2018 (Evian - France).
- Sale PF, Cowen RK, Danilowicz BS, Jones GP, Kritzer JP, et al. (2005) Critical science gaps impede use of no-take fishery reserves. Trends in Ecology and Evolution 20: 74-80.
- Le Pape O, Delavenne J, Vaz S (2014) Quantitative mapping of fish habitat: A useful tool to design spatialised management measures and marine protected area with fishery objectives. Ocean & Coastal Management 87: 8-19.
- Kachelriess D, Wegmann M, Gollock M Pettorelli N (2014) The application of remote sensing for marine protected area management. Ecological Indicators 36: 169-177.
- Kenchington RA (1990) Managing Marine Environments. Taylor and Francis, New York, USA.
- R Core Team (2013) R: A language and environment for statistical computing. R Foundation for Statistical Computing, Vienna, Austria.
Citation: Béhagle N, Guillard J, Ecoutin JM, Laë R, Sow I, et al. (2018) Acoustic Survey of an Estuarine Marine Protected Area and of its Close Vicinity: Analysis and Monitoring Prospective. J Aquac Fisheries 2: 011.
Copyright: © 2018 Nolwenn Béhagle, et al. This is an open-access article distributed under the terms of the Creative Commons Attribution License, which permits unrestricted use, distribution, and reproduction in any medium, provided the original author and source are credited.