Effects of Season on Ovine Milk Composition
*Corresponding Author(s):
Paola ScanoDipartimento Di Scienze Chimiche E Geologiche, Università Di Cagliari, SS 554 Km 4.5, 09042 Monserrato, Cagliari, Italy
Tel:+39 0706754391,
Email:scano@unica.it
Abstract
In the Mediterranean area, the seasonality of sheep milk production and quality heavily affects the dairy industry profitability. This research paper is aimed to study the changes of ovine milk composition in different months of the year. The composition of more than 126000 samples of bulk milk from grazing Sarda breed sheep, bred in Sardinia (Italy), collected in 2017 from January to July was studied. Milk main traits, physical-chemical parameters, and fatty acid composition were measured, and data analyzed by descriptive statistics, mean comparison test and multivariate statistical analysis. An increase of proteins and fat was observed in summer, accompanied by a decrease of proteins/fat ratio. Milk urea showed higher levels in winter-spring (January-April). Rumenic acid, trans-vaccenic acid and linolenic acid decreased in late spring-summer (May-July). Somatic cell levels were found not correlated with the bacterial count, and their trend suggests a dependence to milk dilution. NaCl content compensated the lower levels of lactose in the summer season. Based on a big data set, results highlighted the main differences in bulk milk composition, over a long period of the year. Differences can be attributed to traditional system of breeding.
Keywords
Milk composition; Milk urea; Ovine milk seasonality; Rumenic acid; Sheep’s milk
INTRODUCTION
Sheep milk is known to have high concentrations of proteins, fat, minerals, and vitamins, and thus a high nutritional value when compared to milks of other domestic species. Ovine milk can be used to produce different cheese varieties, yogurt, and ricotta containing prebiotic ingredients and/or probiotic bacteria, which are the major categories in the functional food market. Nowadays, ovine dairy products have gained market size due to the product’s quality, high yield, and nutritional value [1].
Sardinia (Italy) is one of the dominant European regions for sheep dairy production with more than 3.5 million sheep (3.7% of the EU total in 2009) which produce more than 300,000 MT of milk corresponding to about 4% of total world production [2]. Approximately the 90% of this milk is processed into different types of cheese. Sardinia boasts a wide range of high quality ripened sheep cheese, namely Pecorino Romano, Pecorino Sardo and Fiore Sardo, recognized with the Protected Designation of Origin (PDO) under the European law. However, the cheese production is characterized by a great discontinuity due to the low milk production and often low milk technological quality during summer time. This fact is related to the seasonality of the Sardinian ovine breeding system, with the lactation curve of sheep that follows the evolutionary curve of grazing. The lactation curve is characterized by a maximum peak in the spring season, in correspondence of the maximum availability of grass, followed by a gradual decrease of milk yield until the summer season when the ewes dry-off [3]. In Sardinia, 75% of the sheep milk is produced between January and May [4]. Several variables (e.g., stage of lactation, diet, temperature and season) contribute to this trend. Indeed, on average, in the traditional systems, the milk produced in the summer often is produced by ewes at the end of lactation, fed on stubble and with insufficient supplements, and exposed to heat stress [4]. Milk production and cheese making are therefore done during the winter- spring period. This production system, characterized by variations in the technological characteristics of milk, has important implications for the dairy industry. Specifically, in summer, low milk production and low milk technological quality have a repercussion on cheese yields, on the efficiency of cheese dairy industries and on the market sector, with a reduction in cash flow and lack of fresh (not ripened) dairy products.
There is also a strong relationship between sheep nutrition and milk quality which is mainly identifiable in its technological and coagulation properties. Indeed, these properties are determined by milk fat and protein concentration, Somatic Cell Content (SCC) and other parameters. Data on ovine milk composition and physical-chemical characteristics changes during the production season is essential for successful development of dairy sheep products as well as for the marketing of the products [5]. In this work, we studied seasonal changes of ovine milk compositional characteristics by descriptive statistics and multivariate statistical analysis, during the production period i.e. from January to July.
MATERIALS AND METHODS
Sampling
Milk composition
Statistical analysis
RESULTS AND DISCUSSION
At first a PCA was performed on the whole data set, the resulting score plot (Figure 1A) clearly showed that, along the PC1, samples are displaced according with the month of collection, going from January (light circles, left side) to July (dark squares, right side). The loading plot (Figure 1B) indicated that summer samples were characterized by high levels of fat and proteins, while winter samples by lactose, rumenic acid (18:2 cis-9 trans-11), trans-vaccenic acid (18:1 trans-11) and linolenic acid (18:3 cis-9,12,15).
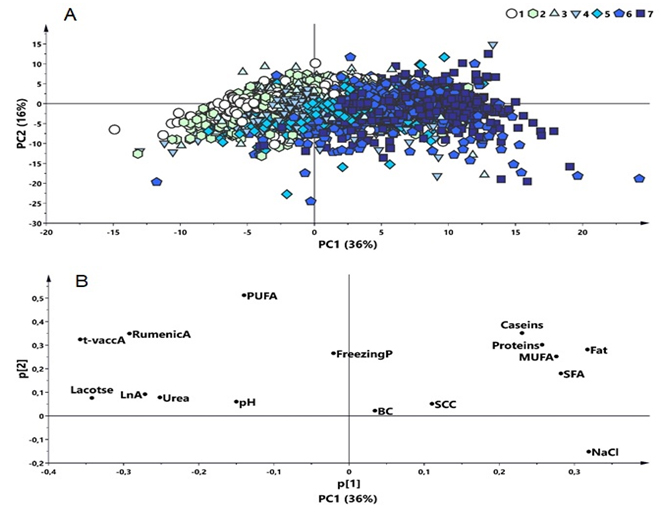 Figure 1: PCA of milk data set (126259 samples X 15 parameters). A) Score plot: 1 January, 2 February, 3 March, 4April, 5 May, 6 June, 7 July; B) Loading lactose. SFA (saturated fatty acids), MUFA (unsaturated fatty acids), PUFA (poly unsaturated fatty acids), t-vacc (trans-vaccenic acid), LnA (linolenic acid), rumenicA (rumenic acid).
As reported in table 1, over the 7 months here examined, milk fat showed a mean value of 6.6 ± 0.9 g/100 mL of milk, with a minimum in April and a maximum level in July. Proteins showed mean value of 5.6 ± 0.4 g/100 mL, a minimum in January and a maximum value in July. From the minimum to the maximum values, fat showed an increase up to 36% and proteins of 10%. In this regard, it is worth to underline that the CV values were approximately 13-10% and < 10% for fat and proteins, respectively (Table1), indicating a higher variability of fat content with respect to proteins. Caseins, the main components of milk proteins (approximately the 78%) followed the same trend of proteins. As shown in figure 2, milk protein and fat levels followed the same trend, having almost comparable values in the period of January-May and a statistically significant increase in June and July. This in accordance with previous literature data reported on ovine milk from sheep bred in the Mediterranean area reporting that in the winter-spring period, corresponding to the higher milk yield, there were lower levels of milk fat and protein content [4]. The trend of the protein-to-fat ratio is reported in figure 2. According with previous literature data, at the end of lactation (May-July), proteins did not rise proportionally to the increase of fat content, therefore the protein/fat ratio falls progressively. In this period, a progressive decrease in milk yield and a corresponding increase in milk total solids content were observed. Although the seasonal increase in milk total solids (proteins and fat in particular) resulted in a significant increase of cheese yield [10,11], the decrease of the milk protein/fat ratio leads to significant changes in the composition of the obtained cheese [12,13]. Addis et al., [14], comparing the physico-chemical characteristics of PDO Pecorino Romano cheeses produced in several dairies located in Sardinia, observed that those produced in June contained less proteins, more fat and salt than cheese produced in the spring period. Pecorino Romano PDO cheese produced during the summer season (May-July) achieved more slowly the suitable structure for “grating” use, the main commercial destination of this cheese [3]. Fat, proteins and salt content markedly affect rheological and sensory characteristics of cheese, especially hard cheese [15].
|
January (n=18369) |
February (n=19604) |
March (n=19915) |
April (n=19947) |
May (n=19918) |
June (n=19193) |
July (n=9312) |
Total (n= 126242 ) |
|||||||||||||||||
|
Mean |
SD |
CV% |
Mean |
SD |
CV% |
Mean |
SD |
CV% |
Mean |
SD |
CV% |
Mean |
SD |
CV% |
Mean |
SD |
CV% |
Mean |
SD |
CV% |
Mean |
SD |
CV% |
|
|
Fat |
6.3a |
0.8 |
13 |
6.3ab |
0.8 |
13 |
6.3b |
0.8 |
13 |
6.1c |
0.7 |
11 |
6.6d |
0.8 |
11 |
7.4e |
0.8 |
10 |
7.6f |
0.7 |
10 |
6.6 |
0.9 |
14 |
|
Prot |
5.4a |
0.3 |
6 |
5.5b |
0.3 |
6 |
5.6c |
0.3 |
5 |
5.5d |
0.3 |
5 |
5.6c |
0.3 |
6 |
5.8e |
0.4 |
7 |
6.0f |
0.5 |
8 |
5.6 |
0.4 |
7 |
|
Case |
4.2a |
0.3 |
7 |
4.2a |
0.3 |
7 |
4.4b |
0.3 |
7 |
4.3c |
0.2 |
5 |
4.3d |
0.3 |
6 |
4.5e |
0.3 |
8 |
4.6f |
0.4 |
8 |
4.3 |
0.3 |
7 |
|
Pr/Ft |
0.9a |
0.1 |
13 |
0.9a |
01 |
15 |
0.9a |
0.1 |
12 |
0.9a |
0.1 |
11 |
0.85a |
0.09 |
10 |
0.79ab |
0.07 |
9 |
0.80b |
0.06 |
8 |
0.9 |
0.11 |
13 |
|
Lact |
5.0a |
0.1 |
2 |
4.9b |
0.1 |
2 |
4.9c |
0.1 |
3 |
4.9b |
0.1 |
3 |
4.8d |
0.2 |
3 |
4.5e |
0.2 |
5 |
4.2f |
0.4 |
8 |
4.8 |
0.3 |
6 |
|
Urea |
40a |
9 |
22 |
43b |
9 |
20 |
40a |
8 |
21 |
39c |
9 |
22 |
36d |
8 |
24 |
26e |
9 |
35 |
24f |
10 |
41 |
36 |
11 |
30 |
|
NaCl |
122a |
18 |
14 |
129b |
18 |
14 |
131c |
18 |
13 |
135d |
18 |
13 |
144e |
18 |
12 |
173f |
29 |
17 |
210g |
44 |
20 |
144 |
33 |
23 |
|
FrP |
0.582acd |
0.009 |
2 |
0.582b |
0.009 |
2 |
0.582acd |
0.009 |
2 |
0.583acdf |
0.009 |
2 |
0.583e |
0.009 |
1.5 |
0.58df |
0.01 |
2 |
0.58g |
0.01 |
2 |
0.58 |
0.01 |
2 |
|
pH |
6.8a |
0.1 |
2 |
6.7a |
0.1 |
2 |
6.7b |
0.1 |
2 |
6.7cd |
0.1 |
2 |
6.7c |
0.1 |
1.5 |
6.7e |
0.1 |
2 |
6.72d |
0.10 |
2 |
6.7 |
0.1 |
2 |
|
SCC |
1353a |
1047 |
77 |
1330bc |
1114 |
84 |
1323bc |
1156 |
87 |
1264abc |
1127 |
89 |
1357d |
1213 |
89 |
1567e |
1324 |
85 |
1809f |
1617 |
89 |
1396 |
1202 |
86 |
|
BC |
1666 |
3805 |
1706 |
3830 |
1383 |
3380 |
1426 |
3501 |
1268 |
3233 |
1364 |
3346 |
1296 |
3243 |
1453 |
3502 |
||||||||
|
SFA |
3.9a |
0.6 |
14 |
3.9a |
0.5 |
13 |
4.06b |
0.53 |
13 |
4.04b |
0.48 |
12 |
4.35c |
0.52 |
12 |
4.47d |
0.56 |
13 |
4.54e |
0.55 |
12 |
4.2 |
0.6 |
14 |
|
MUFA |
1.5a |
0.3 |
22 |
1.4b |
0.3 |
22 |
1.39c |
0.31 |
23 |
1.23d |
0.24 |
20 |
1.50e |
0.34 |
23 |
2.05f |
0.41 |
20 |
2.24g |
0.41 |
19 |
1.6 |
0.5 |
29 |
|
PUFA |
0.39a |
0.05 |
12 |
0.36b |
0.04 |
12 |
0.35c |
0.05 |
13 |
0.32d |
0.04 |
14 |
0.31e |
0.04 |
12 |
0.31e |
0.04 |
14 |
0.30f |
0.04 |
14 |
0.33 |
0.05 |
16 |
|
TV-A |
3.6a |
0.7 |
20 |
3.3b |
0.7 |
22 |
3.2c |
0.8 |
25 |
2.7d |
0.8 |
27 |
2.0e |
0.7 |
38 |
1.3f |
0.8 |
60 |
0.9g |
0.7 |
73 |
2.5 |
1.1 |
46 |
|
RumA |
1.5a |
0.3 |
20 |
1.5b |
0.3 |
21 |
1.4c |
0.3 |
23 |
1.2d |
0.3 |
26 |
0.9e |
0.3 |
30 |
0.8f |
0.3 |
43 |
0.7g |
0.3 |
47 |
1.2 |
0.4 |
37 |
|
LnA |
1.0a |
0.3 |
24 |
1.2b |
0.3 |
21 |
1.0a |
0.3 |
25 |
1.0c |
0.3 |
25 |
0.9d |
0.3 |
30 |
0.6e |
0.3 |
40 |
0.7f |
0.3 |
40 |
0.9 |
0.3 |
34 |
Table 1: Descriptive statistics and means comparison of ovine milk composition parameters over 7 months.
Fat, Prot (proteins), Lac (lactose), Case (caseins), NaCl (g/100 mL of milk); Urea (mg/100 mL of milk);FrP (freezing point, -Horvet); SCC (log 103 cell/mL of milk); BC (Bacterial count, CFU/mL); SFA (saturated fatty acids), MUFA (monounsaturated fatty acids; PUFA (poly unsaturated fatty acids) (g/100 mL of milk); TV-A (trans-vaccenic acid), RumA (rumenic acid), LnA (linolenic acid) (g/ 100 g of milk fat). Different letters in the same row indicate that the difference of the means is significant at the 0.001 level.
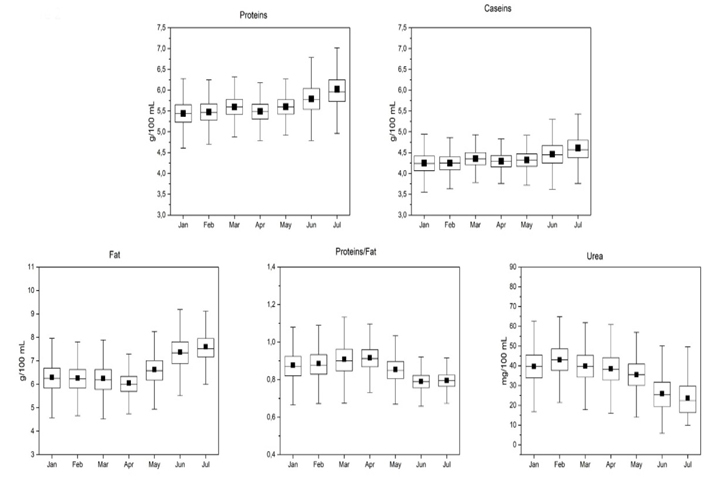 Figure 2: Box and whisker plots of fat, proteins, caseins, proteins/fat ratio and urea.
A parameter strictly connected with the quality of ewe’s diet is the milk urea content. Determining milk urea levels was found a useful management tool to evaluate the metabolism and intake of proteins while minimizing potential negative effects on animals [16]. Milk urea content (Figure 2) was higher in January-March, with a decrease (11.5%) in summer (June-July). It has been reported that in Sardinia and in other Mediterranean areas the ovine milk produced during late winter-spring seasons is characterized by lower levels of fat and protein due to the higher milk yield and by an increase of milk urea that impairs the milk technological properties in terms of lower cheese yield [17]. This fact has been related to the characteristics of the pasture with young sward poor in fiber and rich in highly fermentable proteins and/or non-protein nitrogen. High levels of dietary protein can cause animal health and reproduction issues, as well as the impairment of the milk characteristics and technological properties [16-18]. In addition, an increase of milk urea determines an increase of environmental urinary nitrogen excretion and it is associated with a worsening of animal welfare condition and different ruminant’s pathologies such as fertility, subclinical mastitis and foot problems [19].
From January to May, lactose contents were comparable, in summer (June and July), lactose levels dropped of 16.6% (Figure 3) and within month, lactose showed a low CV% values. In summer, the increasing temperatures and solar radiation are generally related to a decreased of food intake [20]. The exposure of the animals to higher environmental temperature stimulates the peripheral thermal receptors to transmit suppressive nerve impulses to the appetite centre in the hypothalamus and thereby causing a decrease in feed intake. The decrease in feed intake could be the adaptive mechanism to produce less body heat [21]. Since in lactating animals most of the blood glucose is used by the breast for the lactose synthesis, it could be speculated, according to Hamzaoui et al., [22], that the reduction in lactose secretion is a strategy to maintain stable glycaemia. Milk is isotonic with blood, and lactose is responsible for 50% of the osmotic pressure of milk. Thus, milk with a low level of lactose has a high level of inorganic salts or other compounds to maintain the osmotic pressure [23]. To keep the osmotic equilibrium, the decrease of the osmolyte lactose was found strictly correlated (r = -0.89) with the increased levels of NaCl (Figure 3).
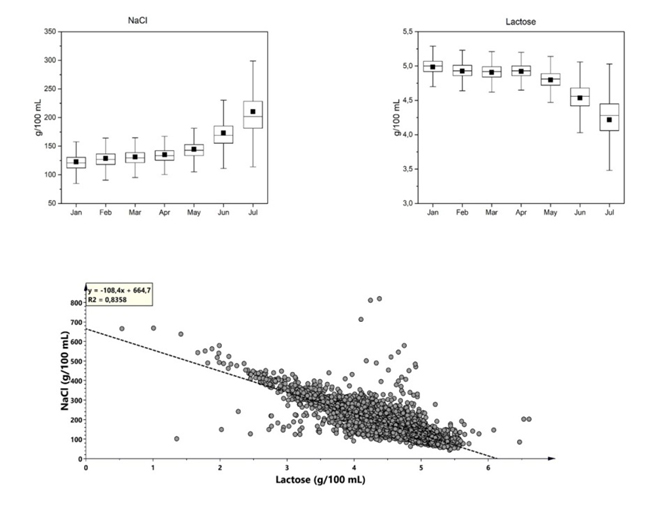 Figure 3: Box and whisker plots of lactose and NaCl and their correlations plot.
As reported in Table 1, the freezing point values, expressed as negative Horvet degrees, and pH had very low variability among months of production. The overall trend of SCC was similar to that observed for fat and proteins, with higher values in June and July, suggesting that milk dilution can play a determinant role for SCC values. As reported in Table 1, the mean SCC levels, although with high SDs, were higher than 1300 × 103 cell/100 mL of milk set as unofficial threshold, indeed, SCC physiological levels in ovine milk are still the subject of controversy [24], without an official threshold for mastitis diagnosis. The SCC value has a strong economic impact on sheep breeders as payment of milk depends on this value [25]. For what concerns the performance of high SCC milk in the production of cheese, no relevant differences between high and low SCC milk for ovine cheese manufacturing were observed [26,27].
The high SCC level found during summer is not accompanied by an increase of BC values, that, indeed, showed a fluctuating trend, suggesting that somatic cells can be mainly produced from the epithelium rather that from udder infection. However, the counting method used so far does not allow differentiation of the milk flora (lactic, psychotropic and pathogenic bacteria) [25].
We also studied the FA composition of milk and results are reported in Table 1 and depicted in figure 4. Going from January to July, the FA composition changed; there was an increase of saturate FA (SFA) and mono unsaturated FA (MUFA), and a decrease of Poly Unsaturated FA (PUFA). The reduced pasture quality after spring and the decrease of PUFA content as grass matured might, in part, explain the decrease of these FA in milk of grazing sheep. The same trend was observed by Nudda et al., [28]. Furthermore, from March to July, a reduction of the trans-vaccenic acid levels, the Conjugated Linoleic Acid (CLA) isomer rumenic acid, and the linolenic acid was observable. Among ruminants, sheep milk fat has the highest levels of CLA and trans-vaccenic acid. It has been reported that rumenic acid has important health effects, including antiobesity, anticarcinogenic, antidiabetic, antioxidant, and immunoregulatory effects [1]. The production of the trans-vaccenic acid and the rumenic acid is due to the ruminal biohydrogenation of linoleic acid, combined with mammary lipogenic and Δ-9 desaturation, these pathways considerably modifying the profile of dietary FA [29]. The measured rumenic acid and trans-vaccenic acid contents were found strongly positively correlated (r = 0.89) which is consistent with a predominant origin of rumenic acid in the mammary gland from trans-vaccenic acid via Δ9-desaturase [30]. The pasture plays a pivotal role in affecting the levels of trans-vaccenic acid, rumenic acid and also of α-linolenic acid. It is well established that the concentration of rumenic acid is higher in milk of grazing ruminants compared to those animals on diets based on conserved forages [28]. Natural pasture in the Mediterranean basin positively contributes to the rumenic acid content of sheep milk and cheese [28], changes in ewe’s diet due to seasonal variation can modify its concentration in milk.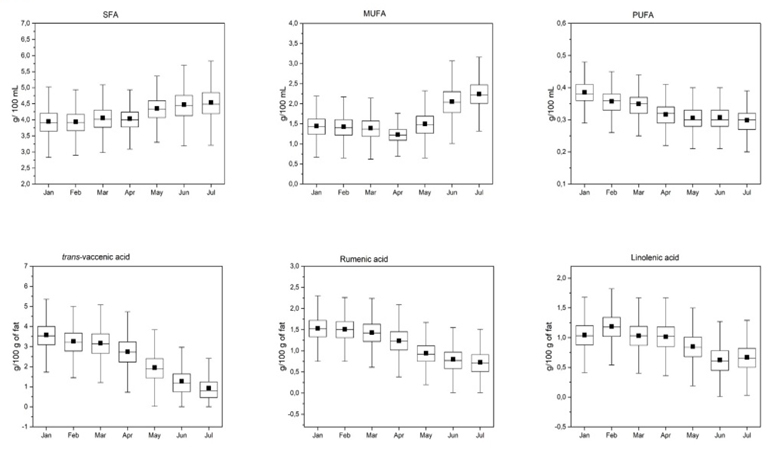 Figure 4: Box and whisker plots of SFA (saturated fatty acids), MUFA (monounsaturated fatty acids; PUFA (poly unsaturated fatty acids); trans-vaccenic acid; rumenic acid; linolenic acid.
CONCLUSION
Results of this work indicated that milk characteristics of sheep bred in Sardinia heavily depend on the breeding system, climate and pasture. In future works data will be collected for more than one year to assess the annual variability of ovine milk produced in Sardinia.
REFERENCES
- Balthazar CF, Pimentel TC, Ferrão LL, Almada CN, Santillo A, et al. (2017) Sheep milk: Physicochemical characteristics and relevance for functional food development. Comprehensive Reviews in Food Science and Food Safety 16: 247-262.
- Furesi R, Madau FA, Pulina P (2013) Technical efficiency in the sheep dairy industry: an application on the Sardinian (Italy) sector. Agric Econ 1: 4.
- Addis M, Pes M, Fiori M, Nieddu G, Furesi S, et al. (2018) Effect of protein-to-fat ratio of sheep milk on the composition, rheological properties and yield of PDO Pecorino Romano cheese. Small Ruminant Res162: 1-7.
- Sitzia M, Bonanno A, Todaro M, Cannas A, Atzori A S, et al. (2015) Feeding and management techniques to favour summer sheep milk and cheese production in the Mediterranean environment. Small Ruminant Res 126: 43-58.
- Park YW, Juárez M, Ramos M, Haenlein GFW (2007) Physico-chemical characteristics of goat and sheep milk. Small Ruminant Res 68: 88-113.
- ISO 707:2008 (IDF 50:2008) (2008) Milk and milk products-Guidance on sampling.
- ISO 9622:2013 (IDF 141:2013) (2013) Milk and liquid milk products-Guidelines for the application of mid-infrared spectrometry.
- Caredda M, Addis M, Ibba I, Leardi R, Scintu MF, et al. (2016) Prediction of fatty acid content in sheep milk by Mid-Infrared spectrometry with a selection of wavelengths by Genetic Algorithms. LWT-Food Sci Technol 65: 503-510.
- ISO 13366-2:2006 (IDF 148-2:2006) (2006) Milk- Enumeration of somatic cells- Part 2: Guidance on the operation of fluoro-opto-electronic counters.
- Pirisi A, Piredda G, Molle G, Ligios S (1994) Effetto di differenti sistemi di allevamento della pecora di razza sarda sulla composizione chimica e sulle caratteristiche casearie del latte. XLVIII Convegno SISVET. Giardini Naxos 28: 1595-1599.
- Barron LJR, de Labastida EF, Perea S, Chávarri F, de Vega C, et al. (2001) Seasonal changes in the composition of bulk raw ewe's milk used for Idiazabal cheese manufacture. Int Dairy J 11: 771-778.
- Jaeggi JJ, Govindasamy-Lucey S, Berger YM, Johnson ME, McKusick BC, et al. (2003) Hard ewe's milk cheese manufactured from milk of three different groups of somatic cell counts. J Dairy Sci 86: 3082-3089.
- Guinee TP, Mulholland EO, Kelly J, Callaghan DJ (2007) Effect of protein-to-fat ratio of milk on the composition, manufacturing efficiency, and yield of Cheddar cheese. J Dairy Sci 90: 110-123.
- Addis M, Fiori M, Riu G, Pes M, Salvatore E, et al. (2015) Physico-chemical characteristics and acidic profile of PDO Pecorino Romano cheese: Seasonal variation. Small Ruminant Res126: 73-79.
- Guinee TP, Sutherland BJ (2011) Cheese: Salting of Cheese. Academic Press, London, UK, pg no: 595-606.
- Cannas A, Pes A, Mancuso R, Vodret B, Nudda A (1998) Effect of Dietary Energy and Protein Concentration on the Concentration of Milk Urea Nitrogen in Dairy Ewes. J Dairy Sci 81: 499-508.
- Nudda A, Battacone G, Bencini R, Pulina G (2004) Nutrition and milk quality. In: PULINA G. Dairy Sheep Nutrition. Wallingford: CABI Publishing: 129-149.
- Pulina G, Nudda A, Battacone G, Cannas A (2006) Effects of nutrition on the contents of fat, protein, somatic cells, aromatic compounds, and undesirable substances in sheep milk. Anim Feed SciTechnol 131: 255-291.
- Melendez P, Donovan A, Hernandez J (2000) Milk Urea Nitrogen and Infertility in Florida Holstein Cows. J Dairy Sci 83: 459-463.
- Bernabucci U, Lacetera N, Baumgard LH, Rhoads RP, Ronchi B, et al. (2010) Metabolic and hormonal acclimation to heat stress in domesticated ruminants. Animal 4: 1167-1183.
- Marai IFM, El-Darawany AA, Fadiel A, Abdel-Hafez MAM (2007) Physiological traits as affected by heat stress in sheep-a review. Small Ruminant Res 71: 1-12.
- Hamzaoui S, Salama AAK, Albanell E, Such X, Caja G (2013) Physiological responses and lactational performances of late-lactation dairy goats under heat stress conditions. J Dairy Sci 96: 6355-6365.
- Fox PF, McSweeney PLH (1998) Dairy chemistry and biochemistry. Springer Science & Business Media, Pg no: 478.
- Raynal-Ljutovac K, Pirisi A, De Cremoux R, Gonzalo C (2007) Somatic cells of goat and sheep milk: analytical, sanitary, productive and technological aspects. Small Ruminant Res 68: 126-144.
- Pirisi A, Lauret A, Dubeuf JP (2007) Basic and incentive payments for goat and sheep milk in relation to quality. Small Ruminant Res 68: 167-178.
- Pirisi A, Piredda G, Podda F, Pintus S (1996) Effect of somatic cell count on sheep milk composition and cheese-making properties. Wageningen Pers 77: 245-251.
- Pirisi A, Sanna A, Caria A (2000) Raw materials: quality and pricing. Bulletin of the International Dairy Federation 354: 12-19.
- Nudda A, McGuire MA, Battacone G, Pulina G (2005) Seasonal variation in conjugated linoleic acid and vaccenic acid in milk fat of sheep and its transfer to cheese and ricotta. J Dairy Sci 88: 1311-1319.
- Scintu MF, Piredda G (2007) Typicity and biodiversity of goat and sheep milk products. Small Ruminant Res 68: 221-231.
- Griinari JM, Corl BA, Lacy SH, Chouinard PY, Nurmela KVV, (2000) Conjugated linoleic acid is synthesized endogenously in lactating dairy cows by delta(9)-desaturase. J Nutr 130: 2285-2291.
Citation: Scano P, Ibba I, Casula M, Contu M, Caboni P (2019) Effects of Seasons on Ovine Milk Composition. J Dairy Res Tech 2: 004.
Copyright: © 2019 Paola Scano, et al. This is an open-access article distributed under the terms of the Creative Commons Attribution License, which permits unrestricted use, distribution, and reproduction in any medium, provided the original author and source are credited.