Hydro Information System for Arsenic Risk Assessment and Mitigation
*Corresponding Author(s):
Shahriar ShamsDepartment Of Civil Engineering, Universiti Teknologi Brunei, Gadong A, BE1410, Brunei Darussalam
Tel:+673 8136618,
Fax:+673 2461035
Email:shams.shahriar@utb.edu.nb
Abstract
Groundwater contamination by arsenic is an issue of paramount importance in the Asian region (Bangladesh, India, Cambodia, Vietnam, etc.,), and in the Africa region (Ghana, Nigeria, Cameroon etc.,). The evaluation of arsenic and its mitigation measures are based on quick accessibility to arsenic database and relevant spatial information. This study highlights the modelling of arsenic contamination for risk analysis and mitigation measures using a Hydro Information System (HIS). The HIS is based on Java language, Open source Geographical Information System (OGIS) compatible PostgreSQL database and visualization tools OpenMap for understanding the spatial distribution and magnitude of arsenic problem in Bangladesh. HIS accomplish this task of risk assessment of arsenic contamination based on degree of threat to exposed population and magnitude of contamination. Decision Support System (DSS) that takes into consideration the behavioural aspects, socio-economic situations and geophysical characteristics of the study area is linked to HIS in order to recommend the most suitable mitigation measures.
Keywords
INTRODUCTION
Groundwater contaminated by arsenic is an issue of paramount importance in the Asian region (Bangladesh, India, Cambodia, Vietnam etc.,) In the south Asian region, nearly 95 % of its population in Bangladesh rely on groundwater extracted from tube well [1] due its affordability and easy accessibly. However, the detection of arsenic contamination in groundwater in Bangladesh raised a potential health risk and as a result as many as 60-75 million people in Bangladesh are affected [2]. Since evaluation of arsenic and its mitigation measures are based on quick accessibility to relevant spatial information as well as promotion of arsenic awareness hence the role of Information Technology (IT) is a crucial part to address the problem.
A variety of tools such as Geographical Information System (GIS) for geospatial data management, Data Bases (DB) for knowledge management, applets accessed via mobiles can be used for disseminating information. Researchers and developer are focussing on maximizing the value of environmental data but the major obstacles are the availability of datasets in a wide range of vendor proprietary formats, often incompatible to each other. Therefore, there is a lack of a single system that would allow data to be easily combined, accessible, and flexibly modified to meet the requirements of decision-making.
The use of a spatial information system in the field of water management has given tremendous boost in decision-making in past decade. Soil contamination study based on heavy metals [3], arsenic distribution profiles at different soil depth in a tin-mining area [4], ground water contamination by pesticides [5] was conducted using GIS. Combined with groundwater models and socio-economic methodology, the Decision-Support System provides a comprehensive tool for accessing the ground water sustainability [6]. Many hydraulic processes in water resources engineering depends on IT-based models [7,8]. Data collection process and analyzing its consequences requires considerable amount of time [9]. The objective of HIS is to build up a user-friendly, comprehensive, easily accessible, database and perform a risk assessment of arsenic contamination based on degree of threat to exposed population and magnitude of arsenic contamination. Thus, a web-based information system comprising risk analysis mapping in terms of the population exposed should be given significant importance. This could be achieved through an open source and OGIS compatible system.
HYDRO INFORMATION SYSTEM
“Hydro Information System (HIS) can be defined as a system, whether automated or manual, that comprises of people, machines, and/or methods organized to collect, process, analyze, transmit, and disseminate hydro or water related data that represent user information applicable to water resources engineering” [10]. In this case, the raw hydro data is processed to obtain meaningful information. For example by having rainfall data, catchment area, and land cover characteristics we can calculate the runoff and thereby calculate the peak discharge. The research has focused on development of such a system that deals with different areas of water resources engineering starting from low-flow estimation, vegetation water content, non-point source pollutant load [11] and ground water contamination. The hydrological information system aims at developing comprehensive, easily accessible, user-friendly database, covering all aspects of hydrological cycle in surface water and ground water in terms of quality and quantity.
A system’s framework is used to establish a data-management structure for organizing and communicating water resources information combining the systems like Java GUI (Graphics User Interface) with JfreeChart, PostgreSQL Database with PostGIS extension and visualisation tools such as OpenMap for assessing the severity of arsenic problem in Bangladesh as shown in figures 1 and 2.
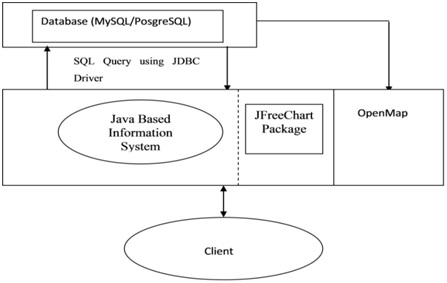 Figure 1: A simple layout of hydro information system.
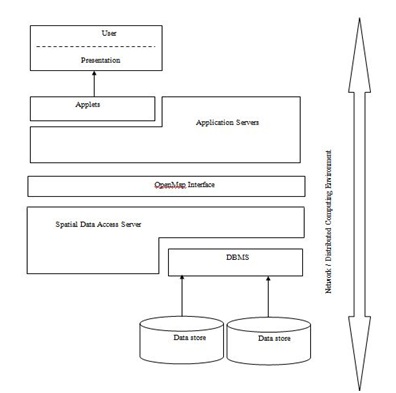 Figure 2: Interoperable OpenMap.
The programming language Java lies at the heart of the system linked to a database, which accesses and allows arsenic based GIS data as well as the flow of information. The function of Java is to make a GUI user friendly for inputting, storing and recording of data. Java simplifies object-oriented modelling in comparison with other languages like C++ and makes it easier to use for the novice programmer [12]. An object oriented programming language like Java allows object oriented models of the world to be more easily translated into computer instructions. A complex model can be broken down into more simple objects and each object could be designed using Java and a link or relationship between those objects can be established known as inheritance. The spatial objects of a distributed GIS implementation using multi-vendor products can be constructed as sub-classes of a super class object, and then encapsulated together. Java based Internet GIS (OpenMap) is another advantage where GIS tasks can be accomplished in the form of a typical Java applet.To address any query in database, SQL is used. The user interface query assists to access data from the database.
Based on the principle, that objects are ready to coupling with other objects built upon a standard interface, standard objects are created for Arsenic evaluation models and coded using the Java program that results in communication with other object(s) to represent the results. A variety of databases are available for storing data such as MySQL, Oracle, Sysbase but database like PostgreSQL with PostGIS extension were chosen because it is freely available and has more spatial functions as compared to more popular and open source database like MySQL. Besides, PostGIS comes with an inbuilt data loader (shp2pgsql) that transforms ESRI Shape files into SQL, appropriate for uploading in PostGIS/PostgreSQL and dumper (pgsql2shp) that transforms SQL queries into ESRI Shape files. The Jfreechart Package provides the relevant class files to visualise data in different types of chart forms. On the other hand, OpenMap provides web-based, open source GIS functionality.
The data is arranged in array structures to demonstrate a simple prototype as shown in figure 3. There are a number of attributes assigned by different tasks, and the information about the attributes is delivered when a request is made. A data unit can be defined as a unit where data is stored. It consists of two sections: Example-base, and Knowledge-base [13]. Knowledge-base: Knowledge-base has knowledge about dependency and concurrency in design computation. In design, attributes execute design activities and their values are dependent variables. Example-base: A number of examples are given in example base. If any information matches with the given examples, query agent tries to solve the problem with it.
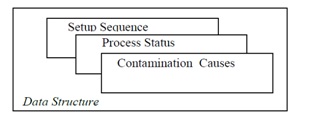
Figure 3: Layout of data structure.
The data for arsenic contaminated tubewells were obtained from the Municipality area of the district of Chapai Nawabganj in Bangladesh. The study area is located at latitude of 24°41.26' North and longitude of 88°24.47' East. The population density of Chapai Nawabganj is 996 per sq. km as per population census 2000 [14]. The soil of aquifer for groundwater storage mostly comprises of sand and silt resulting from alluvial deposits having few layers of clay while lower deposits consists of medium-grained sand.
The average precipitation of the district is 1400 mm per year. Groundwater levels are deepest during April-May due to less precipitation while it is shallowest during August-October during rainy season. Most of the minor rivers are sustained by the outflows from groundwater during dry periods.
The study area was chosen as some parts of the districts are known as hotspots due to extensive contamination resulting from arsenic [15]. The survey was done on a random basis in 89 households. Each household was asked about the location of the tubewell, year of construction, ownership, depth of well, type of well. Besides, using data from British Geological Survey (BGS), the magnitude of arsenic relevant to each tubewell is detected was recorded. The information collected was saved into a database to generate a potential risk map based on the screening criteria. Tubewells exceeding arsenic concentration (0.05 mg/l) were identified as screening criteria and created buffer (proximity analysis around coverage feature) distance of 5, 10 and 15 m radius around each contaminated tubewell. In the study area, people usually drink water from the tubewells which are within 5 m distance. Therefore, buffer distance has been applied with 5m intervals. The population exposed by each contaminated tubewell is calculated by spatial analysis model as shown in figure 4.
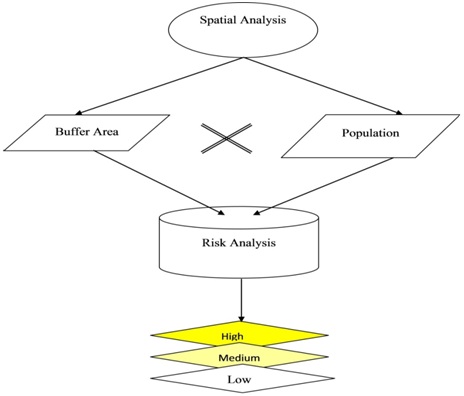 Figure 4: Spatial analysis model.
The arsenic contamination data in this study is presented as a number of points with each point having a specific location, and magnitude of the arsenic. The tables consisting of points ID and arsenic magnitudes are stored into the PostgreSQL database. The population exposed to arsenic contamination is classified as high (within 5 m buffer distance from the tubewell), medium (within 5-10 m buffer distance from the tubewell), and Low (within 10-15 m buffer distance from the tubewell), risk zones. The HIS consists of “Arsenic Analysis” menu and it contains sub-menu “Arsenic Data”, “Exposed Population” and “Decision-Support System”. A frame appears with input data for population density when clicks on the “Arsenic Data” and it calculates population exposed to arsenic contamination. The sub-menu “Exposed Population” shows the population exposed to arsenic contamination through a bar chart as shown in figure 5. While the sub-menu “Decision-Support System” shows in figure 6.
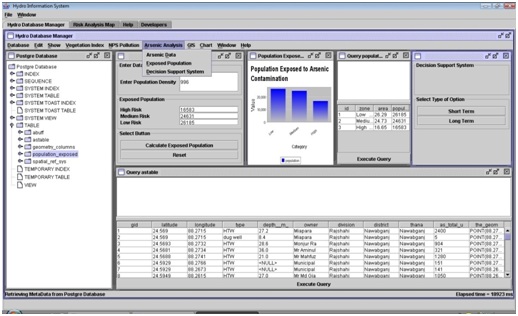 Figure 5: Features of different sub-menu and menu for arsenic analysis.
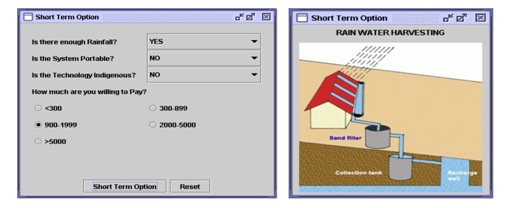 Figure 6: The DSS generated questions for short term options for rain water harvesting.
The DSS for potential mitigation measures for arsenic contamination is based on the algorithm developed by Shams et al. [10], as shown in figure 7, table 1, 2. The algorithm has shown in different Schemes (S).
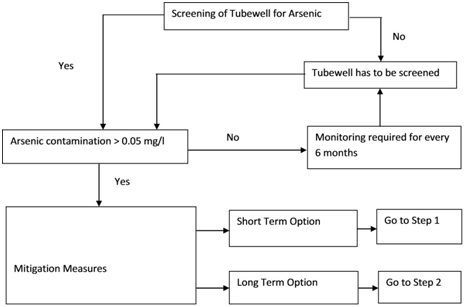
Figure 7: Flowchart showing algorithm for DSS.
|
Step 1: Short Term Option |
|
|
S1 |
IF |
|
S2 |
IF |
|
S3 |
IF |
|
S4 |
IF |
Table 1: Flowchart showing algorithm for short term option.
|
Step 1: Long Term Option |
|
|
L1 |
IF |
|
L2 |
IF |
|
L3 |
IF |
|
L4 |
IF |
|
L5 |
IF |
|
L6 |
IF |
A Java class file DSS java is created to accomplish this task based on the screening model as shown in figure 8. There are two options based on the timeframe, such as short-term and long-term options. Short-term options mainly consist of those options, which could assess to a temporary basis. These include rainwater harvesting, Bucket Treatment Unit (BTU), the three pitcher filter and Shafi filter. Long-term options mainly consist of those options that can run efficiently all around the year. These include piped water supply, deep tubewell, dug well, pond sand filter, SIDKO plant, and arsenic removal by adsorption using ferric oxy-hydroxide. The choice of the options depends on the timeframe, affordability and feasibility. If a safe water option is not available in a year round then it may be necessary to use one source during wet season (eg., rain water harvesting) and another during dry season (eg., arsenic removal filters). The health effects of arsenic are dose-dependent and a partial solution is better than no solution. Hence, it should be recalled that short term options should be considered while giving efforts for implementation of a long-term plan. The System is designed for the Public Health Engineers and it should reside on a server maintained by the Department of Public Health. The major benefits of this system is being web-based it can be accessed from a remote location using a specified username and password to log in to the system by the user/public health engineer. It would enable the user to come up with the most suitable mitigation measures based on different criteria. The system can aid public health engineers at Department of Public Health (DPHE) working in Government sector to identify arsenic contaminated tubewells quickly and propose either short or long term alternative options effectively.
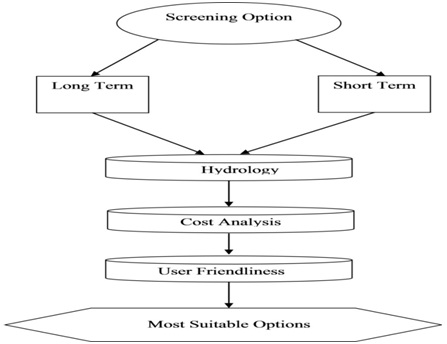 Figure 8: Screening options and its different steps leading to most suitable options for arsenic mitigations.
RESULTS AND DISCUSSIONS
The map generated by the OpenMap (based on buffer distance) shows that an area of 16.65 sq. km (24.61 % of the total generated map) with an estimated population of 16,583 is exposed to high risk zone, area of 24.73 sq. km (36.55 % of the total generated map) with estimated population of 24,631 is exposed to medium risk zone, area of 26.29 sq. km (38.85 % of the total generated map) with estimated population of 26,185 is exposed to low risk zone as shown in figure 9.
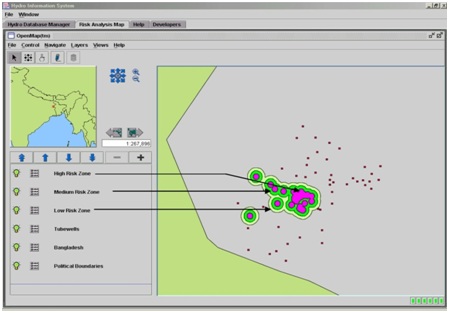 Figure 9: The map indicating high, medium and low risk zones based on buffer distance.
Arsenic concentrations in the 15 tubewells were below the contaminated level of 0.05 mg/L. 53 tubewells had arsenic concentrations of 0.05 to 9.99 mg/l, 10 tubewells had concentrations between 10 to 99.99 mg/L and the rest of the 29 tubewells had greater than 100 mg/L. The widespread occurrence of arsenic in the investigated tubewells points to natural geogenic sources similar to the situation in the Ganges delta [15]. A number of alternative safe water options now in practice were developed by the government through arsenic mitigation projects, and Donors like UNICEF, DANIDA (Danish International Development Agency), SIDA (Swedish International Development Agency) provided necessary grants to Department of Public Health (DPHE) for potential arsenic removal options. Each of these options have been assessed based on user responses on the following evaluation criteria such as cost, continuity of supply, ease of maintenance and social acceptability with a scale of 1 to 5 as discussed in Shams et al., [10].
Arsenic concentrations can vary seasonally depending upon an area’s geology [16]. Field kits are suitable to identify arsenic concentration greater than 0.2 mg/L. However, the field kits are not suitable for identification of arsenic concentration less than 0.2 mg/L and Laboratory test is recommend for lower concentration of arsenic even below 0.5 mg/L. In this study, the correlations either with water level depth or soil types has not been studied. A study carried out by Lalanne et al., demonstrated that 79 % of boreholes with elevated arsenic concentrations are located on volcano-sedimentary formations [17]. The detailed data related to water table depth of the tubewells and soil types could have indicated a better assessment of the arsenic risk exposure. Therefore, it is recommended that tubewells should be monitored for arsenic concentrations every six months. The spatial analysis was done based on the tubewells which were recorded with GPS and therefore it could be added that a significant number of tubewells were out of this database though they were screened for arsenic contamination. The problems with missing data could be avoided using GIS spatial analysis IDW (Inverse Distance Weight) or spline Interpolation technique. Apart from the GIS-based buffering and overlay mapping operations, a cokriging interpolation method was adopted because of its exact interpolation capacity [18]. The choice of proper interpolation technique is highly area specific. IDW is suitable for such kind of data, in which the value has a local influence that diminishes with distance whereas spline is suitable to those areas where there are little variations in the data within a short horizontal distance. Since there are little variations in the arsenic concentration value in the entire area, therefore spline interpolation technique would be more appropriate.
CONCLUSIONS AND FUTURE WORKS
The application of HIS in evaluating and making assessment of the contamination level of arsenic will assist the decision-makers to take potential mitigation options. The system is designed for the public health engineers working at the district level to assess the magnitude of contamination. The data entry into the system will take place by the public health engineers and any modification or knowledge can be easily updated. By risk analysis, less time and money need to be spent on the identification of severely contaminated areas. It could be used to estimate the impact of other minerals existing in the ground water and take effective mitigation measures coupled with DSS. From ground water contamination to surface runoff where spatial analysis with geo-features are important could be easily coupled with the system as it has GIS facilities in the form of OpenMap. The other advantage of the system is that it has the ability to demonstrate the result in the form of tables and figures that are easy to understand. The work has laid the basic foundations and principles based on which models could be used in an open source GIS compatible environment easily accessible from a remote location via the Internet.
We look for a computer system where it will use JAVA 1.2.1 in Windows NT environment that is supported by agent-based web technology. CORBA (Common Object Request Broker Architecture) is incorporating because it is a standard for structuring OOAs (Object-Oriented Applications). ORB (Object Request Broker) of CORBA provides bus for objects to communicate in the system.
To mediate intelligent agent for this work is a potential means. The activities of agents can be exhibited as scenarios. The versatility of these scenarios may not have enough potential for current applications. Software agents are computer programs that executes a number of tasks on behalf of a user or another program with considerable autonomy [13].
Scenario 1- Introducing between agents
President/ Chairman of an organization has instructed Agent 1 to look for data which is associated with arsenic contamination in general areas and topical region in particular. Being empowered with the instruction, Agent 1 looks forward to getting positive feedback. Agent 2 will sent a positive feedback to Agent 1 to supply the data. Agent 1 has recorded the name of Agent 2 into its list.
Scenario 2-Conversation about the task
Agent 1 has given the description of the data (eg., period, strength etc,.). Agent 2 has replied to Agent 1 that the proposed data could fulfil all requirements.
REFERENCES
- BRAC (2000) Combating a deadly menace: Early experiences with a community-based arsenic mitigation project in Bangladesh. Research and Evaluation Division, Dhaka, Bangladesh.
- Ahmed KM, Bhattacharya P, Hasan MA, Akhter SH, Alam SMM, et al. (2004) Arsenic enrichment in groundwater of the alluvial aquifers in Bangladesh: An overview. Applied Geochemistry 19: 181-200.
- Dawidowski A, Bzowski Z, Konopa W (2002) Application of Geographic Information System (GIS) to the assessment of soil contamination. International Carpathian Control Conference ICCC 2002, Malenovice, Czech Republic.
- Zhang J, Chen X, Parkpian P, Tabucanon MS, Mongkolsuk S (2001) GIS application on arsenic contamination and its risk assessment in Ronphibun, Nakhorn Si Thammarat, Thailand. Geographical Information Sciences 7: 69-78.
- Sinkevich MG, Walter MT, Lembo AJ, Richards BK, Peranginangin N, et al. (2005) A GIS based ground water contamination risk assessment tool for pesticides. Ground Water Monitoring & Remediation 25: 82-91.
- Burn S, DeSilva D, Ambrose M, Meddings, Diaper C, et al. (2006) A decision support system for urban groundwater resource sustainability. Water Practice & Technology 1: 2006010.
- Uslander T (2005) Trends of environmental information systems in the context of the European water framework directive. Environmental Modelling & Software 20: 1532-1542.
- Loucks DP, van Beek E (2005) Water resources systems planning and management: An introduction to methods, models and applications. Springer, Michigan, USA.
- Ames DP, Horsburgh JS, Cao Y, Kadlec J, Whiteaker T, et al. (2012) HydroDesktop: Web services-based software for hydrologic data discovery, download, visualization, and analysis. Environmental Modelling & Software 37: 146-156.
- Shams S, Bhattacharya P, Langaas S, Jacks G, Ahmed KM, et al. (2006) Mapping and interpretation of field data for evaluation and mitigation of groundwater arsenic contamination in Bangladesh. Journal of Hydroinformatics 7: 25-36.
- Shams S, Zakzok E, Chen D, Huang J (2010) Estimation and monitoring non-point source pollutant loads: An object oriented hydro information approach. International Journal of Environment and Waste Management 6: 220-236.
- Wood J (2002) Java programming for spatial sciences. Taylor and Francis, London, UK.
- Sarker MMH, Yousaf–Zai FQ (2013) A multi-agent structure for collaborative design. Journal HKIE Transactions 13: 44-48.
- BBS (2000) Statistical Pocket Book of Bangladesh. Bangladesh Bureau of Statistics, Dhaka, Bangladesh.
- Kinniburg DG, Smedley PL (2001) Arsenic contamination of groundwater in bangladesh, British Geological Survey, Michigan, USA.
- Hoffbuhr J (1999) Public affairs advisory about USEPA proposed arsenic rule. American Water Works Association, Washington, D.C., USA.
- Lalanne F, Bretzler A, Ahissan M, Zurbruegg C (2012) 21st Century watershed technology conference and workshop improving water quality and the environment conference proceedings, 3-6 November 2014, University of Waikato, New Zealand.
- Hassan MM, Atkins P J (2007) Arsenic risk mapping in Bangladesh: A simulation technique of cokriging estimation from regional count data. J Environ Sci Health A Tox Hazard Subst Environ Eng 42: 1719-1728.
Citation: Shams S (2019) Coffee Hydro Information System for Arsenic Risk Assessment and Mitigation. J Environ Sci Curr Res 2: 005.
Copyright: © 2019 Shahriar Shams, et al. This is an open-access article distributed under the terms of the Creative Commons Attribution License, which permits unrestricted use, distribution, and reproduction in any medium, provided the original author and source are credited.