Light Gradient and Moonlight Effects on the Ventral Calcified Stripes and the Thallus Aspects of Padina spp. on the Mediterranean Coast of Israel
*Corresponding Author(s):
Miriam BenitaThe Mina And Everard Goodman Faculty Of Life Sciences, Bar-Ilan University, Ramat Gan, Israel
Email:miriamzarbiv@gmail.com
Abstract
Light is an important abiotic environmental factor that dictates several dial, monthly and annual life patterns for most of the creatures on earth. Aside from its essential role as energy supporter of life on our planet, light may be dangerous and even deadly when overexposure occurs. Around the Israeli shores, intertidal organisms face high radiation most of the year, which exacerbated at ebb time due to desiccation. The Padina species, i.e., brown macroalgae inhabiting the Israeli abrasion platforms, seem to have means to protect themselves from excess light in such environments. They precipitate CaCO3 in the form of aragonite needle-shaped crystals arranged in concentric stripes located mainly on the ventral side of the frond. These ventral stripes cover the reproductive organs, which are located behind them on the dorsal side of the frond. The aragonite needle-shaped crystals in the apical stripes change to a flattened amorphous shape in older parts of the frond, probably due to wave erosion. We present here our results regarding the effect of light intensity and moonlight on rate of deposition of aragonite by the algae. It seems that from 19.6 μE to 380 μE the reflectance and the amount of CaCO3 are correlated and when there is more light-amount, there is more precipitation and more reflectance. Also, under full moon, the algae precipitate 40%wider stripes then under new-born moon.
INTRODUCTION
Coastal inhabitants are well adapted to their challenging environment, and thrive under extreme changes in pH level, turbulence, salinity, temperature [1], and solar radiation. Though light is crucial for physiological processes, intertidal macroalgae have to bear harmful high levels of visible light and UV radiation, since they are attached to the substrate (i.e., rocks) [2]. Padina species have to deal not only with those abiotic factors, but also with grazers, toxic dinoflagellates, foraminifera and more [3,4]. The constant environmental 'attacks' on Padina spp. lead to the evolution of effective protective strategies, resulting in their successful flourishing in shallow-water coastal domains. Most Padina spp. are known to deposit visible CaCO3 stripes [5,6]. Hence, many beneficial functions for the carbonate cover have been suggested, such as bad taste and rough texture against grazers [7], or mechanical support in their high-energy environment [5,8]; however, no conclusive evidence for any of these has been offered.
Our main goal in the present study was to examine the relationship of the Padina's aragonite cover with the ambient light field and its photo protective function.
Here, we demonstrate various light-intensity effects, from both artificial and natural light, on the aragonite deposition rates and patterns. We found that even a small change in light intensity affects the reflectance from the calcified parts of the thallus. We also describe the deposition patterns of the aragonite in relation to the distribution of Padina's reproductive organelles.
MATERIALS AND METHODS
Sampling
Microscopy
Binocular: Samples for binocular examination were fixed on petri dishes in a drop of seawater, examined, and photographed dorsally and ventrally from the apical top to the rhizoids (vertical axis).
Axio Z1: Samples for Axio Z1 were fixed onto ‘Superfrost+’ slides following histology embedding protocol.
Embedding protocol:
1. 80% ethanol for 1 hour or until start of embedding.
2. 80% ethanol for 1 hour.
3. 96% ethanol for 1 hour.
4. 96% ethanol for 1 hour.
5. 96% ethanol for 1 hour.
6. 100% ethanol for 1 hour.
7. 100% ethanol for 1 hour.
8. 100% ethanol for 1 hour.
9. First clearing agent-chloroform (AR)-for 1 hour.
10. Second clearing agent-chloroform (AR)-for 3 hours.
11. First wax (Paraplast X-tra) at 60°C for 3 hours.
12. Second wax (Paraplast X-tra) at 60°C for 1 hour.
Histology
The embedded tissue was placed into paraffin blocks (LEICA). The blocks were cut into 5 μm thick slices by a cutting machine, and placed in a 37°C bath in order to straighten them up. The sections were set up on 'Superfrost+' slides, dried for one hour on a 40°C plate, and kept in an incubator at 37°C overnight. The slides were stained for 15 min in alizarin red.
Light effects experiment on Padina pavonica
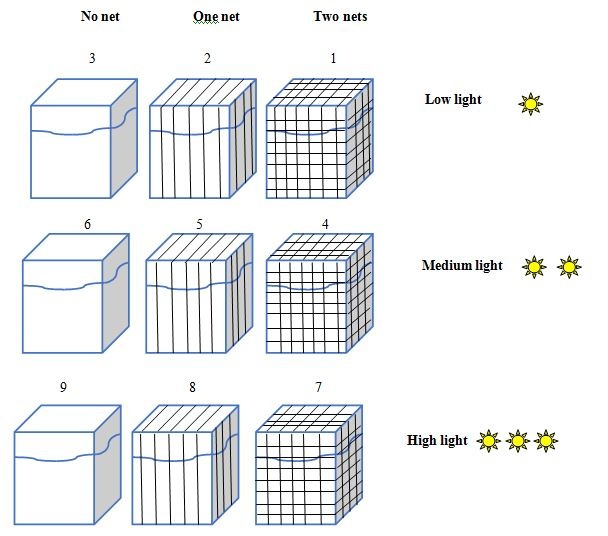 Figure 1: 5L aquaria under 9 different light gradient, mimicking the light gradient towards the depth.
|
Aquarium No. |
Light intensity (μmol quanta m-2s-1) |
Net layer No. |
|
1 |
4.6 (±2) |
2 |
|
2 |
8.3 (±5) |
1 |
|
3 |
19.6 (±3) |
0 |
|
4 |
160 (±7) |
2 |
|
5 |
260 (±3) |
1 |
|
6 |
290 (±5) |
0 |
|
7 |
380 (±6) |
2 |
|
8 |
475 (±12) |
1 |
|
9 |
2100 (±5) |
0 |
Moonlight stripe measurement
Statistical methods
In the Moonlight stripes measurement, two independent samples t-test was applied to compare random samples.
RESULT
Experiment
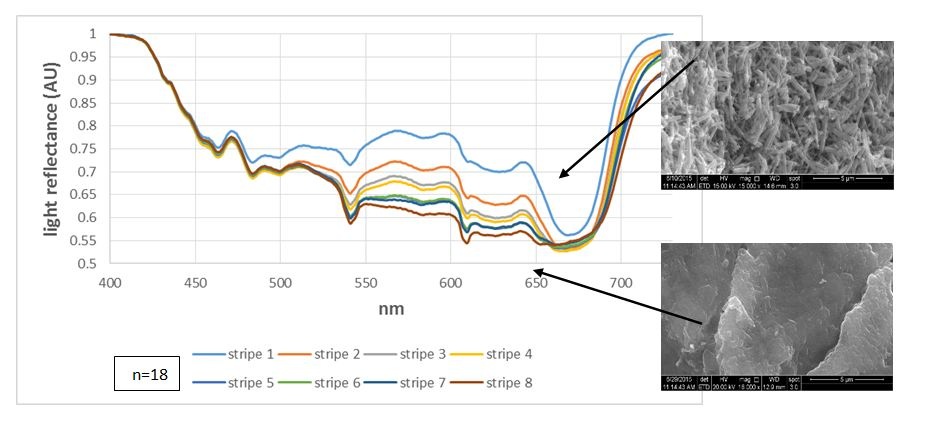 Figure 2: Light reflectance from the aragonite stripes under variant light conditions: Light reflectance from fresh algae showing the gradient reflectance as the first apical stripe reflects the most and the eighth stripe reflects the least. The pictures on the right show the CaCO3 morphology in those areas.
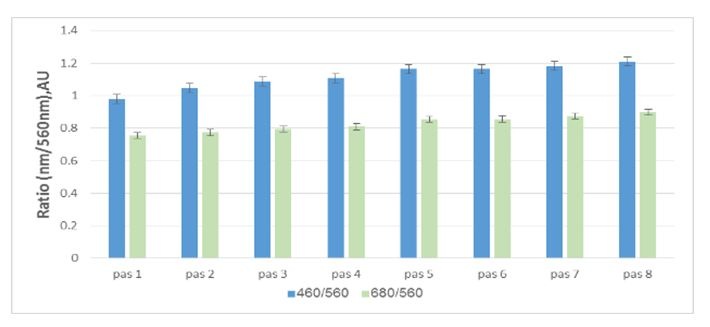 Figure 3: Light reflectance from the aragonite stripes under variant light conditions: Pigment ratio of fresh algae indicating the least absorption in the first apical stripe, increasing up to the eighth stripe.
This gradient light experiment attempted to mimic variant depths. By using equation no. 1, we calculated the approximate depth of each treatment, as seen in figure 4.
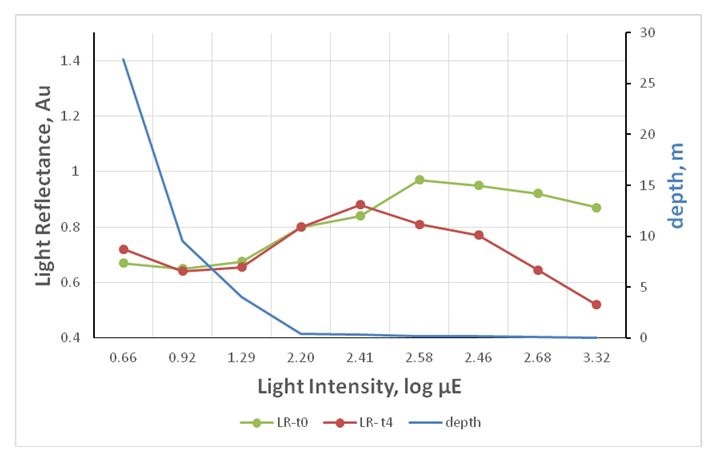 Figure 4: Light reflectance from the aragonite stripes under variant light conditions: Reflectance under variant light intensity mimicking depth gradient. The results indicating that there is less calcification in the depth and more calcification at the shore and under high light conditions (t0=after placing the experiment, t4=after full 4 days).
It seems that under a particular light intensity, the reflectance from the calcifying stripes increases as depth reduces (Figure 4, intensities 1.29-2.58 μE).
In contrast to mid-light, algae under high and dim light show the opposite results. The stripe reflectance showed some reduction under 0.9 μE and above 2.58 μE.
In comparing the spectral characters to ESEM, it seems that results are consistent from 19.6 μE upward, while under very low light (8.33 μE downward) the results are the opposite (Figure 5). Under high light, even though the spectral results show some correlation with the ESEM, there is more of a dramatic drop in the reflection rather than in the amount of the CaCO3.
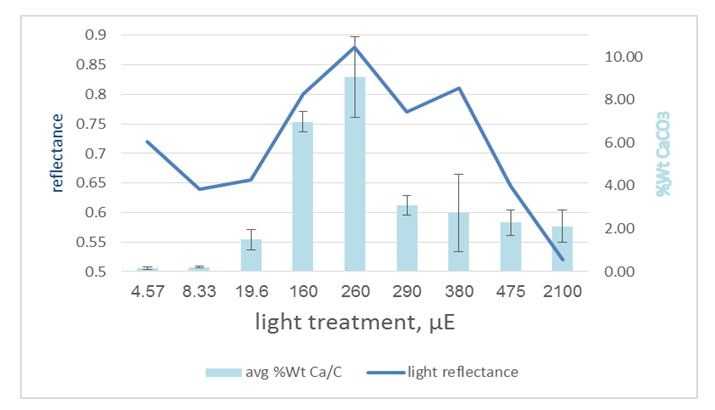 Figure 5: Light reflectance from the aragonite stripes under variant light conditions: Thallus average Ca/C weight ratio compared with the thallus average reflectance, showing some correlation around mid-light (160-500 μE) while there is some reverse correlation under extreme light conditions. This implies that under some conditions, the morphology overcomes the amount. p-value=2.83e-06.
Pigment quality expression (Figure 6) showed correlation with the spectral results, and it appears to be expressed more under low light (290 μE downward) and, furthermore, tends to be over expressed over time (t1 to t3). This suggests that under low light, the algae absorb light more than they reflect it, while under high light, reflectance overcomes absorbance.
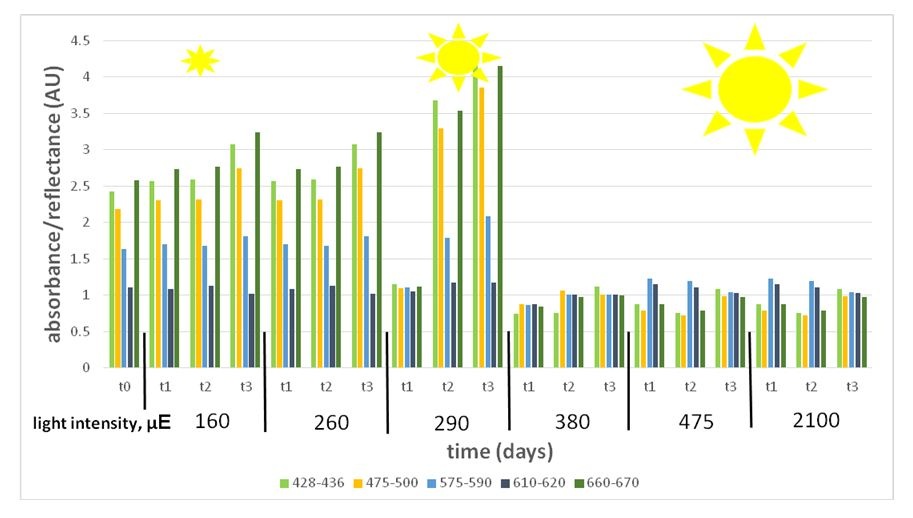 Figure 6: Variant wave length representing pigment expression under a light intensity gradient (160-2100 μE). Pigment absorbance under the different light intensities shows high expression under low light (160-290 μE) and low expression under high light (380-2100 μE).
Spore response: The dorsal side, in which the reproduction organelles grows on, gets lower amount of light, as seen in figure 7. In fresh algae, the meiospores and gametes are pigmented, spherical, and evenly spread along the reproductive stripes (Figure 8). Light stress affected the spores in several ways. Comparing the spores under high light (from 380 μE upwards) to those under low light (290 μE downwards) shows that low light spores are consistently larger (an average of 73±11.43 μm) than high light spores (an average of 59±5.58 μm). In spite of the large size, low light spores (290 μE downwards) did not fill the whole cysts, and some cysts turned empty and transparent (Figure 9), while under mid and high light (380 μE upwards), they were dense, fully diametric, and fully pigmented.
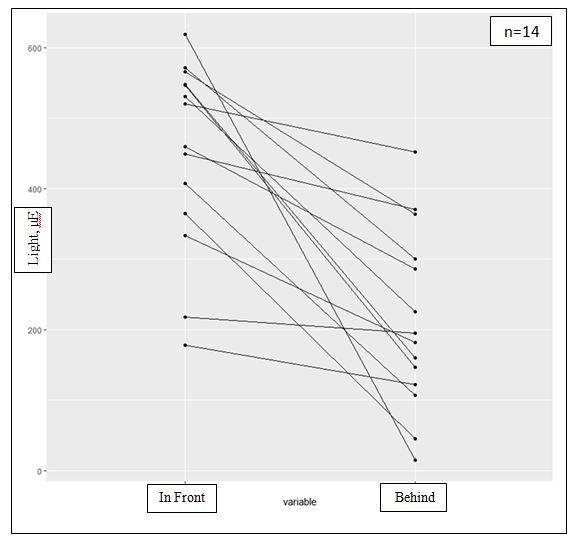 Figure 7: Different light amount arriving to the ventral and the dorsal parts and the effect of light intensities on the spores and tissue: The differences in the amount of light arriving in front of and behind fresh algae, illustrating the CaCO3 effective cover and the light protection on the dorsal reproductive cells. p-value=0.0001058.
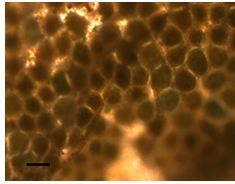
Figure 8: Different light amount arriving to the ventral and the dorsal parts and the effect of light intensities on the spores and tissue: Fresh algal spores showing consecutive and vital spores. Scale bar 100 nm.
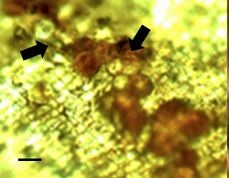 Figure 9: Different light amount arriving to the ventral and the dorsal parts and the effect of light intensities on the spores and tissue: Spores at the end of day 2 under low light (290 μE) appear less consecutive and look empty and transparent (arrows). Scale bar 50 nm.
In general, when considering all the parameters, it seems that under 260 μmol quanta m-2s-1, the spores had the greatest resemblance to fresh algae in size, density, color, and fullness of the cyst.
Tissue response: We observed a darkening of the thallus tissue under low light (290 μE downwards) that did not occur under high light. It seems that in the non-calcareous area, in between the aragonite stripes, some group of cells became darker and demonstrated excess pigmentation (Figure 10).
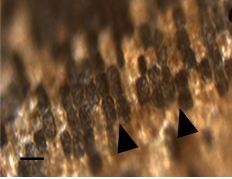 Figure 10: Different light amount arriving to the ventral and the dorsal parts and the effect of light intensities on the spores and tissue: Thallic cells blackening under 290 μE downwards (arrowheads). We can see that not all the cells change color and some remain at the same pigmentation levels. Scale bar 50 nm.
Experiment
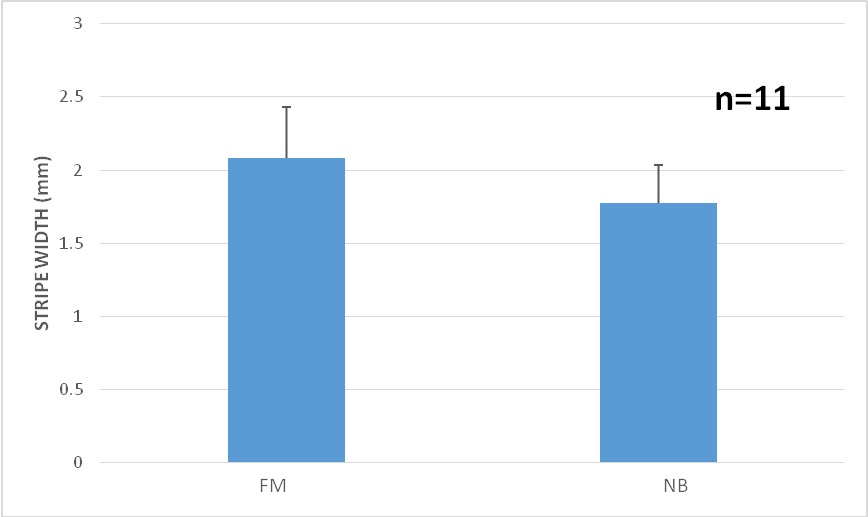 Figure 11: Moonlight experiment: Stripe width comparison under Full Moon (FM) vs. Newborn Moon (NB), findicating that the stripes are wider under the full moon. p-value=8.079e-07.
 DISCUSSION
Along with the life-supporting benefits that sunlight provides, there is also a dangerous side to it when overexposure occurs. Creatures who live along the shoreline need to develop means to protect themselves from excessive radiation, particularly during neap tide. In February 2016, we measured the solar radiation at Tel Baruch, and found an average of 2900 (±5) μmol quanta m-2s-1 at sea level and 1825 (±12) μmol quanta m-2s-1 at a depth of 10 cm. While microalgae can migrate vertically [10], benthic sublittoral macroalgae can suffer photobleaching when exposed to high radiation; therefore, intertidal species must be able to cope with excessive high radiation [6]. Padina spp. are able to cope with high light and excessive radiation as our light-intensity experiments shows by changing the CaCO3 precipitation according to light intensity the algae exposed to.
Fresh algae: In most cases, the natural reflectance from the aragonite stripes was the highest at the apical stripes, diminishing towards the mid-thallus (Figure 2). This suggests either quantitative approach, i.e., more apical precipitation, and therefor more reflectance, or qualitative approach, i.e., aragonite needles reflect more than when they are partly dissolved (CaCO3 morphology showed in figure 2, right ESEM pictures). The light reflection is opposite of the trend of pigment visibility, in which there is an increase from the apical stripes toward the mid-thallus (Figure 3). The reflection trend does not necessarily coincide with the amount of aragonite deposited, as found by ESEM (Figure 3, stripes/pas 1-5, n=3). These results strengthen the hypothesis that the crystallography, rather than deposition amount, and the layers of cells placed behind this deposition, affect reflectance.
Both reflectance and the carbonate content of stripes are modified by temporal changes in the deposition/dissolution ratio. This is evident in the age-dependent change in the calcification of the stripes, as it decreases from the growing tip of the frond towards its older parts. We also suggest that the reported change in stripe width according to the lunar cycle may be due to periodic dissolution/deposition of the aragonite cover. As mentioned, Tel-Baruch's P. pavonica has dorsal reproductive stripes located right behind the ventral aragonite stripes (Figure 7). This particular location strongly implies that the young, delicate reproductive tissue benefits from the protection afforded by the aragonite and that the alga saves energy as the precipitation does not occurs all over the thallus. It seems that the spores need enough light to develop to be fully diametric and colored but not accessed light which seems to be a trigger for the cyst to release the spores to the water column [11,12]. The pigment absorption and the aragonite reflectance are inversely correlated since the aragonite hides the pigmented layer underneath it and thus lessens its optical signal.
To conclude the light characters of fresh algae, our results show that the apical stripes reflect more and absorb less, while the mid-thallus stripes are less reflective and more absorbing, regardless of the amount of precipitation.
Light manipulated algae: Under different light conditions that mimics the depth gradient (Figure 4), the algae showed the same reflectance pattern, though reflectance deteriorated dramatically after 4 days under high gradient light (260 μE upward).
In comparing reflectance of CaCO3 to its amount under extreme light intensities (high and low), it seems that Ca+2 amount is opposite, i.e., when there is more Ca+2, there is less reflectance, and vice versa. This is not the case under mid-light (160-290 μE), where the spectral and ESEM results seem to be correlated (Figure 5).
These results strengthen the theory that the morphology of CaCO3 is more effective than its amount. It is plausible that under low light, the needles direct the light to other parts of the thallus (i.e., extra pigmented cells located in-between the ventral CaCO3 stripes) in order to use it for photosynthesis and signaling, while under high light conditions, the needles reflect and divert light away from the thallus in order to protect the tissue and the spores. This acclimation of extra pigmentation under low light was observed by Foy and Gibson[13] when they exposed the blue cyanobacteria Oscillatoria redekei to different light intensities (13-160 μE) and it seems that these changes in other macro-algae can accrue on a daily bases influents by the sunlight [2] (Figures 12 and 13).
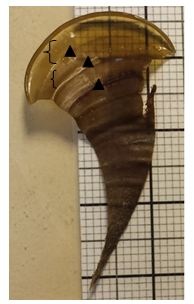 Figure 12: Part of Padina's Thallus, ventral side- Concaved CaCo3 stripes (curly bracket) and sticking out in-between the extra phaeoplasts cell lines (arrowhead). Taking with Samsung galaxy S3.
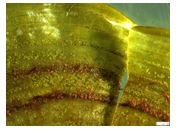 Figure 13: Dorsal close up on the spores behind the CaCo3 stripes. Taking with Leica binocular (Zeiss).
Comparing young and old calcified stripes, it seems that the needles reflect and spread even the smallest amount of light that reaches the algae in favor of metabolism, while in the old part of the thallus, where the aragonite cover is amorphous, the light is mainly reflected rather than diverted. This idea requires experimental validation. It also seems that the algae can daily acclimate themselves to the light changes that occur during the day. The moonlight experiment strongly supports this theory; showing wider stripes during full moon (see Section 4.2). The light gradient changed the dorsal organelles properties as well, and under low light, the reproductive stripes were emptier, and the cysts were smaller and transparent (Figures 7 and 8), thus supporting a previous research claiming that light is a spore's release trigger [14].
In comparing all the results, it was found that, in vitro, a medium amount of light (160-290 μE) is the most efficient condition allowing precipitation to reflect more light and for the spores to have pigmentation, full cyst diameter, and to develop to a satisfactory size.
The darkening of the thallus, along with the spores' transparency under extreme low and high light, shows cytology changes –is supporting the ideathat a calcification process occurs in order to provide some protection to the tissues, particularly the young ones, i.e., young thalli, new apical cells and reproductive cells. The 40%thicker CaCO3 stripes under a full moon (Figure 11) gives some reinforcement to the in-vitro-experiment results, and considering all the results together, CaCO3 deposition is influenced by light.
CONCLUSION
The algal fauna and the habitat in which Padina spp. flourish in the Mediterranean Sea and at the Israeli shores in particular, cope with more sunny days annually, even at winter time. Our results shows that Padina calcification is motivated and changes according to the environmental amount of light. Under low light stress, the algae probably prefer to divert the light that they get towards the thallus cells (along with darkening some of this cells) for metabolism, while under high light stress, reflection is probably to protect the tissue and the spores and preventing sun radiation damage.
REFERENCES
- Befus KM, Cardenas MB, Erler DV, Santos IR, Eyre BD (2013) Heat transport dynamics at a sandy intertidal zone. Water Resources Research 49: 3770-3786.
- Figueroa FL, Salles S, Aguileral J, Jimenez C, Mercadol J, et al. (1997) Effects of solar radiation on photoinhibition and pigmentation in the red alga Porphyra leucosticte. Marine Ecology Progress Series 151: 81-90.
- Vila M, Garcés E, Masó M (2001) Potentially toxic epiphytic dinoflagellates assemblages on macroalgae in the NW Mediterranean. Aquatic Microbial Ecology 26: 51-60.
- Pettit LR, Smart CW, Hart MB, Milazzo M, Hall-Spencer JM (2015) Seaweed fails to prevent ocean acidification impact on foraminifera along a shallow-water CO2 gradient. Ecology and Evolution 5: 1784-1793.
- Okazaki M, Pentecost A, Tanaka Y, Miyata M (1986) A study of calcium carbonate deposition in the genus Padina (Phaeophyceae, Dictyotales). British Phycological Journal 21: 217-224.
- Geraldino P J L, Liao LM, Boo SM (2005) Morphological study of the marine algal genus Padina(Dictyotales, Phaeophyceae) from Southern Philippines: 3 Species New to Philippines. Algae 20: 99-112.
- Gil-D?´az T, Haroun R, Tuya F, Betancor S, Viera-Rodr?guez MA (2014) Effects of ocean acidification on the brown alga Padina pavonica: Decalcification due to acute and chronic events, Plos one 9: 108630.
- Hamylton S, Pescud A, Leon JX, Callaghan D (2013) A geospatial assessment of the relationship between reef flat community calcium carbonate production and wave energy. Coral Reefs 32: 1025-1039.
- Stambler N (2013) The glory of the sea: Stability and change in the aquatic systems of Israel, (1stedn). The Israeli Association of Aquatic Sciences, Israel.
- Pinckney J, Piceno Y, Lovell CR (1994) Short-term changes in the vertical distribution of benthic microalgal biomass in intertidal muddy sediments. Diatom Research 9: 143-153.
- Santelices B (2009) Patterns of reproduction, dispersal and recruitment in seaweeds. Oceanography Marine Biology Annual Review 28: 177-276.
- Vasuki S, Ganesan M, Rao SPV (2001) Effect of light intensity, photoperiod, ESP medium and nitrogen sources on growth of marine brown alga Padina boergesenii (Dictyotales, Phaeophyta). Indian Journal of Geo-Marine Sciences 30: 228-231.
- Foy RH, Gibson CE (1982) Photosynthetic characteristics of planktonic blue-green algae: Changes in photosynthetic capacity and pigmentation of Oscillatoria redekei van Goor under high and low light. British Phycological Journal 17: 183-193.
- Brawley SH, Johnson LE (1992) Gametogenesis, gametes and zygotes: An ecological perspective on sexual reproduction in the algae. British Phycological Journal, vol. 27: 233-252.
Citation: Benita M, Segman R, Iluz D, Dubinsky Z (2019) Light Gradient and Moonlight Effects on the Ventral Calcified Stripes and the Thallus Aspects of Padina spp. on the Mediterranean Coast of Israel. J Environ Sci Curr Res 2: 006.
Copyright: © 2019 Miriam Benita, et al. This is an open-access article distributed under the terms of the Creative Commons Attribution License, which permits unrestricted use, distribution, and reproduction in any medium, provided the original author and source are credited.