Journal of Environmental Science Current Research Category: Environmental science Type: Research Article

Petroleum Hydrocarbon Contents in Tropical Soils near Crude Oil Exploration and Processing Site in Niger Delta, Nigeria

Uduak Udoinyang1, Edem Dennis1* and Akabio JHU2
1 Department of soil science and land resources management, University of Uyo, Uyo, Nigeria
2 Faculty of architecture, Cross River State University of Technology, Calabar, Nigeria

*Corresponding Author(s):
Edem Dennis
Department Of Soil Science And Land Resources Management, University Of Uyo, Uyo, Nigeria
Tel:+234 8027031426,
Email:dennis.edem@gmail.com

Received Date: Feb 14, 2019
Accepted Date: Mar 05, 2019
Published Date: Mar 19, 2019

Abstract

Petroleum Hydrocarbon contents in tropical soilshas been increasingly recognized as an important soil degradation factor in crude oil producing areas. Hydrocarbon can impact and contaminate the soil apart from playing nutrient inhibition role in the soil. The application of an effective and sensitive analytical method to determine soil contaminants is a crucial step in monitoring and remediation processes. In the present work, we optimized the analysis of Volatile Organic Compounds (VOC) commonly present in fuel: Quantitation of fluorobenzene and monoaromatic hydrocarbons such as Benzene, Toluene, Ethylbenzene and Xylene (BTEX). At impacted locations of Well-Head (WH), Group Gathering Facility (GGF), Group Processing Facility (GPF) and non-impacted sites served as the control. Headspace (HS) and Headspace-Solid Phase Microextraction (HS-SPME) were optimized in water samples, and validated for contaminated soils, using spiked soils. Contaminants were identified and quantified by Gas Chromatography coupled to Mass Spectrometry (GC/MS). Average BTEX (2.50mgkg-1) and TPH (4.0mgkg-1) were significantly higher in GGF and the concentration was below detection limit in GPF. Examination of regression lines of BTEX and TPH to internal standard on concentration using a least-squares fit demonstrated a linear relationship with correlation coefficients was consistently greater than 0.999 at the impacted sites.

Keywords

Benzene; Crude oil; Exploration; Gasoline; Hydrocarbon

INTRODUCTION

Volatile Organic Compounds (VOCs), such as Benzene, Toluene, Ethylbenzene, Xylene and (BTEX), are important environmental contaminants because of their toxicity and widespread occurrence. They are present in aviation fuel and petrol (gasoline) and are widely used industrial solvents and raw materials [1]. Benzene, toluene and ethylbenzene are amongst the compounds designated ‘priority pollutants’ by the US EPA and action levels for BTEX [2], Soils become contaminated with BTEXC through spillage of industrial solvents, leakage of petrol from storage facilities (particularly underground holding tanks) and deposition from contaminated air [3]. Moreover, BTEX are used as solvents for many purposes and because of their relative solubility in water they can contaminate the soil and groundwater, and thus provoking environmental pollution [1].

In the recent past, their toxicity and carcinogenetic effects, in the case of benzene, have become a serious concern for human health. The admitted limits for benzene in drinking water are set at 5 and 1μgL–1 in United States and European Union, respectively [4]. After the accidental contamination of soil and water, the BTEX concentrations are generally several orders of magnitude higher. Several methods are used for BTEX determination and the choice among the various extractions, separation and detection techniques also depends on the matrix to be analyzed [5]. In water and soil the most commonly employed methods are based on solid-phase micro extraction (SPME) coupled to Gas Chromatography-Mass Spectrometry (GC-MS), or to a Gas Chromatography-Flame Ionization Detector (GC-FID). BTEX determination using gas chromatography is quite time consuming, and needs special instrumentation, and thus the development of alternative methods that could be used even on-site is highly required [2].

The aim of the present work was to quantify hydrocarbons such as Benzene, Toluene, Ethyl benzene and Xylene (BTEX) on soils at the focal point of different production sites of Qua Iboe Terminal crude oil exploration fields at Ibeno.

MATERIALS AND METHODS

Experimental site and soil

The study was carried out at Ibeno (latitude 4.5488°N and longitude 8.0093°E), near Mobil Producing Company, Qua Iboe Terminal (QIT) fields. The site has a mean altitude of 78m above sea level. The area falls within the tropical rainforest. The climate of Ibeno can be described as sub-humid tropics with distinct dry and wet seasons. The dry season runs from end of November to mid-March, while the wet season is from mid-March to Early November. There are two rainfall peaks which occur in June and September with dry spell in August (August break) and result in bimodal rainfall pattern [6]. Based on the rainfall pattern, there are two growing seasons: early (March to August) late (mid-August to November). The mean annual rainfall recorded for a period of 10 years in the area was 2500mm [7]. 

The temperature of the area like most tropical environment is generally high. The average annual maximum temperature is 34.8°C for the period of 10 years, while the average annual minimum temperature is 24.3°C for the same period [6]. February and March have the highest evaporation rate, and it is as high as 6.9mm. The least evapotranspiration rate (1.6mm) is recorded in June/July. This pattern is directly related to the pattern of rainfall/cloud cover and atmospheric temperature. Sunshine hour is also directly related to cloud cover. Daily average sunshine hours range from 7.5 hours in January to 14 hours in August. The relative humidity is relatively high throughout the year. It ranges from 60% in February to 90% in June. Thus, the highest values are recorded at the height of rainy season, while the lowest values occur during the dry months [6].

Soil Sampling

Soil sampling was carried out at the crude oil spilled site and the adjacent non-spilled soil to ascertain the baseline properties on the surface soil (0-15cm) and subsurface (15-30cm) soil layers (Figure 1). The impactedcrude oil spilled site were Well-head (WH), Group gathering facility (GGF), Group processing facility (GPF) and adjacent non-impacted sites served as the control. A total of 8 auger and 8 core samples were collected using systematic soil sampling technique. The auger samples were bulked to represent a composite sample per traverse. The soil samples were air dried and sieved with 2.00mm sieves for particle size distribution and hydrocarbon content analyses.
 
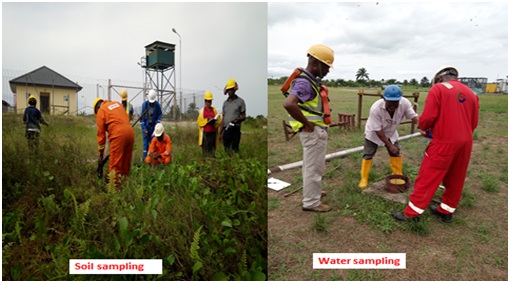
Figure 1: Samplings near the exploration sites at QIT.

Analysis of soil samples

Determination of soil physical properties: Particle size distribution, bulk density, total porosity, saturated hydraulic conductivity, moisture content, water stable aggregates and mean-weight-diameterof the soil were determined as follows:

Particle size distribution: Soil samples collected from each strips were air dried and allowed to pass through 2.00mm sieve. This is to remove any plant materials and stones from the soil samples. Thereafter, sand, silt and clay particles were determined using a modified Bouyoucos hydrometer method as described by Grossman and Reinsch [8]. The soil textural class was estimated using soil textural calculator software.

Bulk density and total porosity: Coring method, as described by Grossman and Reinsch [8], was used to determine the soil bulk density. Undisturbed samples were collected within the strips down the traverse. The sharp end of a cylindrical metal core (5cm in diameter and 7.5cm in height) was driven vertically into the soil.To avoid compaction; another ring of the same size was placed on it to push the first ring completely entered into the soil. The uniform entry of the ring into the soil was achieved by placing a piece of plank on top of the ringwhile hammering it. The plank was hammered at the center until the ring beneath entered completely into the soil. A hand trowel was used to remove the cylindrical core from the soil while excess soil was trimmed off from it. The soil in the core was emptied into moisture canandthereafter oven dried to a constant massat 105°C. Bulk density was calculated using the following relationship:


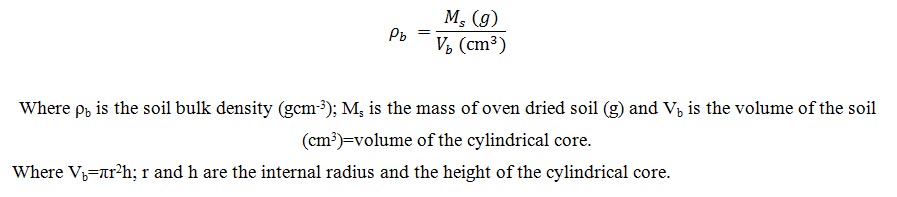
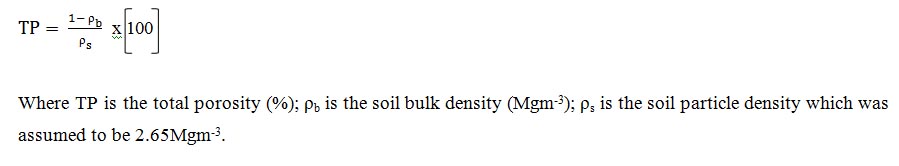
Total porosity:
 (TP) was determined from the relationship between the bulk density and the particle density as:
 
Saturated hydraulic conductivity: (Ks) was determined using a constant head water permeameter method of Reynolds et al. [9], and transposed Darcy’s equation for vertical flow of liquid as described by Reynolds and Elrick [10]:


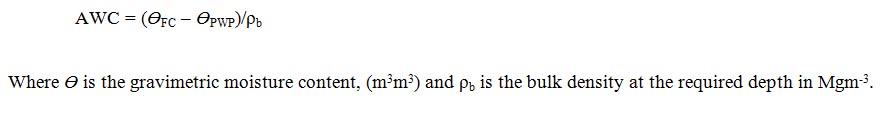
Moisture content:
 (MC) expressed on volumetric basis, was estimated as the different between Field Capacity (FC) obtained at 10 kPa (-100cm water) and Permanent Wilting Point (PWP) at 1500 kPa (-15,000cm water) using:
 
 
Determination of macro and micro aggregates: Macro-aggregates (macro-pores or inter-aggregates) are large soil pores usually between aggregate that are generally larger than 0.08 in size, thus, permit the passage of fluid (oil and water) ease. Micro-aggregates (micro pores or intra-aggregates) are tiny soil pores often seen within the aggregate structure. Suction is needed to drive water from micro pore. It fosters the retention and release of water and solutes [11]. Macro and micro aggregates were determined from the volume of a sphere and cubic packing of aggregates as described.

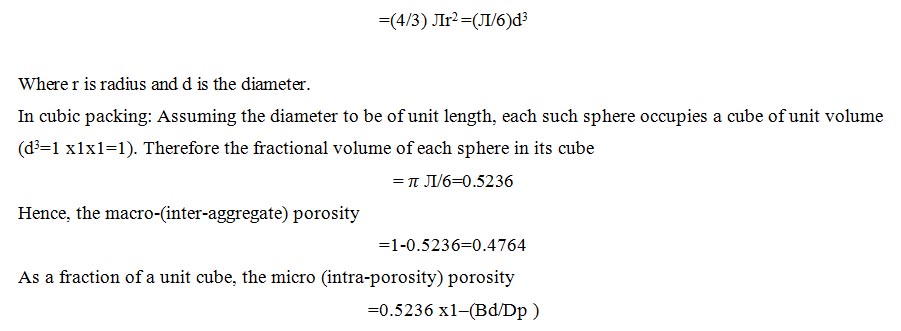
To determine the micro porosity of the aggregates, recall:
Total porosity and that the volume of a sphere:
 
Water stable aggregates and mean-weight-diameter: Water Stable Aggregates (WSA) was determined using a modified Kemper and Rosenau (1986) wet sieving method as described by Nimmo and Perkins (2002). Soil sampling for WSAanalysis was carried out with undisturbed soil samples.
Procedures: A wet-sieving method similar to that described by Kemper and Rosenau (1986) was adopted. The apparatus required for the method includes a nest of sieves with openings 4.75, 2.0, 1.0, 0.25 and 0.045mm and moisture cans (250 capacity). Also, sodium hexametaphosphate (calgon -0.5%w/v) is used to separate sandfrom soil aggregates. 

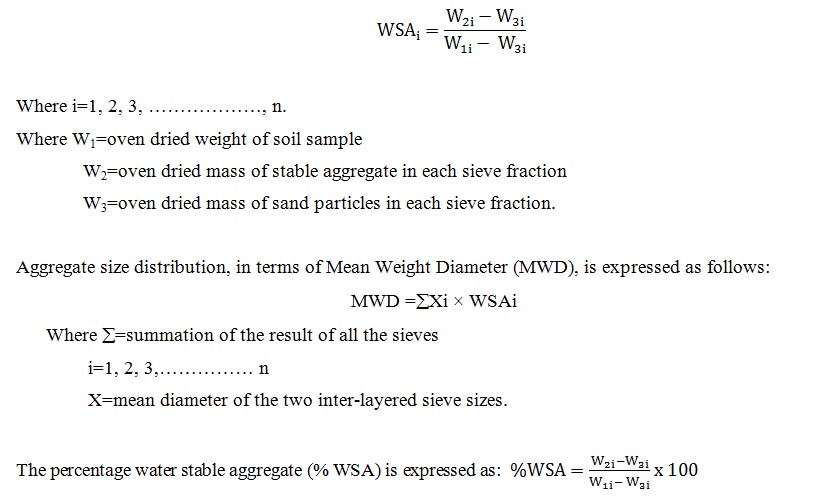
Fifty gram (50g) of air-dry soil aggregates was weighed, after passing through 8 mm sieve. The initial masswas recorded as W1. The soil sample was thereafter placed on the uppermost (4.75mm) sieve with other nest of sieves: 2.0mm, 1.0mm, 0.25mm and 0.045mm placed below it in that order.The nest of sieves was immersed in water such that the soil at the top of 4.75mm sieve was wet by capillarity. The height of the nest of sieves was adjusted such that the soil sample on the sieves remains immersed in water on the upstroke of the dipping machine. The set of sieves was cycled through a column of water for 10 minutes (30 cycles per min, 4.0cm stroke length). 

The soil retained on each sieve was washed into moisture can with distilled water. Each fraction of the retained soil was oven dried at 105oC to a constant mass W2. Water and 10 ml of calgon (sodium hexametaphosphate) (0.5% w/v) were added to the oven-dried soil for chemical dispersion and thereafter dispersed for 10 minutes using mechanical stirrer. The two dispersion processes were carried out to separate the sand particles from the soil aggregates. The sand particles were washed into the corresponding moisture can and then oven dried at 105oC to a constant mass W3.
Computation of Water Stable Aggregate (WSA) and Mean Weight Diameter (MWD): The proportion of water stable aggregate (WSA) in each of the sieve size fraction was calculated as the following:
 

Analysis of petroleum hydrocarbons from contaminated soils

Reagents and standards: The following reagents were used: benzene (purity, 99.8%; grade, PAI ACS (UV-IR-94 HPLC-GPC)), toluene (purity, 99.8%; grade, PAIACS (UV-IR-HPLC-GPC)), ethylbenzene (purity, 99%; grade, PS), xylene (purity, 99%; grade, PA (Reag.USP. Ph. Eur). Standard solutions of BTEX was prepared in methanol (purity, 99.9%; grade, PAI (PAR), with the reagents at a concentration of 100mgL-1 [12]. These solutions were used for the preparation of standards and for soil spiking.

Preparation of Samples for TPH: Due to the relatively high volatility and instability of TPH [13], soils were not prepared using conventional soil preparation techniques such as drying, grinding and sieving to obtain total homogeneity prior to sub-sampling. Therefore, to homogenize and prepare the soils, a delicate balance between optimum homogeneity with minimum losses was considered. Soil samples were placed in 250mL glass jars with screw tops and Teflon liners to minimize losses. These jars were placed in a refrigerator at 4°C overnight prior to sampling by removal of the top 5cm [14]. Gravel, twigs or other material was removed from the jars. The free-flowing sandy soil samples were end-over-end shaken for 10min and a composite was collected from different locations within the jar. For sticky (clay material) samples, an apple corer was used to collect sub-samples from different locations within the jar to obtain a representative composite.

Extraction of soil samples: These soils were homogenized and the analytical determinations of the hydrocarbons in the soil extracts were performed by Infrared Spectrophotometry (IR). Quantitative of the Total Petroleum Hydrocarbon (TPH) content was done using the procedure described in U.S. EPA Method 8440 [15]. After collection, the extracts were passed through sodium sulfate and silica gel to remove water and polar constituents. An aliquot of the extract was then placed in the IR analyzer. The TPH value was determined by comparison to a three-point calibration curve constructed from dilutions of a stock solution of a 2:3:3 volume ratios of chloro-benzene, isooctane, and N-hexadecane made up in Perchloroethylene (PCE) [3].

Soxhlet extraction: The Soxhlet extraction equipment was modified to obtain the optimum extraction time by assembling a Soxhlet system with a round-bottom flask containing two necks, the side neck used for collecting sub-samples during the extraction process. Homogenized soil (25g) was weighed into a Soxhlet thimble and the thimble was placed in a Soxhlet extraction tube above a two-neck, round bottom flask containing 300mL of Dichloromethane (DCM)/acetone (1:1, v/v). The entire Soxhlet assembly was placed on a boiling water bath with running water condenser. The Soxhlet extraction was carried out for 8 h at a rate of 10cycles/h [16]. At the end of theextraction period the solution was decanted into an evaporator and the volume reduced to approximately 100mL. The solution was quantitatively transferred into 100mL volumetric flask and after the volume was adjusted to the calibration mark with DCM, shaken to obtain homogenization prior to analyses.

Spiked samples: Spiked distilled water standards of 500μgL-1 of individual BTEX (benzene, toluene, ethylbenzene and xylene) were used for optimization. 2mL of distilled water and 10 μL of standard solution were added in 22mL Volatile Organic Analysis (VOA) vials and hermetically closed and homogenized before analyzing. Samples of the crude oil contaminated and non-contaminated soils from Ibeno were used. According to USEPA Method 5021A (volatile organic compounds in soils and other solid matrices using equilibrium headspace analysis) [15], the soil was mixed with organic free distilled water to create a slurry. One gram of sample was mixed with 2 mL of distilled water, and the slurry was spiked with the standard solution until 1000μgkg-1 of individual BTEX. The slurry was stabilized in hermetically sealed VOA vials at 4°C for 7 days before analyzing [17]. Calibration standards were prepared with the 100mgL-1 standard in VOA vials with 2mL of distilled water. Fluorobenzene was added to the soil samples as surrogate or matrix effect corrector, during the spiking process and stabilized at 4°C. Fluorobenzene concentration was also maintained constant at 5000μgkg-1. The VOA vials containing the samples were heated in the HS oven, with constant agitation and for a suitable period of time to achieve an acceptable equilibrium between the HS and the sample. When the VOA vial contains an aqueous sample, the equilibrium takes place between the liquid and the headspace of the vial. When there is soil/water slurry, the equilibrium takes place among three phases (soil, water and headspace) and the interaction of soil with the sorption provoked a lower displacement towards the headspace, compared to water standards, where there are no sorption processes.

Volatile Organic Compounds (VOCs) penetration was also measured from each borehole using a Photo Ionization Detector. Stand-type piezometers were installed at performed boreholes for groundwater level and quality monitoring.

Statistical analysis of experimental data

The statistical analyses were performed using the General Linear Model Procedures (GLM Proc) of the Gen Stat statistical software. Analysis of variance (ANOVA) was employed to evaluate the significance of treatment effects on data collected. Means that show significant differences were separated using Least Significant Difference (LSD) at 0.05 probability level. Also, regression analysis was used to assess the relationship of BTEX and TPH with internal standard on concentration based on least-squares fit.

RESULTS AND DISCUSSION

Soil physical properties

Particle size distribution

Sand content: Among the impacted locations, there were no significant changes in the composition of sand fraction of the surface soil between facility 1 and 2 (WH; 49.2 and GGF; 48.6%, respectively) (Table 1). Significantly high (P<0.05) sand content was recorded in the control soil (Control; 76.3%). The trend of sand fractions was in the order of Control>GPF>GGF=WH. In the subsurface depth, sand fraction significantly dominated WH and Control, whereas sand content in GPF (45.8%) was significantly higher GGF (38.7%), but the contents in both locations were significantly lower than WH (69.5%) and Control (68.2%). When comparing the sand fractions between the surface and the subsurface depths, sand fraction was 3.0% higher on the surface than in the subsurface.
 

Locations

Sand

Silt

Clay

Texture


Surface Soil (0-15cm)

WH

49.21c

28.59a

22.2b

Loam

GGF

48.64c

28.03a

23.33b

Loam

GPF

55.33b

19.1b

25.57a

Sandy loam

Control

76.33a

13.2c

10.47c

Sandy loam


Sub Surface Soil (15-30cm)

WH

69.5a

13.83c

16.67d

Sandy loam

GGF

38.67c

28.0a

33.33b

Clay loam

GPF

45.83b

18.5b

35.67a

Loam

Control

68.17a

12.83c

19.02c

Sandy loam

Table 1: Particle size analysis for surface and subsurface soil at near exploration sites.

Note: WH is Well Head, GGF is Group Gathering Facility, and GPF is Group Processing Facility 
Means followed by different letter is significantly different (?=0.05)

Silt: The oil pollution differed significantly in term of silt content of the surface soil (Table 1). The silt particles in the polluted facility 1 and 2 were statistically similar (28.6% and 28.0%, respectively) and higher than GPF (19.1%) and control (13.2%). In the subsurface IB/SS3 with (GGF) recorded the highest silt particles of 28.0% followed by GPF (18.5%), and the particles in WH (13.8%). In comparison to the surface depth, silt in the subsurface depth increased by 21%.

Clay: There were significant differences among the locations with regard to the clay content of the surface soil in both polluted and control soils (Table 1). The impacted location 3 had clay particles (25.6%) significantly higher (P<0.05) than other areas GGF (23.3%), WH (22.2%) and control (10.5%). However, there were no significant differences between GGF and WH with regard to clay particles in on the surface soil. In the subsurface, significantly high content of clay was noticed in GPF (35.7%) and GGF (33.3%). But the content in the control (19.0%) was higher than WH (16.7%). When compared to the clay status in the subsurface, the clay content on the surface was 22.1% lower than the subsurface. The textural classes on the surface varied from sandy loam in the control and GPF to loam in WH and GGF, whereas, in the subsurface depth, the textural classes were sandy loam (WH and control), clay (GGF) and loam (GPF).
 
Bulk density and total porosity: Soil bulk density showed any significant difference (P<0.05) among the impacted sites and the control (Table 2). On the surface of the impacted sites, soil bulk densities for impacted soils were typical of organic soil the values were 0.41, 0.31 and 0.78Mgm-3 for WH, GGF, and GPF, respectively and 1.43Mgm-3 for control site. In the subsurface soil, values for bulk density were 0.46, 0.52, 0.84Mgm-3 for the respective impacted site and 1.67Mgm-3 for the control site. 


Stable Aggregates


BD

Ksat

Porosity

Moisture content

Micro aggregates

Macro aggregates

MWD

Locations

Mgcm-3

×10 cmhr-1

m3m-3

m3m-3

%

%

mm

Surface

WH

0.41

1.0

0.845

0.63

14.8

1.53

1.24

GGF

0.38

0.8

0.856

0.75

11.48

1.42

1.29

GPF

0.78

1.4

0.705

0.57

11.53

1.86

1.3

Control

1.43

3.7

0.460

0.42

13.56

1.12

1.87

Subsurface

WH

0.46

1.4

0.826

0.66

12.15

3.69

0.95

GGF

0.52

0.2

0.804

0.78

48.75

1.01

0.96

GPF

0.84

1.2

0.683

0.59

14.35

2.98

1.18

Control

1.67

2.6

0.370

0.48

14.7

2.59

2.09

Table 2: Bulk density, saturated hydraulic conductivity and stable aggregates to water at Ibeno.
Note: BD=Bulk Density; Ksat=saturated hydraulic conductivity, MWD=Mean Weight Diameter of soil aggregates.
 
However, contamination of soil by crude oil reduced bulk density from 1.44Mgm-3 on the surface soil to average bulk density of 0.52Mgm-3 and from 1.67Mgm-3 to 0.61Mgm-3 in the subsurface depth.

Total porosity followed a reciprocal trend to soil bulk density, and there were significant differences among the sites (Table 2). At the surface soil, total porosity for the impacted sites was higher than the control. Surface porosity for the impacted sites was; 0.85, 0.86 and 0.71m3m-3 for WH, GGF, and GPF, respectively and control site was 0.46m3m-3. In the subsurface layer, porosity values were 0.83, 0.80, and 0.63m3m-3 respectively at the impacted site and 0.37m3m-3 in the control site. In comparison to total porosity, the soil total porosity for the control site was lower than oil impacted site.

Saturated hydraulic conductivity: Saturated hydraulic conductivity (Ksat) was significantly reduced at the oil spill impacted site, while it improved on the control site (Table 2). The Ksat values at the impacted area were 1.0x10⁻³, 0.8x10⁻³, 1.4x10⁻³ and 3.7x10⁻³cmhr-1 under WH, GGF, GPF, and control site respectively. While in the subsurface depth, Ksat values were 1.4x10⁻³, 0.2x10⁻³, 1.2x10⁻³ and 2.6x10⁻³cmhr-1. In comparison, Ksat under control site was significantly higher than the crude oil impacted soil, while there were no significant difference between Ksat in WH and GPFat both depths in this regard. Saturated hydraulic conductivity under GGF had the least conductivity.

Soil moisture content: The soil moisture functions at 0-15 and 15-30cm depths as influenced by crude oil spill is presented in table 2. Although control location had significantly leaser moisture than oil impacted locations, the greatest moisture retention was found GGF. The difference in moisture contents among the locations became increasingly smaller with increase in bulk density. At bulk densities of 0.38 and 1.413Mgcm-3, effects of moisture were distinctly visible and significant (P<0.01) from other locations. The moisture retained at lower density of location 2 (0.38Mgcm-3) by the soil under impacted surface depth was higher than moisture at the same location in the subsurface depth.

Mean-weight-diameter: The crude oil spill in the soil had high effect on Mean-Weight-Diameter (MWD) on WH and GGF than other locations, and the effect was significant compared with the control site (Table 2). The trend observed in the MWD of the soil under surface depth was higher than same location in the subsurface depth. Although there were significantly differences in MWD of the surface and subsurface, but MWD in the control was not significantly different between the surface and subsurface depths. However, in comparison between the surface and subsurface depths, the MWD on surface increased by 10% relative to the surface depth.

Micro and macro aggregates: In terms of pore space, micro aggregate varied from 11.5% under GGF to 14.8% under WH on the surface soil. However, just below the surface soil, micro aggregate increased to 48.8% at location 2 and WH remained the least small aggregates (12.2%) measured. Macro aggregate on the surface of the pollution site increased from as low as 1.2% at the control site to a range of 1.4% at impacted site GGF to 1.9% around GPF. In the subsurface depth, macro aggregates increased from 2.6% at the non-polluted site to 3.7% and 3.0% at WH and GPF, respectively, but reduced to 1.0% at IB/SS/2. On a general not, GGF is worst affected and it is yet to recover its resilience after cleanup (Table 2).

The extraction of individual hydrocarbon

The extraction yield was investigated at four different impacted locations by Soxhlet procedure. The procedure described here was applied to soil samples taken from three contaminated areas and a control point. For quantitation of BTEX, internal standard (fluorobenzene) were added to the soil samples prior to the procedure. The total BTEX and TPH concentrations obtained from the sites are presented in figures 2 and 3. The results of the analysis as shown in figures 2 and 3 revealed that, contamination of petroleum was severe at GGF than WH and the contents at locations GPF and control were below detection limit of the analytical equipment. The results indicated that BTEX was significantly higher over a hundredfold on the surface than TPH, but TPH in the subsurface was 36.6% more than BTEX (Figure 3).
 
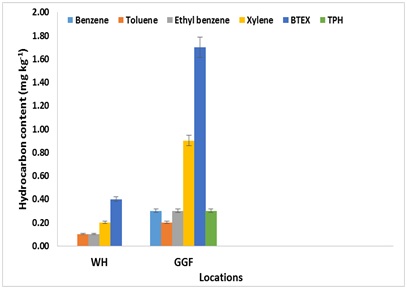
Figure 2: Individual BTEX and TPH concentrations on surface soil of polluted site at Ibeno.
 
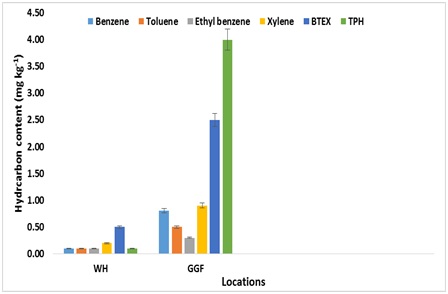
Figure 3: Individual BTEX and TPH concentrations on subsurface soil of polluted site at Ibeno.

Toluene, ethyl benzene, and xylene remain in solvent and quantitatively retaining the BTEX compound at WH and GGF and were below detection limit at GPF and the control sites. The lowest detectable individual concentration of total BTEX were benzene and toluene estimated as 0.3mgkg-1. These soil samples were further examined and found to contain mixed matrix including stable aggregates. The total BTEX was most detected in soils of GGF (depression) followed by WH. These results suggest that the probability of detecting spill petroleum compounds in an undulating topography site is greater at depressed location compared the crest.

Assessments of TPH and BTEX Linearity

Soil samples of various degrees of petroleum contamination obtained from polluted field at Ibeno were prepared and the relative recovery of individual petroleum component of BTEX and TPH was extracted. Adsorbed compounds were affected by the soil texture. Generally, loam and clay loam texture adsorbed more strongly the hydrocarbons than sand, thus it results in the decrease of extraction yield in sandy loam of at WH. However, examination of regression lines of BTEX and TPH to internal standard on concentration using a least-squares fit demonstrated a linear relationship with correlation coefficients being consistently greater than 0.999 (Table 3).

SUMMARY AND CONCLUSION

Soil samples collected from the three impacted sites represented the pollution sites around Mobil Production Company at QIT. The contaminated soils collected from sites consisted of a range of soil textures, moisture contents and bulk densities. The soils included clay loam soils, sandy loam with traces of organic matter and fine sand. The TPH concentrations for the six contaminated soils ranged between 0.1-4.0mgkg-1. The moisture content for the surface soil samples ranged from 42% to 75% (w/w) with average moisture content of 59.3% (w/w) and 48% to 78% with average of 62.7% in the subsurface soil. When the total BTEX and TPH concentrations were examined among the soil samples, total BTEX and TPH were not detected at GGF area of the impacted site due to elevated topographic position that enhanceddownward flow of the petroleum compounds. 

Since all of the BTEX compounds are toxic, the consumption of BTEX infected plant and water, especially, at WH and GGF, respectively may produce immediate health effects. These symptoms, ranging from mild to severe nature, may even lead to serious health conditions including brain damage and leukemia. Considering the high water table in the vicinity of Ibeno, groundwater contaminated with BTEX compounds is inevitable and it is difficult to remediate.

REFERENCES

  1. Saarela K, Tirkkonen T, Laine-Ylijoki J, Jurvelin J, Nieuwenhuijsen MJ, et al. (2003) VTT Technical Research Centre of Finland. Atmosphere Environment 37: 5563.
  2. Agency for Toxic Substances and Disease Registry (2007) Toxicological profile for benzene. Agency for Toxic Substances and Disease Registry, Atlanta, Georgia. Pg no: 1-438.
  3. Zhang Z, Pawliszyn J (1993) Analysis of organic compounds in environmental samples by headspace solid phase microextraction. J High Res Chromatography. 16: 689-692.
  4. http://eurlex.europa.eu/LexUriServ/LexUriServ.do?uri=OJ:L:1998:330:0032:0054:EN:PDF.
  5. http://www.epa.gov/safewater/contaminants/index.html#1.
  6. Mansuy L, Philp RP, Allen JA (1997) Nigerian Meteorological Agency (NIMET). Nigeria Climate Review Bulletin, Nigeria.
  7. Ogban PI, Edem ID (2005) Physical fertility of degraded acid sands in South-eastern Nigeria. Soil Science Society of Nigeria 25: 102-108.
  8. Grossman RB, Reinsch TG (2002) Bulk density and linear extensibility: Core method. Dane JH, Topp GC (Eds.), Methods of soil analysis. Part 4; Physical methods Soil Science Society of America, Inc. Madison. Wisconsin. Pp 208-228.
  9. Reynolds WD, Elrick DE, Young EG, Amoozegar A, Booltink HWG (2002) Saturated and field-saturated water flow parameters. Dane JH, Topp GC (Eds.), Methods of Soil Analysis. Part 4. Physical Methods. Soil Science Society of America, Inc., Madison, Wisconsin. Pp 797-878.
  10. Reynolds WD, Elrick DE (1990) Ponded infiltration from a single ring: I. analysis of steady flow. Science Society of America Journal 64: 478-484.
  11. Levy GJ, Levin J, Shainberg I (1994) Seal formation and interrill soil erosion. Soil Science Society of America 58: 203-209.
  12. Pavón JL, Martín SH, Pinto CG, Cordero BM (2009) Programmed temperature vaporizer based method for the sensitive determination of trihalomethanes and benzene, toluene, ethylbenzene and xylenes in soils. J Chromatogr A 1216: 6063-6070.
  13. Kelley CA, Hammer BT, Coffin RB (1997) Environ. Sci. Technol 31: 2469.
  14. Rosell M, Lacorte S, Barceló D (2006) Simultaneous determination of methyl tert-butyl ether, its degradation products and other gasoline additives in soil samples by closed-system purge-and-trap gas chromatography -mass spectrometry. J Chromatogr A 1132: 28-38.
  15. United States Environmental Protection Agency (USEPA) (2003) Volatile organic compounds in various sample matrices using equilibrium headspace analysis. Washington: US Environmental Protection Agency.
  16. Edwards DA, Andriot MD, Amoruso MA, Tummey AC, Bevan CJ, et al. (1997) Development of fraction specific Reference Doses (RfDs) and Reference Concentrations (RfCs) for Total Petroleum Hydrocarbons (TPH), Vol. 4, Amherst Scientific Publishers, Amherst, USA.
  17. Weisman WD (1998) Analysis of petroleum hydrocarbons in environmental media. Amherst Scientific Publishers, Amherst, Massachusetts, USA.

Citation: Udoinyang U, Edem D, Akabio JHU (2019) Petroleum Hydrocarbon Contents in Tropical Soils near Crude Oil Exploration and Processing Site in Niger Delta, Nigeria. J Environ Sci Curr Res 2: 007.

Copyright: © 2019  Uduak Udoinyang, et al. This is an open-access article distributed under the terms of the Creative Commons Attribution License, which permits unrestricted use, distribution, and reproduction in any medium, provided the original author and source are credited.


Herald Scholarly Open Access is a leading, internationally publishing house in the fields of Sciences. Our mission is to provide an access to knowledge globally.


© 2024, Copyrights Herald Scholarly Open Access. All Rights Reserved!