Aluminium Exposure Through the Diet
*Corresponding Author(s):
Soraya PazArea De Toxicologia, Universidad De La Laguna, La Laguna, Tenerife, Spain
Tel:+34 634541612,
Email:spazmont@gmail.com
Abstract
Aluminium is one of the most common metals found in the environment and consequently, in food. However, Al levels have been increasing over time due to acidification of the soils and anthropogenic activities. Al is a known neurotoxic agent because this metal tends to accumulate in the brain. Several studies have reported the correlation between Al levels and different diseases such Alzheimer’s disease. In addition, aluminium can interfere with some essential metals. In order to study the toxic risk of Al intake, data on Al levels in several types of food have been compiled and compared with the aim of estimating the total dietary intake of the metal. The most widely used analytical techniques for Al determination were Inductively Coupled Plasma mass Atomic Spectroscopy and Atomic Emission Spectroscopy (ICP-OES and ICP-AES). The highest mean Al content was found in vegetables (16.8 mg/kg), fish and seafood (11.9 mg/kg) and roots and tubers (9.60 mg/kg). The food group with the most notable contribution to tolerable weekly intake were fruits (18.2% adults, 29.4% children) and vegetables (32.5% for adults and children). Al dietary intake can pose a health risk resulting from Al accumulation in the brain caused by long-term intake.
Keywords
Aluminium; Aluminium toxicity; Analytical methods; Dietary intake; Exposure; Food
INTRODUCTION
Aluminium (Al) is the third most common element in the Earth’s crust [1] and is naturally present in the environment. Al is a versatile metal with several properties and has a wide range of uses. Al is used in different alloys with other metals such copper, zinc or magnesium [2].
The concentrations of this metal in food and drink have been increasing over time due to the acidification of the soils that transfers the aluminium from the soil to the aquatic environment [3] and anthropogenic activities such as mining (bauxite extraction), aluminium industries, and others [2].
Diet is the main exposure route to metals [4]. Aluminium is found in different drinks and foods such as drinking water, where it is added as a flocculant (aluminium sulphate, Al2(SO4)3), processed foods, where it is used as an additive and as a result of the packaging used and even in fresh foods such as vegetables and fruit because of the Al contained in the soils [5].
In addition, aluminium utensils and tea consumption are also responsible for the increase of the Al in the diet [2]. Tea leaves have been reported to have higher Al levels because tea plants are grown in acidic soils [5].
Al is present in an ionic form as Al3+. The absorption of Al depends on several factors such as the pH level, the presence of organic acids (citrate, lactate), etc [2,6].
The oral bioavailability of Al, which is the amount that can be absorbed, in drinking water is around 0.3%, while this is approximately 0.1% in food and drinks [7]. Al absorption increases as the pH level decreases.
Aluminium is a toxic metal that does not have a function in the human and animal organism [8]. The toxicity of Al depends on the exposure route and the solubility of the aluminium compounds [9]. Aluminium tends to accumulate in the body, in tissues such as the brain, bones, kidney and liver. Long-term exposure to low Al levels leads to toxic effects [10].
Based on information provided by the European Food Safety Authority (EFSA), the exposure of the European population to Al is 28.6-214 µg/kg body weight per day [11].
Because of the abovementioned reasons, different institutions have established maximum limit intake levels for aluminium. The EFSA has established a Tolerable Weekly Intake (TWI) of 1 mg Al per kg of bodyweight [7]. The FAO/WHO Expert Committee on Food Additives, has evaluated the Al bioavailability and concluded by setting a Provisional Tolerable Weekly Intake (PTWI) of 2 mg/kg of bodyweight/week [12], and this value is twice that the established by EFSA.
Since Al is a toxic metal found in foods and beverages, the data previously obtained by our research group and others have been compiled to compare the levels of aluminium content in different types of food and drinks to study the toxic risk from the diet, and to compare the levels found over time to estimate the general variations in Al content.
DATA COLLECTION METHOD
Search terms used were “aluminium”, “aluminium levels”, “aluminium neurological damages”, “inductively coupled plasma”, “ICP-OES”, “aluminium toxicity”, “toxic metals”, “Alzheimer”, “food additives”, “provisional tolerable weekly intake aluminium”, “tolerable weekly intake aluminium”, “aluminium sources”, “aluminium exposure”, “aluminium metabolism”, “spectrophotometry”, “food composition”, “food analysis”, “contaminants”, “ICP-AES”, and “atomic emission spectroscopy”.
The papers reporting Al levels in the most commonly consumed foods using the analytical techniques with the highest levels accuracy and precision for Al determination were selected. The studies where a quality control using reference materials was not included were excluded to ensure the quality of the selected studies. In addition, the included papers were classified into two periods: “before 2000” and “after 2000”.
Sources of aluminium in the environment
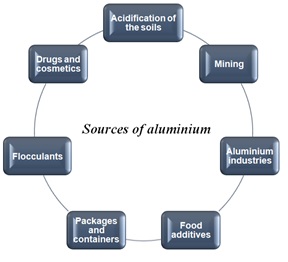 Figure 1: Aluminium environmental sources.
Al is present in the Earth’s crust as a part of silicates (mica or feldspar), hydroxo oxides like bauxite, which are used to extract aluminium and cryolite (Na3AlF6) [13,14].
Environmental transport and distribution of aluminium depends on its coordination chemistry [15]. Acidification of soils is a cause of aluminium release in an ionic form (Al3+) to the aquatic systems. Al3+ is highly soluble in water.
Regarding anthropogenic sources, industrial processes and mining are the main routes of aluminium release into the environment, mainly into the atmosphere. Al content in food packaging and in cooking utensils is an important route of Al release into the environment [15]. Al is also found in drugs, cosmetics and food additives, whose residues can release Al into the environment.
METABOLISM OF ALUMINIUM
Absorption
Absorption of aluminium from foods and drinks depends on numerous factors. Several studies have reported the higher aluminium absorption when citrate and fluoride are present [2,14,16,17]. Meanwhile, the presence of silicon and calcium decrease aluminium absorption [16] due to the formation of insoluble products with aluminium, the above mentioned compounds are frequently found in processed food as additives.
Transport and distribution
Figure 2 shows the transferrin-transferrin pathway. Aluminium bound to the transferring molecule enters the cell, where there are transferrin molecule receptors [1,2]. The Al-transferrin complex, binding to the transferrin receptors, is inside the cytosol, where it experiences a decrease of pH level at 5.5 and Al3+ is released from the complex [19].
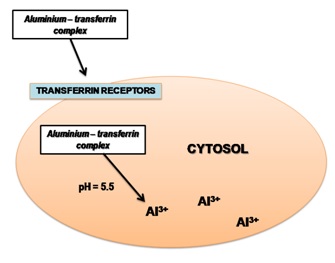 Figure 2: Transferrin-transferrin pathway.
Elimination
Mechanism of aluminium toxicity
Aluminium is considered to be a neurotoxic agent that could increase the probability of developing Alzheimer’s disease [1,21-25]. In addition, Al can lead to cognitive damage and neurological diseases. The probability of having any of these diseases is higher in children and people with kidney problems because the kidney plays a key role in the excretion of Al [25].
Analytical methods in food samples
The most commonly used methods of aluminium measurement are Fame Atomic Absorption Spectrometry (FAAS), Graphite-Furnace Atomic Absorption Spectrometry (GFAAS), Inductively Coupled Plasma-Optical/atomic Emission Spectrometry (ICP-OES/AES) or inductively coupled plasma mass spectrometry (ICP-MS). These methods provide a high selectivity, with low detection limits (0.1 mg/kg or lower) [26,27]. Table 1 shows the comparison between the Limit of Detection (LOD) and the necessary sample volume of the different techniques for aluminium determination.
| Technique | Sample volume required | LOD (ng/mL) | Reference |
| FAAS | 1 mL | 30 | Skoog et al. [28] |
| GFAAS | 0.5-10 µL | 0.2 | Skoog et al. [28] |
| ICP-AES | 20-100 µL | 0.2 | Skoog et al. [28] |
| ICP-OES | 20-100 µL | 4 | Luis et al. [4] |
| ICP-MS | 20-100 µL | 0.003 | Lloyd et al. [29] |
However, techniques based on inductively coupled plasma are used the most because of their high stability and lack of interferences. In addition, this technique offers a simultaneous multi-element determination. Cost and maintenance are the main problems with this technique [4,28,30,31].
Flame Atomic Absorption Spectrometry (FAAS)
Graphite-Furnace Atomic Absorption Spectrometry (GFAAS)
Inductively Coupled Plasma-Optical/atomic Emission Spectrometry (ICP-OES/AES)
Inductively Coupled Plasma-Atomic Emission Spectrometry (ICP-AES) is a technique based on Atomic Emission Spectrometry (AES). Certain instrumental conditions restrict the use of this technique to the analysis of certain elements because: the detectors provide an acceptable sensitivity only in a specific wavelength range, the flame has a strong absorption at wavelengths < 200 nm, and oxygen absorbs with UV radiation. However, AES equipment can provide good results in the wavelength range between 190-850 nm [28,30,31].
Inductively Coupled Plasma Mass Spectrometry (ICP-MS)
Aluminium levels in food and drinks
Water and drinks
| Product | Number of samples | Al mean content (mg/L) ± SD | Origin | Reference |
| Water | ||||
| Water | 20 | 0.12 ± 0.06 | Spain | González-Weller et al. [25]1 |
| Mineral water, spring water and table water | 171 | 2 | Germany | Stahl et al. [35]2 |
| Drinking water | 3 | 0.016 ± 0.0004 | Jordan | Sweileh et al. [36]3 |
| Tap water | 3 | 0.026 ± 0.0006 | Jordan | Sweileh et al. [36]3 |
| Non-alcoholic drinks | ||||
| Soft drinks | 20 | 1.24 ± 0.70 | Spain | González-Weller et al. [25]1 |
| Soft drinks (Non-cola, cans) | 106 | 0.90 | Australia | Duggan et al. [37] |
| Soft drinks (Cola, cans) | 0.66 | Australia | Duggan et al. [37] | |
| Soft drinks (Non-cola, glass bottle) | 0.15 | Australia | Duggan et al. [37] | |
| Soft drinks (Cola, glass bottle) | 0.24 | Australia | Duggan et al. [37] | |
| Fruit juice and fruit juice drinks | 59 | 3 | Germany | Stahl et al. [35]2 |
| Fruit juices | - | 0.043-4.130* | USA | Schenk et al. [38] |
| Alcoholic drinks | ||||
| Wine and fruit drinks | 65 | 2 | Germany | Stahl et al. [35]2 |
| Wine | 20 | 2.42 ± 2.03 | Spain | González-Weller et al. [25]1 |
| Beer and draught beer | 237 | 0.50 | Germany | Stahl et al. [35]2 |
| Alcoholic beverages (gin, whiskey, rum, beer) | 20 | 0.50 ± 0.32 | Spain, England, Scotland, The Netherlands | González-Weller et al. [25]1 |
| Tea, herbal infusions and coffee | ||||
| Sweetened tea infusions | 3 | 2.2 ± 0.1 | Jordan | Sweileh et al. [36]3 |
| Tea infusions | 3 | 2.1 ± 0.1 | Jordan | Sweileh et al. [36]3 |
| Arabian coffee | 3 | 0.63 ± 0.03 | Jordan | Sweileh et al. [36]3 |
| Herbal teas | - | 0.14-1.065* | USA | Schenk et al. [38] |
| Instant coffee | - | 0.02-0.581* | USA | Schenk et al. [38] |
| Whole coffee | - | 0.235-1.163* | USA | Schenk et al. [38] |
Al levels found in several types of non-alcoholic drinks were higher than those found in water. The highest levels were found in fruit juice and fruit juice drinks from Germany, with a mean content of 3 mg/L [35]. In general terms, the beverages which were stored in aluminium cans contained higher Al levels, but the consulted studies did not confirm the statistical differences between aluminium cans, glass bottles and plastic containers [35].
Regarding alcoholic drinks, wine is the beverage showing the highest Al levels at 2.42 mg/L in Spanish wines [25], and 2 mg/L in German wines [35]. The high acidity of the soils where the grapes were grown may explain these high Al contents.
With respect to tea, tea (Camellia sinensis) leaves are known to make a notable contribution to the dietary intake of Al, due to the acidity of the soil where the plant is grown, because these plants are acidophilic [39]. A study conducted by Sweileh et al., [36] reported an average Al concentration of 312 ± 18 µg/g in tea infusions, however, the brewed tea infusions were found to have lower concentrations (2.1 ± 0.1 mg/L). Other studies reported Al concentrations in brewed tea ranging between 3-4 mg/L, these concentrations are 10 times higher than those found in coffee [40].
Tea infusions can contribute 50% of the total daily intake of Al in cases of high consumption.
Fruit and vegetables
| Product | Number of samples | Al mean content (mg/kg) ± SD | Origin | Reference |
| Vegetables | ||||
| Green beans, cooked | - | 3.4 | USA | Soni et al. [15] |
| Potato, baked | - | 26 | USA | Soni et al. [15] |
| Potato, cooked | - | 10.8 | India | Soni et al. [15] |
| Potatoes | 20 | 5.88 ± 3.29 | Spain | González-Weller et al. [25]1 |
| Potatoes | - | 0.90 | USA | MAFF [41] |
| Squash, carrots, marrow, cabbage, watercress, spinach | 20 | 27.47 ± 38.47 | Spain | González-Weller et al. [25]1 |
| Tomatoes and onions | 20 | 5.41 ± 2.16 | Spain | González-Weller et al. [25]1 |
| Asparagus | - | 4.4 | USA | Greger et al. [42] |
| Green vegetables | - | 3.1 | USA | MAFF [41] |
| Fruits | ||||
| Apple sauce | - | 0.10 | USA | Soni et al. [15] |
| Apple, fresh | - | 0.14 | USA | Pennington [43] |
| Apples and citrus | 20 | 4.73 ± 3.33 | Spain | González-Weller et al. [25]1 |
| Banana, fresh | - | 0.05 | USA | Pennington [43] |
| Banana | 20 | 32.80 ± 33.05 | Spain | González-Weller et al. [25]1 |
| Peaches, pears, plums | 20 | 9.68 ± 6.88 | Spain | González-Weller et al. [25]1 |
1Study conducted using ICP-OES
2Study conducted using ICP-MS
During the growth of the plant, Al is transferred from the soil to the different parts of the plant. Depending on the species, some of which tend to accumulate higher Al concentrations in the roots, while others such as the tea plant accumulate higher Al levels in the leaves [44-46].
In regard to vegetables, the highest Al levels were reported by González-Weller et al., [25] in the vegetable group of squashes, carrots, marrow, cabbage, watercress and spinach from Spain, with an average Al concentration of 27.5 mg/kg. Baked potatoes from USA had a high Al level, with an average level of 26 mg/kg [15]. The lowest Al concentrations were reported by Soni et al., [15] in cooked green beans (3.40 mg/kg).
The highest Al level found in fruit was that reported by González-Weller et al. [25] in bananas from Spain, with a mean content of 32.8 mg/kg. This concentration is much higher than that found by Soni et al., [15] in bananas from USA, with a mean concentration of 0.40 mg/kg.
Animal products
| Product | Number of samples | Al mean content (mg/kg) ± SD | Origin | Reference |
| Fresh meat | ||||
| Poultry, rabbit | 20 | 6.35 ± 2.83 | Spain | González-Weller et al. [25]1 |
| Viscera | 20 | 11.19 ± 6.42 | Spain | González-Weller et al. [25]1 |
| Red meat | 40 | 9.31 ± 4.85 | Spain | González-Weller et al. [25]1 |
| Porcine meat (muscle) | - | 0.21 | France | Leblanc et al. [48]2 |
| Porcine meat (kidney) | - | 0.52 | France | Leblanc et al. [48]2 |
| Processed meat products | ||||
| Ham | 20 | 1.99 ± 0.44 | Spain, Italy | González-Weller et al. [25]1 |
| Ham, cooked | - | 1.2 | USA | Greger et al. [42] |
| Sausage, bologna, salami | 20 | 3.06 ± 1.09 | Spain, Italy | González-Weller et al. [25]1 |
| Hamburger | - | 2.00 | USA | Soni et al. [15] |
| Milk and its derivates | ||||
| Cheddar cheese | - | 3.9 ± 3.9 | USA | Saiyed and Yokel [40]3 |
| Processed American cheese slices | - | 470 ± 200 | USA | Saiyed and Yokel [40]3 |
| American pasteurized prepared cheese | - | 6.6 ± 4.4 | USA | Saiyed and Yokel [40]3 |
| Natural cheese | - | 1.57 | USA | Soni et al. [15] |
| Processed cheese | - | 29.7 | USA | Soni et al. [15] |
| Soft cheese | - | 0.4 | Greece, Turkey | Elbarbary and Hamouda [49]3 |
| Milk, whole | 20 | 0.37 ± 0.09 | Spain | González-Weller et al. [25]1 |
| Milk, skimmed and semi skimmed | 20 | 0.82 ± 1.59 | Spain | González-Weller et al. [25]1 |
| Milk | - | 0.70 | USA | Soni et al. [15] |
| Yogurt | 40 | 0.82 ± 0.50 | Spain | González-Weller et al. [25]1 |
| Plain yogurt | 36 | 0.72 ± 0.57 | Spain | Luis et al. [4]1 |
| Flavored yogurt | 36 | 0.45 ± 0.27 | Spain | Luis et al. [4]1 |
| Eggs | ||||
| Hens’ eggs (homogenized) | 40 | 2.93 ± 2.95 | Spain | González-Weller et al. [25]1 |
| Hens’ eggs | - | 0.107 | USA | Schenk et al. [38] |
1Study conducted using ICP-OES
2Study conducted using ICP-MS
3Study conducted using FAAS/GFAAS
Regarding the Al levels in fresh meat, the highest level was found in viscera from Spain, with an average concentration of 11.2 mg/kg [25], whereas the lowest level was reported in porcine meat (muscle) from France, with a mean Al level of 0.21 mg/kg [48].
The hamburger from the USA was the processed meat product with the highest Al level with a mean concentration of 20 mg/kg. This could be explained by the use of Al-additives.
Finally, the highest concentration of Al found in milk and its derivates was that found in processed American cheese slices from the USA, with an average content of 470 mg/kg, this is due to the use of sodium aluminium phosphate as the emulsifying agent in processed cheeses [15,40].
Fish and other seafood
| Product | Number of samples | Al mean content (mg/kg) ± SD | Origin | Reference |
| Fresh fish | ||||
| Mullus surmuletus (Red rock mullet) | 16 | 3.48 ± 3.96 | Spain | Dorta et al. [50]1 |
| Pseudupeneus prayensis (African mullet) | 12 | 0.92 ± 0.71 | Spain | Dorta et al. [50]1 |
| Sarpa salpa | 40 | 2.86 ± 2.23 | Spain | Afonso et al. [51]1 |
| Chelon labrosus | 40 | 2.84 ± 2.69 | Spain | Afonso et al. [51]1 |
| White fish | 20 | 3.57 ± 3.23 | Spain, Morocco, South Africa, Mauritania | González-Weller et al. [25]1 |
| Oily fish | 20 | 3.90 ± 1.97 | Spain, Morocco, South Africa, Mauritania | González-Weller et al. [25]1 |
| Fish | - | 0.40 | USA | Soni et al. [15] |
| Trachurus genera (blue jack mackerel) | 60 | 1.343-49.24* | Turkey | Özden [52]2 |
| Trachurus genera | 24 | 10 | Turkey | Küpeli et al. [53]1 |
| Trachurus genera | 142 | 2.408-5.857* | Spain | Rivas et al. [54]3 |
| Saurida undosquamis | 45 | 0.831 | Turkey | Türkmen et al. [55]3 |
| Sparus aurata | 45 | 0.919 | Turkey | Türkmen et al. [55]3 |
| Mullus barbatus | 45 | 2.228 | Turkey | Türkmen et al. [55]3 |
| Seafood | ||||
| Sepia officinalis (cuttlefish) | - | 10.2 | Spain | Villanueva and Bustamante [56]2 |
| A crassispina (sea urchin) | 26 | 26.9 ± 30.1 | South Korea | Choi et al. [57]1 |
| S. japonicus (sea cucumber) | 63 | 30.3 ± 25.1 | South Korea | Choi et al. [57]1 |
| H. roretzi (sea squirts) | 67 | 38.8 ± 22.6 | South Korea | Choi et al. [57]1 |
| S. plicata (warty sea squirts) | 66 | 204.6 ± 166.4 | South Korea | Choi et al. [57]1 |
| Seaweed | ||||
| Red seaweed | 18 | 27.1 ± 22.6 | Asian and European Union | Rubio et al. [29]1 |
| Brown seaweed | 22 | 7.43 ± 5.26 | Asian and European Union | Rubio et al. [29]1 |
| Laminaria (brown seaweed) and Porphira (red seaweed) | - | 8.78 ± 18.6 | Spain | Larrea-Marín et al. [58]1 |
| Laver | 53 | 15.5 ± 9.36 | South Korea | Khan et al. [59]2 |
| Sea tangle | 45 | 4.89 ± 4.15 | South Korea | Khan et al. [56]2 |
| Sea mustard | 58 | 4.14 ± 3.36 | South Korea | Khan et al. [56]2 |
| Hijiki | 27 | 6.56 ± 4.47 | South Korea | Khan et al. [56]2 |
| Gulf weed | 15 | 52.1 ± 7.34 | South Korea | Khan et al. [56]2 |
-Unknown number of samples
1Study conducted using ICP-OES
2Study conducted using ICP-MS
3Study conducted using FAAS/GFAAS
Seafood is the group with the highest reported Al levels, with an average Al concentration of 204.6 mg/kg in warty sea squirts from South Korea [57]. This fact could be explained by the characteristics of the organisms, e.g., cephalopods which filter the water and thereby accumulate higher metal contents [64,65].
Al content in edible seaweeds is higher than in fish, reaching an Al level of 52.1 mg/kg in gulfweed (microalgae) from South Korea [59]. Seaweeds can accumulate metals present in the aquatic environment and in several cases, seaweeds can act as bio indicator of marine contamination as a method of monitoring the pollution [66].
Estimation of the spatiotemporal aluminium levels along the time
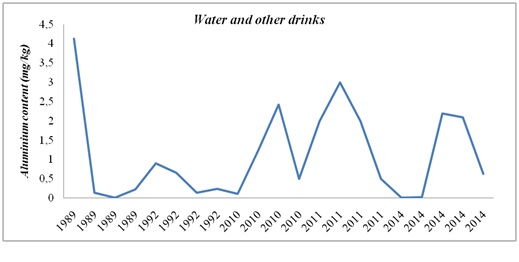 Figure 3: Aluminium evolution in water and other drinks in the period 1989 – 2014.
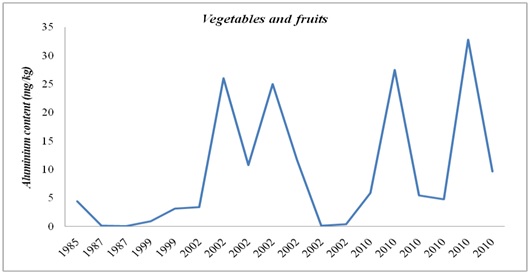 Figure 4: Aluminium evolution in fruit and vegetables in the period 1985 – 2010.
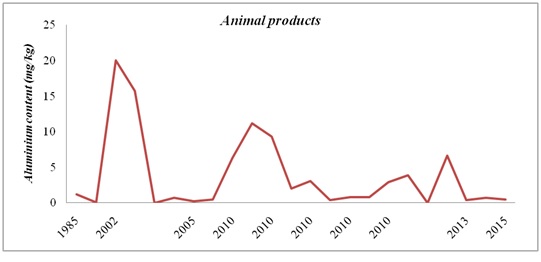 Figure 5: Aluminium evolution in animal products in the period 1985 – 2015.
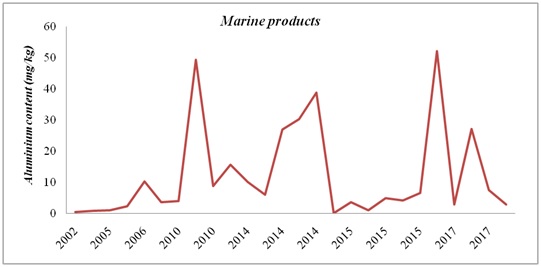 Figure 6: Aluminium evolution in marine products in the period 2002 – 2017.
Al levels in drinking water and other beverages have increased over time and this fact can be explained by the use of Al-based compounds in the treatment of drinking water [21].
In the case of fruit and vegetables, the Al concentration was highest in 2010, and it should be mentioned that the highest concentrations were found in selected fruit and vegetables from the Canary Islands (Spain), where the crop soils are acidic as a result of the volcanic nature of the islands [25].
On the other hand, Al levels in different animal products have decreased over time.
Al concentrations in different marine products peaked in some cases in 2010, 2014 and 2015. However, Al levels between 2015 and 2017 were slightly lower than in the first period (2002-2014). Nevertheless, there are wide differences in marine products between the areas where the products where collected.
The differences of Al levels over time may be due to the development of analytical techniques, which are currently able to detect lower levels. However, the wide use of Al-packaging to preserve food and acidification of soils can lead to higher Al levels in food.
Estimation of the dietary intake
Table 6 shows the Estimated Daily Intake (EDI), which is the approximated intake of Al per day, and the percentages of contribution to the TWI of aluminium from the diet. The results of EDIs in mg/day are obtained multiplying the average consumption data by the Al concentration found in each food group. Otherwise, the percentages of contribution to the TWI are obtained by dividing the EDIs values by the TWI and by the average body weight, which is given by the AESAN [67], and multiplying the result by 7 to express the result per week as the TWI, and by 100 to express the result as a percentage.
| Food group | Al mean content (mg/kg)a | Children(7-12 years old, 34.48 kgb) | Adults(≥17 years old, 68.48 kgb) | ||
| EDI (mg/day) | % TWI | EDI (mg/day) | % TWI | ||
| Beverages | 1.11 | 0.05 | 1.02 | 0.14 | 1.43 |
| Eggs | 1.52 | 0.04 | 0.81 | 0.05 | 0.51 |
| Fish and seafood | 11.9 | 0.75 | 15.2 | 1.12 | 11.4 |
| Fruits | 6.84 | 1.45 | 29.4 | 1.78 | 18.2 |
| Meat and its derivates | 5.98 | 0.92 | 18.7 | 0.99 | 10.1 |
| Milk and its derivates | 3.05 | 1.31 | 26.6 | 1.07 | 10.9 |
| Roots and tubers | 9.60 | 0.65 | 13.2 | 0.69 | 7.05 |
| Vegetables | 16.8 | 1.60 | 32.5 | 3.18 | 32.5 |
bAverage weight established by the AESAN [64]
EDI: Estimated Daily Intake
TWI: Tolerable Weekly Intake
The food groups with the most notable contribution to the TWI of Al are fruits (18.2% adults, 29.4% children) and vegetables (32.5% for adults and children).
Depending on the average consumption of each food group, the total dietary intake of Al can be above the TWI established by the EFSA.
CONCLUSION
Aluminium is a toxic metal known as a neurotoxic agent. The accumulation of Al in the brain can lead to diseases such as the impairment of memory and neurodegenerative diseases like Alzheimer’s disease, Parkinson’s disease, etc.
Aluminium is widely present in the diet. Al levels in vegetable, fruit or seafood groups are higher than in other groups. The gastrointestinal absorption of Al is low, but there are many dietary sources and therefore, in some cases, the Al level may pose a health risk. It is therefore necessary to control the level of aluminium in certain types of foods, because of the toxic effects of aluminium in the human organism.
REFERENCES
- Martinez CS, Alterman CD, Peçanha FM, Vassallo DV, Mello-Carpes PB, et al. (2017) Aluminum Exposure at Human Dietary Levels for 60 Days Reaches a Threshold Sufficient to Promote Memory Impairment in Rats. Neurotox Res 31: 20-30.
- Sjögren B, Iregren A, Elinder CG, Yokel RA (2007) Chapter 17: Aluminum. In: Nordberg GF, Fowler BA, Nordberg M, Friberg L (eds.). Handbook on the Toxicology of Metals, (3rd edn). Academic Press, Amsterdam, Netherlands.
- Krewski D, Yokel RA, Nieboer E, Borchelt D, Cohen J, et al. (2007) Human health risk assessment for aluminium, aluminium oxide, and aluminium hydroxide. J Toxicol Environ Health B Crit Rev 1: 1-269.
- Luis G, Rubio C, Revert C, Espinosa A, González-Weller D, et al. (2015) Dietary intake of metals from yogurts analyzed by inductively coupled plasma optical emission spectrometry (ICP-OES). J Food Com Anal 39: 48-54.
- Shaw CA, Tomljenovic L (2013) Aluminum in the central nervous system (CNS): toxicity in humans and animals, vaccine adjuvants, and autoimmunity. Immunol Res 56: 304-316.
- Kumar V, Gill KD (2014) Oxidative stress and mitochondrial dysfunction in aluminium neurotoxicity and its amelioration: a review. Neurotoxicology 41: 154-166.
- EFSA (European Food Safety Authority) (2011) Statement on the Evaluation on a New Study Related to the bioavailability of aluminum in food. EFSA J 9: 2157.
- Rubio Armendáriz C, García T, Soler A, Gutiérrez Fernández AJ, Glez-Weller D, et al. (2015) Heavy metals in cigarettes for sale in Spain. Environ Res 143: 162-169.
- Davidson T, Ke Q, Costa M (2007) Chapter 5: Selected Molecular Mechanism of Metal Toxicity and Carcinogenicity. In: Nordberg GF, Fowler BA, Nordberg M, Friberg L (eds.). Handbook on the Toxicology of Metals, (3rd edn), Academic Press, Amsterdam, Netherlands.
- Bondy SC (2014) Prolonged exposure to low levels of aluminum leads to changes associated with brain aging and neurodegeneration. Toxicology 315: 1-7.
- EFSA (2008) Opinion of the Scientific Panel on Food Additives, Flavourings, Processing Aids and Food Contact Material (AFC). EFSA, Parma, Italy.
- FAO/WHO (2011) Evaluation of certain food additives and contaminants: seventy-fourth report of the Joint FAO/WHO Expert Committee on Food Additives. WHO Technical Report Series, WHO, Geneva, Switzerland., Pg no: 966.
- Cotton FA, Wilkinson G, Murillo CA, Bochmann M (1999) Advanced Inorganic Chemistry, (6th edn). Wiley-Interscience, New York, USA.
- Nayak P (2002) Aluminum: Impacts and Disease. Environ Res Sec A 89: 101-115.
- Soni MG, White SM, Flamm WG, Burdock GA (2002) Safety Evaluation of Dietary Aluminum. Reg Toxicol Pharmacol 33: 66-79.
- Fernández-Maestre R (2014) Aluminum: Intake, absorption, excretion and toxicity. Rev Costarr Pública 23: 113-118.
- Nolan CR, Califano JR, Butzin CA (1990) Influence of calcium acetate or calcium citrate on intestinal aluminum absorption. Kidney Int 38: 937-941.
- Harrison PM, Arosio P (1996) The ferritins: molecular properties, iron storage function and cellular regulation. Biochim Biophys Acta 1275: 161-203.
- Crichton RR, Florence A, Ward RJ (2002) Aluminium and iron in the brain – prospects for chelation. Coord Chem Rev 228: 365-371.
- Malluche HH (2002) Aluminum and bone disease in chronic renal failure. Nephrol Dial Transplant 17: 21-24.
- Flaten TP (2001) Aluminium as a risk factor in Alzheimer's disease, with emphasis on drinking water. Brain Res Bull 55: 187-196.
- Exley C (2013) Human exposure to aluminium. Environ Sci Processes Impacts 15: 1807-1816.
- Exley C, Vickers T (2014) Elevated brain aluminium and early onset Alzheimer’s disease in an individual occupationally exposed to aluminium: a case report. J Med Case Rep 8: 41.
- Nordberg GF, Fowler BA, Nordberg M, Friberg L (2007) Handbook on the Toxicology of Metals, (3rd edn). Academic Press, Amsterdam, Netherlands.
- González-Weller D, Gutiérrez AJ, Rubio C, Revert C, Hardisson A (2010) Dietary Intake of Aluminum in a Spanish Population (Canary Islands). J Agric Food Chem 58: 10452-10457.
- WHO (World Health Organization) (2007) Safety evaluation of certain food additives and contaminants. WHO Food Additives Series: 58. WHO, Geneva, Switzerland. Pg no:119-207.
- Khanhuathon Y, Siriangkhawut W, Chantiratikul P, Grudpan K (2015) Spectrophotometric method for determination of aluminium content in water and beverage samples employing flow-batch sequential injection system. Journal of Food Comp Anal 41: 45-53.
- Skoog DA, West DM, Holler J, Crouch SR (2008) Fundamentos de Química Analítica, (8a Edición). Cengage Learning.
- Lloyd GR, Ahmad S, Wasim M, Brereton RG (2009) Pattern recognition of Inductively Coupled Plasma Atomic Emission Spectroscopy of human scalp hair for discriminating between healthy and Hepatitis C patients. Anal Chim Acta 649: 33-42.
- Lewen N, Nugent D (2010) The use of inductively coupled plasma-atomic emission spectroscopy (ICP-AES) in the determination of lithium in cleaning validation swabs. J Pharma Biomed Anal 52: 652-655.
- Rubio C, Napoleone G, Luis-González G, Gutiérrez AJ, González-Weller D, et al. (2017) Metals in edible seaweed. Chemosphere 173: 572-579.
- Makonnen Y, Beauchemin D (2015) Investigation of a measure of robustness in inductively coupled plasma mass spectrometry. Spectrochim Acta B 103-104: 57-62.
- Todolí JL, Mermet JM (2006) Sample introduction systems for the analysis of liquid microsamples by ICP-AES and ICP-MS. Spectrochim Acta B 61: 239-283.
- Gourier-Fréry C, Fréry N (2004) Aluminium. EMC-Toxicologie Pathologie 1: 79-95.
- Stahl T, Taschan H, Brunn H (2011) Aluminium content of selected foods and food products. Environmental Sciences Europe 23: 37.
- Sweileh JA, Misef KY, El-Sheikh AH, Sunjuk MS (2014) Development of a new method for determination of aluminum (Al) in Jordanian foods and drinks: Solid phase extraction and adsorption of Al3+-D-mannitol on carbon nanotubes. J Food CompAnal 33: 6-13.
- Duggan JM, Dickeson JE, Tynan PF, Houghton A, Flynn JE (1992) Aluminum beverage cans as a dietary source of aluminum. Med J Aust 156: 604-605.
- Schenk RU, Bjorksten J, Yeager L (1989) Composition and consequences of Al in water, beverages and other ingestibles. In: Lewis TE (eds.). Environmental Chemistry and Toxicology of Al. Lewis Publishers Inc, USA.
- Yang Y, Liu Y, Huang CF, de Silva J, Zhao FJ (2016) Aluminium alleviates fluoride toxicity in tea (Camellia sinensis). Plant Soil 402: 179-190.
- Saiyed SM, Yokel RA (2005) Aluminium content of some foods and food products in the USA, with aluminium food additives. Food Addit Contam 22: 234-244.
- MAFF (1999) Total diet study: Aluminium, arsenic, cadmium, chromium, copper, lead, mercury, nickel, selenium, tin and zinc. Food Surveillance Information Sheet. Number 191.
- Greger JL, Goedz W, Sullivan D (1985) Aluminium levels in foods cooked and stored in aluminium pans, trays and foil. J Food Protect. 48: 772-777.
- Pennington JA (1987) Aluminium content of foods and diets. Food Addit Contam 5: 161-232.
- Aubin Ondo J, Menye Biyogo R, Eba F, Prudent P, Fotio D, et al. (2013) Accumulation of soil-borne aluminium, iron, manganese and zinc in plants cultivated in the region of Moanda (Gabon) and nutritional characteristics of the edible parts harvested. J Sci Food Agric 93: 2549-2555.
- Schmitt M, Boras S, Tjoa A, Watanabe T, Jansen S (2016) Aluminium Accumulation and Intra-Tree Distribution Patterns in Three Arbor aluminosa (Symplocos) Species from Central Sulawesi. PLoS ONE 11.
- Singh S, Tripathi DK, Singh S, Sharma S, Dubey NK, et al. (2017) Toxicity of aluminium on various levels of plant cells and organism: A review. Environmental and Experimental Botany 137: 177-193.
- Dlugaszek M, Kopczy?ski K (2014) Correlations Between Elements in the Fur of Wild Animals. Bull Environ Contam Toxicol 93: 25-30.
- Leblanc JCH, Guérin T, Noël L, Calamassi-Tran G, Volatier JL, et al. (2005) Dietary exposure estimates of 18 elements from the 1st French Total Diet Study. Food Addit Contam 22: 624-641.
- Elbarbary HA, Hamouda AF (2013) Variations in some heavy metals’ level during processing of soft cheese. J Food Meas Charact 7: 194-198.
- Dorta P, Rubio C, Lozano G, González-Weller D, Gutiérrez A, et al. (2015) Metals in Mullus surmuletus and Pseudupeneus prayensis from the Canary Islands (Atlantic Ocean). J Food Prot 78: 2257-2263.
- Afonso A, Gutiérrez AJ, Lozano G, González-Weller D, Rubio C, et al. (2017) Determination of toxic metals, trace and essential, and macronutrients in Sarpa salpa and Chelon labrosus: risk assessment for the consumers. Environ Sci Pollut Res 24: 10557-10569.
- Özden, O (2010) Micro, macro mineral and proximate composition of Atlantic bonito and horse mackerel: a montly differentiation. Int J Food Sci Technol 45: 578-586.
- Küpeli T, Altundag H, Imamo?lu M (2014) Assessment of trace element levels in muscle tissues of fish species collected from river, stream, lake, and sea in Sakarya, Turkey. ScientificWorldJournal.
- Rivas A, Peña-Rivas L, Ortega E, López-Martínes C, Olea-Serrano F, et al. (2014) Mineral Element Contents in Commercially Valuable Fish Species in Spain. The Scientific World Journal. Pg no: 1-7.
- Türkmen A, Türkmen M, Tepe Y, Akyurt I (2005) Heavy metals in three commercially valuable fish species from Iskenderun Bay, Northern East Mediterranean Sea, Turkey. Food Chem 91: 167-172.
- Villanueva R, Bustamante P (2006) Composition in essential and non-essential elements of early of cephalopods and dietary effects on the elemental profiles of Octopus vulgaris paralarvae. Aquaculture 261: 225-240.
- Choi JY, Habte G, Khan N, Nho EY, Hong JH, et al. (2014) Determination of toxic heavy metals in Echinodermata and Chordata species from South Korea. Food Addit Contam Part B Surveill 7: 295-301.
- Larrea-Marín MT, Pomares-Alfonso MS, Gómez-Juaristi M, Sánchez-Muniz FJ (2010) Validation of an ICP-OES method for macro and trace elements determination in Laminaria and Porphira seaweeds from four different countries. Journal of Food Composition and Analysis 23: 814-820.
- Larrea-Marín MT, Pomares-Alfonso MS, Gómez-Juaristi M, Sánchez-Muniz FJ (2010) Validation of an ICP-OES method for macro and trace elements determination in Laminaria and Porphira seaweeds from four different countries. Journal of Food Composition and Analysis 23: 814-820.
- Khan N, Ryu KY, Choi JY, Nho EY, Habte G,et al. (2015) Determination of toxic and heavy metals and speciation of arsenic in seaweeds from South Korea. Food Chem 169: 464-470.
- Bosch AC, O’Neill B, Sigge GO, Kerwath SE, Hoffman LC (2015) Heavy metals in marine fish meat and consumer health: a review. J Sci Food Agric 96: 32-48.
- Salvo A, Cicero N, Vadalà R, Mottese AF, Bua D, et al. (2015) Toxic and essential metals determination in comercial seafood: Paracentrotus lividus by ICP-MS. Nat Prod Res 30: 657-664.
- Birchall JD, Exley C, Chappell JS, Phillips MJ (1989) Acute toxicity of aluminium to fish eliminated in silicon-rich acid water. Nature 338: 146-148.
- Poléo ABS (1995) Aluminium polymerization – a mechanism of acute toxicity of aqueous aluminium to fish. Aquatic Toxicol 31: 347-356.
- Bustamante P, Teyssié JL, Fowler S, Cotret O, Danis B, et al. (2002) Biokinetics of cadmium and zinc accumulation and depuration at different stages in the life cycle of the cuttlefish Sepia officinalis. Mar Ecol Prog Ser 231: 167-177.
- Pereira P, Raimundo J, Vale C, Kadar E (2009) Metal concentrations in digestive gland and mantle of Sepia officinalis from two coastal lagoons of Portugal. Science of The Total Environment 407: 1080-1088.
- Taylor VF, Jackson BP (2016) Concentration and speciation of arsenic in New England seaweed species harvested for food and agriculture. Chemosphere 163: 6-13.
- AESAN (2006) Modelo de dieta española para la determinación de la exposición del consumidor a sustancias químicas. Ministerio de Sanidad y Consumo, Madrid.
Citation: Hardisson A, Revert C, Weller DG, Gutiérrez A, Paz S, et al. (2017) Aluminium Exposure Through the Diet. J Food Sci Nut 3: 020.
Copyright: © 2017 Arturo Hardisson, et al. This is an open-access article distributed under the terms of the Creative Commons Attribution License, which permits unrestricted use, distribution, and reproduction in any medium, provided the original author and source are credited.