Hair Analysis by Polarized Light Microscopy, a New Tool in Medical Research
*Corresponding Author(s):
Gregorio Martínez-SánchezFree Lance, Ancona, Italy
Tel:+39 3333358310,
Email:gregorcuba@yahoo.it
Abstract
A new innovative and precise method of hair analysis by quantitative polarized light microscopy of optically active substances is proposed. The method exploits the combination of remote sensing and unmixing, using an own Interactive Data Language (IDL) software, thus providing a reading of the intracellular content in the hair, in particular bulb, including minerals and organic thermo-labile compounds such as vitamins, amino acids and hormones, otherwise not possible with the present Tissue Mineral Analysis (TMA). The results of the analysis of 69 compounds have shown a Coefficient of Variation (CV) lower than 10%. Moreover, 27/31 (87%) and 17/31 (55%) of the pure elements have a CV lower than 5% and 2%, respectively. Among vitamins, 9/12 (75%) have a CV lower than 2%, while it is lower than 5% in all of them. All the other organic compounds (amino-acids and hormones) have a CV lower than 2%. The method is highly precise, simple and fast and do not require complex, sophisticated instruments and procedures, like in the most precise methodologies used today. Therefore, the method can be a potent tool for medical doctors, health care practitioners and clinical researchers, and be used in a wide spectrum of applications.
Keywords
INTRODUCTION
Hair has been widely used from many years to assess human systemic levels of elements [1]. However, in many instances, especially for mineral analysis, the degree of success of analytical interpretation has been quite minimal with respect to the extent of such endeavours. Hair analysis has allowed the identification of the interrelationships between minerals, vitamins and the neuro-endocrine system [2], the classification of vitamins, minerals, herbs, foods, water and drugs into specific categories according to their metabolic effects [3,4], and the relationship between oligo-elements, in particular minerals, and physiological states, such as metabolic disorders, physical illnesses, mental and emotional conditions, glandular assessment, disease trends, energy assessment, cancer, etc. [5-7].
Compared to other types of clinical specimens, hair has different uses and even advantages over blood or urine. While urine and blood tend to show current or recent body status, hair represents a longer time frame. Elements also occur in hair at higher levels (about ten times) [8], allowing for more sensitive results. Hair sampling is simple and non-invasive, and hair is a stable material over the time. It requires no special handling and will remain viable for years. This makes hair an excellent choice as a screening tool [9].
Hair is a complex part of the anatomy and, consequently, the rate of incorporation of substances in hair is affected by different biological variables [8,10,11]. Hair provides the toxicologist/pharmacologist with many advantages over conventional matrices in that it is easy to collect, is a robust and stable matrix that does not require refrigeration, and most importantly, provides a historical profile of an individual's exposure to drugs or analytes of interest. No widely accepted standards specify how hair samples should be collected and analyzed [11]. However, hair from the crown of the head is considered to be the best analytical sample [8,12]. It is recommended to collect the hair samples in small portions from several sites on the neck which includes the nape of the neck (the back-bottom portion of the neck), the top back portion of the neck, and the side of the skull [13]. A sample size from 50 to 100 hairs is recommended for analysis [12].
For biological monitoring, readily accessible specimens reflecting average exposure to contaminants over a relatively long period of time are of particular importance. Hair analysis is thus used for detection of drugs in forensic medicine, detection of poisons in clinical and forensic toxicology, historical investigations, analysis of essential trace elements and mineral stores and evaluation of the internal exposure to pollutants in environmental medicine [14-18].
In those sectors, the hair analysis is substantially carried out to investigate in details the presence of one or few substances by highly specialized personnel and sophisticated instruments, such as liquid o gas chromatography [19-21], inductively coupled plasma [22], matrix-assisted laser desorption [20] and capillary zone electrophoresis [23], each of them coupled to mass spectrometry. It is evident that these analyses are carried out for particular needs and cannot be considered as routine investigations or screening on a commercial large scale.
Commercial hair mineral analysis is routinely carried out by a Tissue Mineral Analysis (TMA), or mineralogram. The sampled hair is withdrawn by cutting the first 2-3 centimeters of growth closest to the scalp at the occiput (the nape of the neck) or latero-parietal area (the temples and the back of the head). The sample is washed with various solvents, loosened with perchloric acid and then mineralized to completely destroy the organic matrix while conserving the mineral content of the hair by an oxidizing acid solution. The aqueous acid solution obtained from mineralization is analyzed using a spectrophotometer in plasma emission at a temperature ranging from 8.000 to 10.000°C.
Independent investigations have proven that TMA is not a reliable test by evaluating intra an inter-laboratory result [24-28]. The main conclusions agreed that hair mineral analysis from tested laboratories was unreliable, classification to the individual reference ranges did not correspond to tolerable borders and laboratory methodologies and procedures should be standardized to help ensure more accurate and reliable results, including consistent sampling protocols, washing protocols, quality assurance/quality control procedures, etc.
Therefore, TMA is generally not usable for individual diagnostic with few exceptions because of the large number of factors of individual and environmental influences and sources of error of the method of analysis. The reported articles even recommend that health care practitioners refrain from using TMA to assess individual nutritional status or suspected environmental exposures. Finally, the commercial TMA cannot detect organic thermo-volatile or thermo-labile compounds, such as amino-acids, vitamins, hormones, etc., which are present in the hair and have an essential role in the metabolisms and nutritionals.
Polarized light is a contrast-enhancing technique that improves the quality of the image obtained with birefringent materials. The polarized light microscope is used to analyse the anisotropy of a specimen’s optical properties, such as refraction and absorption. Optical anisotropy is a consequence of molecular order, which renders material properties; such as absorption, refraction, and scattering; that depend on the polarization of light. Polarized light microscopy exploits this dependency and provides a sensitive tool to analyse the alignment of molecular bonds or fine structural form in cells and whole organisms. Quantitative polarized light method has been designed to operate in the visible region of the spectrum (400-700nm wavelengths) and make possible the association of the wavelength in each pixel with the corresponding single substance or can associate different shapes with organic molecules.
The present article presents an innovative and precise quantitative method of hair analysis by quantitative polarized light microscopy of optically active substances. Using the remote sensing application couple with the unmixing mathematical procedures, the analytical technique provides a reading of the intracellular content in the hair, in particular bulb), by mean of a single, simple, fast analysis. The analytical determination includes minerals and organic thermo-labile compounds such as vitamins, amino acids and hormones, otherwise not possible with TMA, and does not require complex, sophisticated instruments and procedures.
MATERIALS AND METHODS
Equipment
Hair sampling
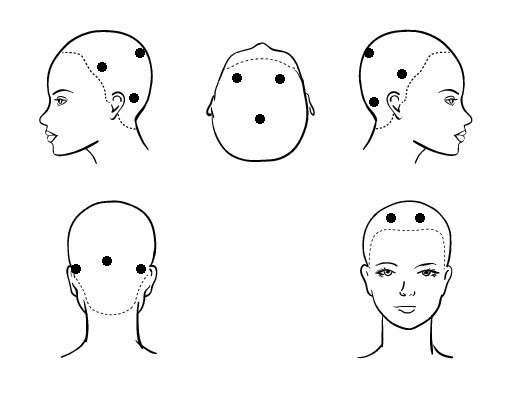 Figure 1: Preferential Operating Points (POP) for hair sampling.
To standardize the method to assay mineral and organic compound concentration in the hair bulb, the following recommendations was taking into consideration:
1) The hair sample was taken without washing the hair for at least (24-48) h.
2) The hair was taken with the bulb and the stem. In subjects with short hair, the use special tweezers are needed.
3) The hair was taken in areas of the head called Preferential Operating Points (POP) figure 1. The POP is:
a) Front parietal right and left (not to be used if there are situations like alopecia androgenetiforme both male and female);
b) Occipital and/or inferior occipital (in cases of alopecia extended);
c) Left and right ear.
For the analysis was taken 3-5 hair by each POP (6 POPx5 hair=30 hairs). In cases where it is not possible sampling the frontoparietal POP, is indicated to increase the number of hair collected in the other POP. In total hair sample analyzed was 30 hairs. Regions of Interest (ROI) for analysis correspond with the bulb of the hair. The oval form of this area was recognized by the software. The black background of the photo (because is a fluorescent photo) serve as limit of the ROI. In that way, variation in the thickness of the hair, intra or inter individuals, do not interfere with the analysis.
Digital photos
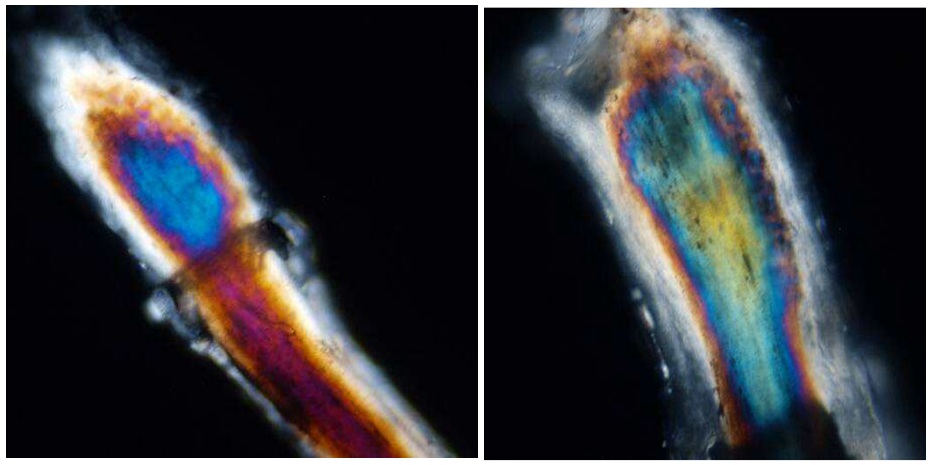 Figure 2: Representative photo of the hair bulb, using polarized light microscopy with high definition camera (magnification 20x).
The images are downloaded to a personal computer. Usually, the pictures present a “noise” in some pixels or small cluster of pixels given by electronics or intrinsic artificial factors in the file format (i.e., JPEG), which affects the brightness and sharpness of the chromatic bands. The noise in the pictures is eliminated by a correction algorithm suitably adapted for the system, which does not touch the other variables in the pixels, such as wavelength and intensity of the refracted polarized light.
The pixels in the pictures have then been scanner using an electronic pointer or tele-beamer, which has determined the wavelength and intensity of the refracted polarized light in each pixel with a precision of ten thousand (four digits after the point).
Statistic
RESULTS AND DISCUSSION
The basis of the hair analysis by polarized light
The term generally refers to the use of imaging sensor technologies, including instruments found in astronomy, aircraft/spacecraft, geophysical analysis, military applications and medical imaging. In the biomedical field, Magnetic Resonance Imaging (MRI) is an example of remote sensing applications in biomedical field [30]. Remote sensing provides in general a high spectral resolution of hyper-spectral images, which are a combination of single signals or spectra. Practically, a hyper-spectral image of a homogeneous object is a mixture of more than one components from distinct materials combined into the object [31].
Spectral unmixing, or deconvolution, is an algorithm-based process used to reverse the effects of convolution on recorded data [31,32], thus the procedure by which the hyper-spectral spectrum is decomposed into a collection of constituent spectra, or end members, and a set of corresponding fractions, or abundances, that indicate the proportion of each end member present in the pixel. Broadly speaking, unmixing is a special case of the generalized inverse problem that estimates parameters describing an object using an observation of a signal that has interacted with the object before arriving at the sensor [33]. The concept of deconvolution is then widely used in the techniques of signal processing and image processing, such as the remote sensing.
The linear mixing model, or independent component analysis, has been applied for the development of the algorithms, since it has been demonstrated in numerous applications to be a useful technique for interpreting the variability in remote sensing data and a powerful means for converting spectral information into data products that can be related to the physical abundance of materials, in particular in the biomedical field [30].
Independent component analysis is a statistical method used to discover hidden factors (sources or features) from a set of measurements or observed data such that the sources are maximally independent. Typically, it assumes a generative model where observations are assumed to be linear mixtures of independent sources.
If the total surface area of the pixel is considered to be divided proportionally according to the fractional abundances of the end-members, then the (emitted, reflected or refracted) radiation will convey the characteristics of the associated members with the same proportions. In this sense, there exists a linear relationship between the fractional abundance of the substances comprising the area being imaged and the spectra in the i.e., reflected radiation [31-33]. In this case, the spectrum of a mixed pixel is a linear combination of the end-member spectra weighted by the fractional area coverage of each end-member in the pixel.
Therefore, the object of deconvolution (unmixing) is to find the solution of a convolution equation of the form:


Algorithms in the IDL software have been refined and optimized to better discriminate the structural patterns and, by exploiting statistical and mathematical models, to properly represent their morphology taking into account the characteristics of the picture. The least square method has been however taken as a model, with the aim of estimating the relative abundance of end-members in the pixel that minimize the squared-error of the function.
A further central precept for the application of the software is that the number of end-members required to unmix an entire “scene” (i.e., full hair bulb picture) can be considerably greater than the number present in any individual pixel, and each pixel in a scene may utilize a different subset of end-members. The number of end-members that may be practically identified and used in a pixel is few, typically ranging from three to seven, depending on the number spectral variability of the scene components [31,36-39].
The IDL software thus evaluates the wavelength and absorbance in each pixel and then compares the absorbance of all the end members at that single wavelength value. A corresponding list of end members in descending order of absorbance is produced accordingly; within this list, only a fraction of end members, i.e., those with highest absorbance, will be considered for processing by unmixing. In the present application, only the first 10 have been considered for the unmixing processing, since the contribution of absorbance from the other end members is zero (practically, the first 2-4 end members provides a substantial contribution, while that of the following ones are almost negligible).
This unmixing process has been applied to each pixel, then reading in the millions of colors (wavelengths) belonging to the hair and, referring to the reference spectral pattern of the pure substances (end members) previously constructed, and to determine the content of the substances [34].
Starting from the already existing algorithms for the classification of the multi-spectrum images in a multivariable and multimodal histogram, the IDL software has been improved by expressing each class of image through a succession of independent Gaussian curves, each of them having different mean, width and orientation. This improvement has allowed for getting a more precise mathematical representation to image classes with asymmetric histograms.
Reliability of the software
| Compound | µg/g | SD | % CV | Compound | µg/g | SD | % CV |
| Aluminum | 54.91 | 0.77 | 1.40 | Serotonin | 170.19 | 2.40 | 1.41 |
| Arsenic | 1.01 | 0.01 | 0.20 | Noradrenalin | 9.38 | 0.06 | 0.67 |
| Barium | 9.81 | 0.03 | 0.32 | Testosterone | 176.38 | 0.85 | 0.48 |
| Cadmium | 13.42 | 0.32 | 2.41 | Folic acid | 140.77 | 1.39 | 0.99 |
| Mercury | 0.95 | 0.00 | 0.27 | Niacin | 0.00 | 0.00 | N.d. |
| Nickel | 5.89 | 0.05 | 0.90 | Vitamin A | 235.75 | 2.30 | 0.98 |
| Lead | 28.58 | 0.02 | 0.07 | Vitamin B1 | 27.18 | 0.69 | 2.53 |
| Uranium | 0.93 | 0.03 | 2.95 | Vitamin B2 | 24.91 | 0.54 | 2.18 |
| Silver | 0.25 | 0.01 | 6.02 | Vitamin B5 | 14.95 | 0.05 | 0.36 |
| Calcium * | 1.43 | 0.03 | 2.36 | Vitamin B6 | 61.58 | 1.15 | 1.87 |
| Cobalt | 3.03 | 0.07 | 2.47 | Vitamin B12 | 15.73 | 0.04 | 0.23 |
| Chrome | 0.35 | 0.00 | 0.35 | Vitamin C | 34.64 | 0.73 | 2.11 |
| Iron | 18.31 | 0.39 | 2.11 | Vitamin D | 136.32 | 2.45 | 1.79 |
| Fluorine | 31.13 | 0.58 | 1.86 | Vitamin E | 36.70 | 0.05 | 0.15 |
| Phosphorus | 70.73 | 0.59 | 0.84 | Vitamin H | 25.03 | 0.10 | 0.41 |
| Iodine | 16.61 | 0.05 | 0.31 | Vitamin K | 15.25 | 0.04 | 0.02 |
| Lithium | 0.19 | 0.02 | 8.24 | Aspartic acid | 20.44 | 0.05 | 0.26 |
| Magnesium | 135.63 | 9.04 | 6.66 | Glutamic acid | 248.08 | 0.34 | 0.14 |
| Manganese | 5.03 | 0.16 | 3.12 | Alanine | 15.53 | 0.01 | 0.09 |
| Molybdenum | 2.57 | 0.08 | 3.27 | Arginine | 61.92 | 0.01 | 0.02 |
| Gold | 0.94 | 0.03 | 2.94 | Cysteine | 73.54 | 0.58 | 0.79 |
| Potassium | 160.40 | 12.23 | 7.62 | Phenylalanine | 22.05 | 0.01 | 0.04 |
| Selenium | 58.54 | 0.28 | 0.49 | Glycine | 28.99 | 0.11 | 0.39 |
| Silicon | 47.56 | 1.58 | 3.33 | Isoleucine | 40.95 | 0.13 | 0.32 |
| Sodium | 227.88 | 1.29 | 0.57 | Hystidine | 39.94 | 0.40 | 0.99 |
| Tin | 1.99 | 0.01 | 0.64 | Leucine | 54.48 | 0.26 | 0.48 |
| Strontium | 26.63 | 0.20 | 0.75 | Lysine | 16.23 | 0.13 | 0.79 |
| Copper | 236.40 | 2.40 | 1.02 | Methionine | 33.70 | 0.12 | 0.37 |
| Vanadium | 0.39 | 0.01 | 3.76 | Proline | 23.91 | 0.05 | 0.20 |
| Zinc | 186.26 | 0.95 | 0.51 | Serine | 85.12 | 0.06 | 0.07 |
| Sulfur * | 503.7 | 9.6 | 1.90 | Taurine | 50.11 | 0.71 | 1.42 |
| Estrogen | 19.95 | 0.18 | 0.91 | Tyrosine | 36.24 | 0.10 | 0.28 |
| Progesterone | 16.54 | 0.17 | 1.03 | Threonine | 65.62 | 0.04 | 0.06 |
| Oxyitocin | 621.55 | 2.14 | 0.34 | Tryptophan | 43.93 | 0.04 | 0.08 |
| Dopamine | 26.92 | 0.54 | 1.99 | Valine | 141.62 | 0.90 | 0.64 |
The results obtained in the experiment for the quantification of the method precision are reported in table 1. One element (niacin) has not been detected in the hairs, thus has not been considered.
All the 69 compounds have shown a CV lower than 10%. Moreover, 65 (94% of the panel) and 52 (75%) compounds have shown a CV lower than 5% and 2%, respectively.
More in details, 27/31 (87%) and 17/31 (55%) of the pure elements have a CV lower than 5% and 2%, respectively. Among vitamins, 9/12 (75%) have a CV lower than 2%, while it is lower than 5% in all of them. All the other organic compounds (amino-acids and hormones) have a CV lower than 2%.
The results have shown that the analytical method by polarized light microscopy is precise, or even highly precise for the organic compounds. The differences in CV, mainly found among the pure elements (minerals), can be ascribed to the poor abundance in the hair, with consequent possible increase of the relative error of measure (i.e., silver, lithium), and/or the intrinsic characteristics of interaction between the elements and polarized light (i.e., magnesium, potassium). In fact, a necessary requirement for the application of the present method is the optical activity of the compounds to the polarized light. Higher is the optical activity, more precise will result both the determination of the reference pattern (end-member) and the detection of that particular compound.
The authors would also like to highlight that further improvements in the precision of the analytical method should be provided by the last generation automatic, self-focusing microscopes equipped with higher resolution pixel cameras, not present in the company, yet. Investigations in that sense are planned shortly.
BCC method has been compared with Inductively Coupled Plasma Mass Spectrometry (ICP-MS), internationally recognized golden standard for hair analysis. The ICP-MS sensitivity is in ppb, while BCC can only reach 1/10 di ppm, in any case a very good sensitivity. ICP-MS is about 100 times more sensible of BCC and, therefore, superior than BCC regarding the absolute analytical performances. On the contrary, ICP-MS cannot be used as a screening test. As known, it requires highly specialised personnel, sophisticated and expensive equipment and is time demanding. The crude cost of ICP-MS is, in fact, about one order of magnitude higher (hundreds of Euro) than BCC [40].
CONCLUSION
The proposed method by polarized light microscopy is simple, fast, cheap and, consequently, provides a high output. It can determine with a high precision a high number of substances by mean of a single analysis, such as minerals, vitamins, amino-acids and hormones.
Compared to the methods currently in use, the proposed method allows the detection of organic, thermo-labile compounds, otherwise not possible with TMA, and does not required complex, sophisticated instruments and procedures, and consequently, highly specialized personnel, as in the most precise methodologies.
By the combination of remote sensing and unmixing, the hair analysis by polarized light microscopy provides the highest probability for the quail-quantitative determination of compounds in the sample. Nevertheless, a comparative investigation is undergoing with the parallel use of third sophisticated methodologies (i.e., GC-MS, ICP-MS) to compare the results of the two approaches and, therefore, to allow a more confident use in the clinical routines. The intrinsic biological variability in the individuals will be evaluated in this investigation.
The proposed method of hair analysis by polarized light can therefore be a potent tool for medical doctors, toxicologist, forensic medicine and, more in general, health care practitioners and researchers, somehow involved in the analysis of the hair and in using its experimental results. It can be used in a wide spectrum of applications, from the screening and routine use in medicine and, more in general, in the health care, to the investigation on the still undiscovered properties of the hair and on the clinical research.
REFERENCES
- Kempson IM, Lombi E (2011) Hair analysis as a biomonitor for toxicology, disease and health status. Chem Soc Rev 40: 3915-3940.
- Watts DL (1990) Nutritional interrelationships: Minerals, vitamins, endocrines. J Orthomolecular Med 5: 11-19.
- Watts DL (2006) Trace elements and other essential nutrients: Clinical application of tissue mineral analysis, (5th edn). Trace Elements Incorporate, Texas, USA.
- Wise DR (2000) Lectures on hair analysis: Alexandria. Inter Clinical Laboratories Educational Publications, Sydney, Australia.
- Watts DL (1990) Trace elements and neuropsychological problems as reflected in tissue mineral analysis (TMA) patterns. Journal of Orthomolecular Medicine 5: 159-166.
- Wilson L (2014) Nutritional balancing and hair mineral analysis, (5th edn). The Prescott Saver, Prescott, USA.
- Jouybari L, Saei Ghare Naz M, Sanagoo A, Kiani F, Sayehmiri F, et al. (2018) Toxic elements as biomarkers for breast cancer: A meta-analysis study. Cancer Manag Res 10: 69-79.
- Orfanos CE, Happle R (1990) Hair and hair diseases, (1st edn). Springer-Verlag, Berlin, Germany.
- Santos Serrão de Castro N, de Oliveira Lima M (2018) Hair as a biomarker of long term mercury exposure in brazilian amazon: A systematic review. Int J Environ Res Public Health 15.
- Harkey MR (1993) Anatomy and physiology of hair. Forensic Sci Int 63: 9-18.
- Ditton J (2002) Hair Testing: Just how accurate is it? Surveillance & Society 1: 86-101.
- Tilstone WJ, Savage KA, Clark LA (2006) Forensic Science: An encyclopedia of history, methods, and techniques. ABC-CLIO, Santa Barbara, USA.
- Manson P, Zlotkin S (1985) Hair analysis--a critical review. Can Med Assoc J 133: 186-188.
- Cho JM, Yang HR (2017) Hair mineral and trace element contents as reliable markers of nutritional status compared to serum levels of these elements in children newly diagnosed with inflammatory bowel disease. Biol Trace Elem Res.
- Skalny AV, Simashkova NV, Klyushnik TP, Grabeklis AR, Bjørklund G, et al. (2017) Hair toxic and essential trace elements in children with autism spectrum disorder. Metab Brain Dis 32: 195-202.
- Kim HY, Lee JY, Yang HR (2016) Nutrient intakes and hair mineral contents of young children. Pediatr Gastroenterol Hepatol Nutr 19: 123-129.
- Barbosa F, Tanus-Santos JE, Gerlach RF, Parsons PJ (2005) A critical review of biomarkers used for monitoring human exposure to lead: Advantages, limitations, and future needs. Environ Health Perspect 113: 1669-1674.
- Barroso M, Gallardo E, Vieira DN, López-Rivadulla M, Queiroz JA (2011) Hair: A complementary source of bioanalytical information in forensic toxicology. Bioanalysis 3: 67-79.
- Kim J, Lee S, In S, Choi H, Chung H (2011) Validation of a simultaneous analytical method for the detection of 27 benzodiazepines and metabolites and zolpidem in hair using LC-MS/MS and its application to human and rat hair. J Chromatogr B Analyt Technol Biomed Life Sci 879: 878-886.
- Porta T, Grivet C, Kraemer T, Varesio E, Hopfgartner G (2011) Single hair cocaine consumption monitoring by mass spectrometric imaging. Anal Chem 83: 4266-4272.
- Poetzsch M, Steuer AE, Roemmelt AT, Baumgartner MR, Kraemer T (2014) Single hair analysis of small molecules using MALDI-triple quadrupole MS imaging and LC-MS/MS: Investigations on opportunities and pitfalls. Anal Chem 86: 11758-11765.
- Dongarrà G, Lombardo M, Tamburo E, Varrica D, Cibella F, et al. (2011) Concentration and reference interval of trace elements in human hair from students living in Palermo, Sicily (Italy). Environ Toxicol Pharmacol 32: 27-34.
- Gottardo R, Bortolotti F, De Paoli G, Pascali JP, Miksik I, et al. (2007) Hair analysis for illicit drugs by using capillary zone electrophoresis-electrospray ionization-ion trap mass spectrometry. J Chromatogr A 1159: 185-189.
- Seidel S, Kreutzer R, Smith D, McNeel S, Gilliss D (2001) Assessment of commercial laboratories performing hair mineral analysis. JAMA 285: 67-72.
- Shamberger RJ (2002) Validity of hair mineral testing. Biol Trace Elem Res 87: 1-28.
- Drasch G, Roider G (2002) Assessment of hair mineral analysis commercially offered in Germany. J Trace Elem Med Biol 16: 27-31.
- Harkins DK, Susten AS (2003) Hair analysis: Exploring the state of the science. Environ Health Perspect 111: 576-578.
- Hamilton T, Schweinsberg F (2004) [The reliability of conclusions based on hair mineral analysis in individual diagnostic]. Versicherungsmedizin 56: 136-140.
- Schowengerdt RA (2007) Remote Sensing, (3rd edn). Academic Press/Elsevier, London, UK.
- Eichele T, Calhoun VD, Moosmann M, Specht K, Jongsma ML, et al. (2008) Unmixing concurrent EEG-fMRI with parallel independent component analysis. Int J Psychophysiol 67: 222-234.
- Keshava N, Mustard JF (2002) Spectral unmixing. IEEE Signal Processing Magazine 19: 44-57.
- Rowe DB (2002) Multivariate bayesian statistics: Models for source separation and signal unmixing. CRC Press, Florida, USA.
- Iaquinta J, Pinty B, Privette JL (1997) Inversion of a physically based bidirectional reflectance model of vegetation. IEEE Trans Geosci Remote Sensing 35: 687-698.
- Ferri A (2011) Method for the determination of analytes in the hair, EP 2 518 474 A1. G01N21/21, G01N21/27, G01N21/31. European Patent Application, Italy.
- Ferri A (2006) Software file n. 006091-D005370. In: Registro Pubblico Speciale per I Programmi per Elaboratore: Società Italiana degli Autori ed Editori.
- Maselli F (1998) Multiclass spectral decomposition of remotely sensed scenes by selective pixel unmixing. IEEE Trans Geosci Remote Sensing 36: 1809-1820.
- Wu CC, Lo CS, Chang CI (2009) Improved process for use of a simplex growing algorithm for endmember extraction. IEEE Trans Geosci Remote Sensing 6: 523-527.
- Dennison PE, Roberts DA (2003) Endmember selection for multiple endmember spectral mixture analysis using endmember average RMSE. Remote Sensing of Environment 87: 123-135.
- Okin WJ, Okin GS, Roberts DA, Murray B (1999) Multiple endmember spectral mixture analysis: Endmember choice in an arid shrubland.
- Nasuti C, Ferraro S, Giovannetti R, Fedeli D, Guidi M, et al. (2014) Metal detection in hair as biomarker to monitor the health status in rats. J Nutrigenet Nutrigenom.
Citation: Martínez-Sánchez G, Augusto F, Ruggero F (2018) Hair Analysis by Polarized Light Microscopy, a New Tool in Medical Research. J Toxicol Cur Res 2: 004.
Copyright: © 2018 Ferri Augusto, et al. This is an open-access article distributed under the terms of the Creative Commons Attribution License, which permits unrestricted use, distribution, and reproduction in any medium, provided the original author and source are credited.