A Study on Fish Production among Different Scale Producers in Morang District of Nepal
*Corresponding Author(s):
Subodh PokhrelTropical Aquaculture, Can Tho University, Can Tho City, Vietnam
Tel:84 1269366587,
Email:aquasubodh@gmail.com
Abstract
A study was conducted in Morang district of Nepal to access the fish production and to compare the productivity between large scale, medium scale and small scale farmers. Out of 72 selected farmers, 12 farmers belonged to large scale, 8 medium scale and 52 small scale farmers were interviewed using semi structured questionnaire and focus group discussion to generate valuable information. The average pond size of the study area was found to be 0.63 ha. About 76% respondents got fish seed from Government and private hatchery of Nepal while 23.6% respondents got fish seed imported from India and Bangladesh. The mean stocking size for carp seed in the study area was found to be 7.0 g. The mean stocking number of fish in the study area was 7,412 fish/ha. The average length of culture period was 300 days. Rice bran, wheat bran, maize bran and mustard oil cakes were the major ingredients used as fish feed for fish. The majority of respondents in the study area followed a multiple harvest strategy. The productivity of the small scale, medium scale and large scale farmers was found to be 2.8±0.1, 2.7±0.2, 2.1±0.2 ton/ha respectively. The marketing system was purely private based dominated by traders. This study revealed that farmers were facing several fish production problems like shortage in fish seed supply, lack of marketing infrastructure and post-harvest management, mismanaged marketing channel, competition with Indian fish, minimum use of inputs (fish feed, chemical fertilizers and lime), diseases and pests, poor status of agri-mechanization and lack of technical knowledge and guidance, non-technical pond design and traditional culture practices. Thus, special extension programs to cope the above mentioned fish production problems need to be implemented to revolutionize aquaculture in Morang district.
Keywords
Inputs; Production; Productivity; Technical Knowledge
INTRODUCTION
Aquaculture is an important food production sector in the world. Nepalese aquaculture is in growing stage and the amount of fish production is too low compared to the world aquaculture production; however the progress achieved in recent years is highly encouraging [1].
Aquaculture as a business has short history of about 40 years in Nepal. The aquaculture production program began in 1981/82 in Nepal with the execution of the Aquaculture Development Project supported by the Asian Development Bank and the United Nations Development Program [2]. The Agriculture Perspective Plan (APP) has categorized fisheries and aquaculture in Nepal as a small but important and promising sub-sector of agriculture contributing about 2.47% of Agricultural Gross Domestic Product (AGDP) [3]. The annual total fish production is 64,500 Mt with per capita fish production of 2.2 kg [4]. In Nepal, thousands of people are directly or indirectly engaged in this sector that has contributed in reduction of youth migration to some extent. The current domestic production meets only about 40% of the total country’s demand and about 60% of the total fish demand in Nepal comes from neighboring countries. Fish production and consumption in the Terai region is higher than in the hilly region of Nepal [1].
In the Terai region, Morang district is one of the leading districts in fish farming. From long time, traditionally the Madhesi and Tharu communities used to construct pond for fish farming for household consumption. However, the trend has been slowly changing towards commercialization. Currently, there are about 500 commercial fish farmers with about 3500 pounds and 2 fish hatcheries with total pond area of about 800 ha and water surface area of about 585 ha [5]. Recent study showed that there were about 65% private ponds, 23% public pond and 12% wetlands in the Morang district. Major pond ownership is of Malah community on lease but the majority in involvement of fish farming is of Madhesi community which is around 48% [6].
Rationale of study
Morang district is very favorable for fish culture and aquaculture enterprise development of its climatic, topographical and the market availability. Despite high feasibility of aquaculture entrepreneurship, the productivity is still below the national average and large amount of fishes have to be imported from India. If the awareness can be raised among fish famers through extension, technical support, agri-mechanization and marketing security, this district will be self-reliance in aquaculture within next few years. This study aimed to explain the existing aquaculture practices in the district, causes of low productivity, problem and prospects and socio-economic condition of fish farmers at different targeted areas of Morang district. The findings of this study is useful for planners, policy makers, project implementers, farmers and donors to formulate policy, strategy and plan; and promote, adoption and dissemination of fish farming based technology in rural area of Nepal.
Objectives
The objectives of the study are:
- To assess the fish production and marketing in Morang district of Nepal.
- To assess the fish production technology practiced by small, medium and large-scale farmers in Morang district.
- To be acquainted with problems of fish farmers in Morang district.
Conceptual Framework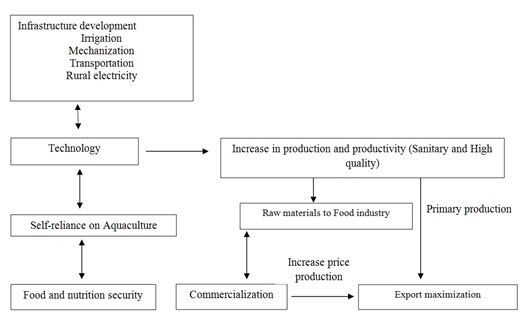
MATERIALS AND METHODS
Selection of the study area
The area selected for the present study was the Morang district of Koshi zone, which is situated at the northern part of Eastern Development region of Nepal. Morang district is the historical pride of the eastern development region which is second largest district of Nepal in terms of industries and population. Morang district has 50 Village Development Committees (VDCs), 1 sub metropolitan city and 7 municipalities. This district is highly potential from agriculture point of view. It has clayey, sandy loam and loamy soil at its northern part i.e. Terai region. This district has maximum temperature of 30°C and minimum temperature of 19.6°C. The total annual rainfall of 1097.8 millimeter in fiscal year 2072/2073 (Personal communication: Eastern Regional wind rain office, Dharan).
Nature and source of data
For this study both the primary and secondary source of data collected to evaluate the above mentioned objectives. The primary data were collected from the direct scheduled interview with the respondents using the semi structured questionnaire and focus group discussion. Interview schedule design, pretesting of questionnaire and regular field survey were done for effective primary data collection. The sources of secondary data were the DADO profile, Directorate of Fisheries Development, Central Bureau of Statistics, related documents, publications and research paper.
Selection of the sample respondents
There were total 250 fish farmers listed by DADO in the district, out of which altogether 72 respondents were selected randomly, out of which 12 were from large scale (more than 1.0 ha pond area), 8 were from medium scale (0.51-1.0 ha pond area) and 52 were from small scale (up to 0.50 ha pond area). For the study purpose, Rangeli, Babiya, Birta, Sorabhag and Kathari of the district were selected randomly to carry out overall and comparative study on fish production and marketing in Morang district of Nepal between small scale, medium scale and large scale farmers.
DATA PROCESSING AND ANALYSIS
The collected data were edited and the local units of measurements were standardized into the scientific one. All the important primary data that were collected from households were coded and compiled in Ms-Excel and Statistical Package for Social Science (SPSS) Version 21.0 software. Collected data were analyzed using the descriptive and inferential statistics.
RESULT AND DISCUSSION
This section presents the key findings from the fish producing households in Morang district. It analyses the fish production systems, constraints, key knowledge gaps, prospects and identifies potential intervention aimed at improving the expansion of aquaculture and improving and diversifying rural livelihoods.
Source of fish seed
The readily availability of fish seeds is a strong driving force for aquaculture development. There is lack of sufficient seed supply in many parts of the surveyed area. Among the 72 respondents, 76.4% got fish seed from Government/private hatchery and 23.6% from importers. Although the seeds of private hatchery are of good quality, they are not enough to fulfill fish seed requirement. Large proportions of small-scale farmers (80.8%) got their fish seed from importers, while majority (87.5%) got their fish seed from Government/private hatchery (Table 1). Data indicates the % response of the respondents.
|
Parameter |
Small scale |
Medium scale |
Large scale |
Total |
|
Government/Private hatchery |
19.2 |
87.5 |
50 |
76.4 |
|
Importers |
80.8 |
12.5 |
50 |
23.6 |
Table 1: Major sources of fish seed in Morang district of Nepal.
Stock size and density
The size and density of fry/fingerling stocking varied among farmers. Although, there was a large variation in fish stocking size among farmers, the mean stocking size for carp seed in the study area was 7.0 g. Similarly, the mean stocking size in small-scale, medium-scale and large-scale farmers were 7.5 g, 6.8 g and 5.2 g, respectively. Similarly, the mean stocking density of fish in the study area was 7412.1 fish/ha.
Stocking density is one of the key factors for fish production. High stocking density causes stunting of fishes whereas low stocking density causes waste of natural food in the pond as well as supplied feed. The stocking density of fish, especially carps, seems lower than recommended by many studies and could be increased two to three fold for increased production and productivity.
CULTURE PERIOD
The study showed that most of the farmers practice poly culture .The culture period of all types of respondents is 300 days. The stocking time depends on the cultured species and seed availability. It was found that fish stocking time was usually March to May and harvesting time is October to December. The average length of culture period was 300 days. There was no difference in culture period among different level of farmers (Table 2).
|
Parameter |
Small scale |
Medium scale |
Large scale |
Total |
|
Culture system |
Carp polyculture |
Carp polyculture |
Carp polyculture |
Carp polyculture |
|
Stock number |
7529.9±6207.4 (4000-26000) |
6562±71661.5 (5000-21000) |
8144.3±113564.5 (7500-20000) |
7412.06±63811.1 (4000-26000) |
|
Stock size (g) |
7.5±8.3 (0.01-40.0) |
6.8±10.5 (0.3-30) |
5.17±3.6 (0.00-13.3) |
7.01±7.9 (0.01-40) |
|
Average harvesting size (g) |
527.4±277.4 (200-1500) |
406.3±99.4 (250-600) |
479.6±174.22 (225-700) |
506.3±251.9 (200-1500) |
|
Productivity (ton/ha) |
2.8±0.1a (0.5-3) |
2.7±0.2a (0.5-5.2) |
2.1±0.2b (1.17-5.3) |
2.3±0.8 (0.5-5.3) |
|
Daily growth rate (g/fish/d) |
1.8±0.92 (0.65-5) |
1.3±0.32 (0.82-2) |
1.5±0.72 (0.02-2.3) |
1.6±0.9 (0.02-5) |
Table 2: Culture system, stocking number & size, harvesting size, productivity, and Daily growth rate of fish species.
Mean values with different superscript letters in the same row are significantly different (P<0.05) and the value in parenthesis indicates the minimum and maximum value.
Fish feed
Feed is the most important input for aquaculture, accounting for the majority of input costs. The type, quantity and quality of feeds used, and the efficiency with which they are applied are key factors influencing fish growth, production cycle, water quality, yields and profitability. Rice bran, wheat bran, maize bran and Mustard Oil Cake (MOC) are the major ingredients used as fish feed for carp fish in the study area. None of the respondent used pellets or other commercial feeds. The majority of the farmers reported that they feed their fish once daily. Sometimes, kitchen wastes, though available only in a very small quantity, were frequently applied to fishponds.
In overall, most of the farmers feed maize bran and MOC (45.8%) followed by rice bran and MOC (27.8%) and then wheat bran and MOC (26.4%). The large scale farmers feed more rice bran and MOC mixtures (58.3%) as it is easily available and nutritious (Table 3). Data indicates the % response of the respondents.
|
Parameter |
Small scale |
Medium scale |
Large scale |
Total |
|
Rice bran and MOC |
30.8 |
37.5 |
58.3 |
27.8 |
|
Maize bran and MOC |
50 |
37.5 |
25 |
45.8 |
|
Wheat bran and MOC |
28.8 |
25 |
16.7 |
26.4 |
Table 3: Total Composition of different feed ingredients of the respondent HHs in Morang.
Use of inputs
Fertilizers are added in fish ponds in order to maximize the yields. The average amount of organic manure used in fish pond was 4590.4 ton/ha. Similarly, the total amount of Diammonium Phosphate and Urea used in fish pond was 734.6 ton/ha, respectively. The majority of the households reported that manures are applied without calculation of the pond area. 13.9% of the fish farmers use ice to preserve fish. Most of the farmers practice traditional cultural practices. So, only 11.1% fish farmer use aerator. Around 85% fish farmers are facing the loss from fish disease but only 5.6% fish farmer use drugs to control diseases. Mean values with different superscript letters in the same column are significantly different (P<0.05) (Tables 4 and 5).
|
Farmer size |
Feed (kg/ha) |
Lime (kg/ha) |
Farm Yard Manure (kg/ha) |
Chemical fertilizer (kg/ha)
|
|
Small scale
|
5928.9±2683 (2500-11544) |
440.8±47.5 (3-180) |
2665.7±3933.8b (16-20000) |
302±459.32 (2-2100) |
|
Medium scale |
5331.9±3608.8 (2403.2-9000) |
462±601.6 (10-1440) |
3156±5454.7a (400-12000) |
503.7±282.8 (200-1000) |
|
Large scale |
10993.3±1522.6 (3000-13600) |
633.9±626.01 (10-1590) |
10530±11538.5a (1000-39750) |
415.3±464.3 (2-2100) |
|
Total |
6622.1±8490.7 (2403.2-13600) |
283.1±474.2 (3-1590) |
4590.4±7154.6 (16-39750) |
734.6±496.6 (2280-1788.8) |
Table 4: Use of total inputs during culture period in fish farming.
|
Farmer size |
Use of aerator |
Use of medicine |
Use of ice |
|||
|
|
Use |
No use |
Use |
No use |
Use |
No use |
|
Small scale |
0 |
100 |
0 |
100 |
9.61 |
90.4 |
|
Medium scale |
0 |
100 |
0 |
100 |
50 |
50 |
|
Large scale |
33.33 |
66.7 |
33.33 |
66.7 |
8.3 |
91.7 |
|
Total |
11.11 |
88.9 |
5.56 |
94.44 |
13.89 |
86.11 |
Table 5: Use of aerator, medicine and ice in Aquaculture in fish farming.
Data indicates the % response of farmers.
Harvesting strategy
The majority of HHs (about one-third) in the study area follows a multiple harvest strategy. Single stocking and multiple harvest system was mostly followed by the farmers of Morang District. Stocking of the fingerlings was done at once but the harvesting is done by culling the big fishes sent it to the market. Multiple harvesting was followed according to the market demand and the fish growth.
Fish production, consumption and sale
Fish production, consumption and sale in total and different levels of farmers are presented in table 6. Average fish production of small, medium and large scale farmers in one cycle was 504 kg, 2239 kg and 4203 kg, respectively. Fish consumption is very common among the surveyed respondents ranging from 2.7% to 22.5% of the total production. In overall, the per capita fish consumption ranged from 97.96 kg/year which is higher than the national average of 3.5 kg/caput/year [7]. Mean values with different superscript letters in the same column are significantly different (P<0.05).
|
Farmers size |
Fish produced |
||
|
Fish sold (kg) |
Fish consumed (kg) |
Fish given free to others (kg) |
|
|
Small scale |
400.0±41.5a |
90.0±13.5 |
14.0±2.2a |
|
Medium scale |
2116.2±115.4b |
94.5±12.3 |
28.5±3.7b |
|
Large scale |
4050.0±202.0c |
109.4±15.5 |
43.6±5.1b |
|
Total |
2188.7±119.6 |
97.96±13.76 |
28.7±3.7 |
Table 6: Fish sale details of the respondent.
Institutional support and satisfaction from fish farming
Most of the households had not received any support from the DoFD and DADO or other line agencies for aquaculture. They have been using their own resources and local knowledge learned from neighbors in their current fish farming activities. Recently, Government and few Non-Governmental Organizations reported to have aquaculture operations in the district. Almost all of the respondents reported that they need a financial support to continue/expand their aquaculture activities while around a half of total respondents mentioned that they want technical support. In order to sufficiently develop aquaculture in a sustainable manner, relevant government and non-government institutions need to give emphasis to provide more technical services.
Since the demand of Nepalese fish is high, all fish produced are sold within the district. Although no government subsidy till now, farmer’s satisfaction on fish business is around 90.2%. Around 19.4% farmers borrowed loan for aquaculture and remaining had their own investment. About 91.7% large scale farmers borrowed loan for commercial fish farming whereas only 37.5% medium scale farmers borrow loan for fish farming (Table 7). Data indicates the % response of the farmers.
|
Farmer size |
Satisfaction from government service |
Advantage of fish consumption |
Government subsidy |
Borrow loan |
||||
|
Satisfied |
Unsatisfied |
Yes |
No |
Beneficiaries |
Non beneficiaries |
Borrower |
Non burrower |
|
|
Small scale |
100 |
0 |
100 |
0 |
0 |
100 |
0 |
100 |
|
Medium scale |
50 |
50 |
100 |
0 |
0 |
100 |
37.5 |
62.5 |
|
Large scale |
25 |
75 |
100 |
0 |
0 |
100 |
91.7 |
8.3 |
|
Total |
90.2 |
9.8 |
100 |
0 |
0 |
100 |
19.4 |
80.6 |
Table 7: Farmer’s Satisfaction, Advantage of fish consumption, Government subsidy and investment on fish farming.
CONCLUSION
The present study demonstrates that although the aquaculture system in the Morang district is not well developed and established, it contributed significantly to food and nutrition security and income generation of fish farmers. Essentially, expansion and improvement of aquaculture will help in poverty reduction in this area. There is a good potential to develop and expand small-scale aquaculture in some feasible areas of the Morang with some technical interventions. For this, support from government and line agencies is necessary. The existing aquaculture productivity can be enhanced mainly by improving species combination, pond management, using more inputs and better seed, improving marketing system and acquiring further knowledge of fish farming. There is a need of broad fish mission program to promote aquaculture in the Morang district.
ACKNOWLEDGEMENT
We would like to express our heartfelt gratitude and respect to Mr. Narayan Prasad Pandit, Assistant Professor and Chairman of Department of Aquaculture, AFU, Rampur Mr. Nabin Babu khanal, Assistant Professor Department of Aquaculture, AFU, Rampur Mr. Sridhar Khanal, Planning officer, DADO Morang Mr. Sandip Subedi, Horticulture Development officer, DADO Kaski for their guidance and valuable suggestions throughout the course of our study and preparation of this report. We would like to extend our sincere thanks to all our respondents, farmers, Prime Minister Agriculture Modernization Project (PMAMP) for Co-operation and support during the study.
REFERENCES
- Mishra RN (2015) Nepalese Journal of Aquaculture and Fisheries. Status of Aquaculture in Nepal. Kathmandu, Nepal.
- MOAD (2004) Statistical Information On Nepalese Agriculture 2003/2004. Agri-business promotion and statistics. Ministry of Agriculture and Development, Singhadurbar, Kathmandu, Nepal.
- Rai AK, Clausen J, Smith SF (2008) Potential Development Intervention for Fisheries and Aquaculture in Nepal. Asia Pacific aFishery Commission, FAO, Rome, Italy.
- DoFD (2015) Fish Statistics and Annual Progress Report (Annual report 2014/2015). Balaju, Kathmandu: Government of Nepal, Agriculture Dvelopment Ministry, Directorate of Fisheries Development.
- DADO (2014/15) Annual stattistics Book.
- DADO (2015/16) Annual stattistics Book.
- DoFD (2016) Fish Statistics and Annual Progress Report (Annual report 2072/73). Balaju, Kathmandu: Government of Nepal, Agriculture Dvelopment Ministry, Directorate of Fisheries Development.
Citation: Bista A, Pokhrel S, Khatri B (2019) A Study on Fish Production among Different Scale Producers in Morang District of Nepal. J Aquac Fisheries 3: 022.
Copyright: © 2019 Aditi Bista, et al. This is an open-access article distributed under the terms of the Creative Commons Attribution License, which permits unrestricted use, distribution, and reproduction in any medium, provided the original author and source are credited.