Aspergillus species and Aflatoxin Contamination of Pre and Post- Harvest Maize Grain in West Gojam, Ethiopia
*Corresponding Author(s):
Masresha Ahmed AssayeDepartment Of Internal Medicine, College Of Health Sciences, Addis Ababa University, King George VI St, Addis Ababa, Ethiopia
Email:masreshaman1@yahoo.com, masresha.ahmed@aau.edu.et
Abstract
Contamination of maize by aflatoxins is of major concern because of the health hazards associated with it. Therefore, the present study was designed to assess the level of Aspergillus species and Aflatoxin contamination in pre and post-harvest maize grain. Results indicated that from fifteen pre and fifteen post-harvest maize samples 77.7% of pre harvest with level range from 3.13 to 63.66 μg/kg and 80% of post-harvest sample with level range from 9.02 to 139.8 μg/kg were contaminated by total aflatoxin. The mean total aflatoxin contamination was 18.38 μg/kg for pre harvest and 43.36 μg/kg for post-harvest. Aflatoxin B1 was detected in 66.7% of pre harvest maize with the mean level of 5.00 μg/kg and in 87.7% in post-harvest maize with the mean level of 9.86 μg/kg . To be precise, Paired t-test statistical analysis for total and aflatoxin B1 in maize samples were showed that both total and aflatoxin B1 increased significantly from pre harvest to post - harvest maize (p<0.05). About 66.7% of pre harvest and 86.7% of post-harvest maize samples were exceed the acceptance limit of total aflatoxin and aflatoxin B1 recommended by European Union maximum limit. Aspergillus species contaminations in pre harvest maize 53.3% of samples were contaminated by A. flavus = 26.7%, A. parasiticus = 13.3% and A. nigergroup = 13.3% and in post-harvest maize 79.9% of samples were contaminated by A. flavus = 46.6%, A. parasiticus = 20.0% and A. niger group = 13.3%. In conclusion, the results of the present study revealed that although it was expected that pre harvest maize to have minimal Aspergillus and aflatoxin contamination, the contamination was high in pre harvest and significantly increase from pre harvest to post harvest.
Keywords
INTRODUCTION
Maize is the third most important crop after rice and wheat cultivated in the world. It is a food that is part of the staple diet in Sub-Saharan Africa [1]. Maize is Ethiopia’s leading cereal in terms of production, with 6 million tons produced in 2012 by 9 million farmers across 2 million hectares of land. Over half of all Ethiopian farmers grow maize, mostly for subsistence, with 75% of all maize produced being consumed by the farming household. Currently, maize is the cheapest source of calorie intake in Ethiopia, providing 20.6% of per capita calorie intake nationally. Maize is thus an important crop for overall food security and for economic development in the country [2]. However, the grain is vulnerable to degradation by mycotoxigenic fungi which include Aspergillus, Fusarium and Penicillium [1].
Aspergillus species are the most common toxigenic species in various grains, legumes, oil seeds and foods and feeds. The two most agriculturally important species are Aspergillus flavusand A. parasiticus, which are found through-out the world, being present in both the soil and the air [3]. Among the 18 different types of aflatoxins identified, the major members are aflatoxin B1 (AFB1), B2 (AFB2), G1 (AFG1), G2 (AFG2). Aflatoxin B1 is found widely and in greater concentrations than other naturally occurring forms of aflatoxin throughout the world in foods such as maize, peanuts and peanut products, cotton seed and its extractions, and to some extent, chillies, peppers, and pistachio nuts [4].
The safety of food and feed for human and animal consumption should be of top most priority with regards to the regulation of agricultural and food industries [5]. Mycotoxin attracts worldwide attention because of the significant economic losses associated with their impact on human health, animal productivity and trade [6]. Aflatoxin contamination is a serious food safety problem throughout the world [3] and it is not only a potential source of health hazards but is also involved in the spoilage of agricultural commodities [7]. The regulations on the import and sale of aflatoxin-contaminated food products results in huge losses each year to the agriculture and feed industries [4]. Maize is one of the major cereals crops of global importance, and has always been an important commodity to be traded overseas as food, feed and an industrial grain crop in several countries. Unfortunately, it is also vulnerable to the growth of aflatoxigenic fungi, resulting into subsequent aflatoxin production which causes major yield and economic losses [6]. The Food and Agricultural Organization (FAO), estimates that between 25% and 50% of agricultural crops worldwide is contaminated by mycotoxins [8]. The estimated value of maize lost to aflatoxin is $225 million per year, out of the $932 million due all the mycotoxins in the United States [6].
In recent years, data on mycotoxins of maize in Africa have begun to accumulate with reports, for instance, from Kenya [1], Nigeria [9] and Benin [10]. In Ethiopia there are some reports but they have limited information on the occurrence of Aspergillus species and aflatoxins in pre and post-harvest maize. Habtamu Fufa [11] has done on most commonly consumed agricultural commodities in some part of Ethiopia and Amare Ayalew [12] has done some work on mycotoxins and surface and internal fungi of maize in three cities (Dire Dawa, Adama and Ambo). In general there is limited works has been done in pre harvest and post-harvest maize in the world. Therefore the present study is designed to assess the level of Aspergillus and Aflatoxin contamination in pre and post-harvest maize products in west Gojam Ethiopia.
MATERIALS AND METHODS
Study site
Sample size and sampling method
For pre harvest, 1 kg of each maize samples were collected from the standing maize in the field from each farmers immediately visually assessed for insect damage, discoloration due to fungal agents and these samples were taken immediately to the laboratory, hand-shelled and sun dried for 2-3 days and the samples were then divided into two; one third of the sample for mycological analysis and two-thirds for aflatoxin analysis packed and stored in bags at 4°C in the laboratory until they were be analyzed .
For post-harvest 1 kg of each sample was collected after 3 month of harvest during March 2015, the collected maize samples were placed in clean polyethylene bag with hermetic sealing, labeled and shipped to the laboratory of Food Science and Nutrition Program, Addis Ababa University. The samples were then divided into two; one third of the sample for mycological analysis and two-thirds for aflatoxin analysis packed and stored at 4°C in the laboratory until they were analyzed.
Laboratory studies
Determination of moisture content:
Moisture contents of the maize samples were determined according to using the official method 925.05 [14].
HPLC-FLD determination of aflatoxins in maize sample:
Validation for HPLC-FLD detection of aflatoxins in maize samples was made in accordance with method validated by Faculty of Pharmaceutical Science Laboratory of Food Analysis Ghent, Belgium, Europe for the determination of aflatoxin in maize sample. This method has been widely used for the determination of aflatoxins in food; no post column derivitization needed Robust; easy and relatively fast procedure for sample preparation; Quick, Easy, Cheap, Effective, Rugged, and Safe.
Samples were homogenized prior to milling and a representative sample were taken and milled to a desired particule size (0.5 mm - 1.0 mm).
The chemical and reagents used for aflatoxin analysis were HPLC grade acetonitrile, methanol, n-hexane, MgSO4 anhydrous salt, NaCl, aflatoxin standard and deionized water. The AFG1, AFG2, AFB1 and AFB2standards were obtained from Sigma-Aldrich. The pure reference standards were stored in dark place at 4°C. The Aspergillus species isolation and identification equipments and chemicals utilized were incubator, petridish and Potato Dextrose Agar (PDA), 10% sodium hypochlorite solution, and ethanol absolute (99.7%).
Five-point calibration curve graphs were obtained using concentration of 1-16 ppb of AFG2, 5-80 ppb of AFG1, 1-16 ppb of AFB2 and 10-160 ppb of AFB1.
Sample (1.0 g) was weighed in a polypropylene centrifuge tube (15 ml) and 5 ml de-ionized water was added and vortex briefly, and then the samples were allowed to stand for 30 min. But spiked samples were left for equilibration for 30 mins before addition of water. After 30 min, 5 ml of extraction solvent (100% ACN) was added and briefly mixed using a vortex mixer and then it was shacked for 30 min at position 7 using an end-over-end shaker, subsequently, MgSO4 anhydrous salt 2.0 ± 0.05 g and NaCl 0.5 ± 0.01 g were added, shaken briefly to prevent agglomeration of the salts and was mixing using a vortex for 2 min. Afterwards, the tube was centrifuge at 4000xg for 15 min. Then 4 ml of the top organic layer was transferred to a new tube and evaporated under N2 at 40°C. To the residue 200 μl of injection solvent (A: B 50/50) and 200 μl of n-hexane was added and dissolved using a vortex, filtered with micro filter and Centrifuge for 10 min at 10,000xg. Finally 150 μl was collected from the lower phase into HPLC vials.
The HPLC analyses were carried out with Agilent 1100 system, consisting of a degasser, binary pump, auto sampler, column oven and a fluorescence detector. The chromatographic separation was performed with the Zorbax SB RP C18, 150 × 4.6 mm, 5 μm chromatographic column. The mobile phase was of A: Milli Q water (100%) and B: MeOH/ACN (71.5/28.5, v/v) With the gradient elution profile as follows: 25% B at 0 min, 25% B at 1 min, 40% B at 12 min, 50% B at 25 min, 100% B at 28 min, 100% B at 30 min, 25% B at 32 min and 25% B at 35 min. The column temperature was 30°C at the flow rate of 1.5 ml/min to achieve the optimum resolution of the Aflatoxins. The injection volume was maintained at 20 μl for both standard and sample solutions.
Fifty seeds per sample were surface sterilized with 10% sodium hypochlorite (NaOCl) solution for 1 min, followed by immersion in sterile distilled water for 1 min. Surface sterilized seeds were then placed on freshly prepared potato dextrose agar (PDA) plates (five seeds per plate) within which 0.05 mg of streptomycin sulphate has been added to suppress the growth of bacteria in petri plates and incubated for three days at 25°C. Pure cultures of different out growing fungi were obtained by transferring fungal colonies to new PDA plates using sterile toothpicks, and incubating the plates for 5-7 days at 25°C. Pure cultures of each isolate were then stored at 4°C in vials containing 2.5 ml of sterile distilled water for further use.
Isolates were identified to a species level based on morphological (phenotypic) features as described by Abdi et al., Negero et al., and Cotty et al., [15-17]. For this purpose: Isolates representing each pure culture were grown on PDA at 25°C for 5-7 days. Variations in growth rate and thermo-tolerance were also used in identification of Aspergillus species. Aspergillus colonies are downy to powdery in texture. Aspergillus fumigatesis a thermo-tolerant fungus and grows well at temperatures over 40°C. This property is unique to Aspergillus fumigatusis among the Aspergillus species. Aspergillus flavuscan be readily distinguished from other Aspergillus species by lack of growth at 5°C, by rapid growth at both 25 and 37°C and by the production of a bright yellow-green conidial color [16].
RESULTS AND DISCUSSION
Moisture content of pre and post-harvest maize
Crop is usually physiologically mature 7-8 weeks after flowering, at which time the grain contains 35-40 % moisture and has maximum dry weight. This is the time at which the crop should be harvested to avoid unnecessary losses in the field. However, in Ethiopia, the time and method of harvesting maize depend on weather conditions, the size of the crop and how quickly the farmer wants to utilize the crop. In this study, samples were collected 2-3 weeks before harvest but the maize aged more than 4 month after flowering and average moisture content of 14.38 ± 0.95 which was unacceptable. Timing of harvest greatly affects the extent of aflatoxin contamination. Extended field drying of maize increased insect infestation and fungal contamination. Aflatoxin levels increased by about 4 times by the third week and more than 7 times when maize harvest was delayed for 4 weeks [18].
Validation of HPLC-FLD method for aflatoxins analysis in maize sample
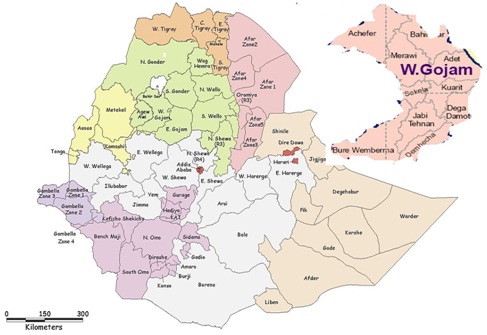 Figure 1: Map of study area.
Five-point calibration curve graphs were obtained with concentration of 1-16 ppb of AFG2, 5-80 ppb of AFG1, 1-16 ppb of AFB2 and 10-160 ppb of AFB1. Calibration graphs were drawn by linear regression of the least-squares method using the peak area of standard as response versus concentration. The correlation coefficients were >0.998, which was considered as evidence of an acceptable fit of the data to the regression line [19].
The test for the precision of the method was checked and verified by repeatability, inter-day and intra-day precision as shown in table 1. It was checked by injecting Aflatoxin (G2=1, G1=5, B2=1 and B2=10) at the low level concentration and Aflatoxin (G2=8, G1=40, B2=8 and B2= 80) at the high level concentration for 5 times on the same day for inter day precision. Similarly, for the inter-day precision similar concentration was analyzed on different days.
| Spike level (µg/kg) | Area and Retention Time | AFG2 | AFG1 | AFB2 | AFB1 | |
| Limit of detection (μg/kg) | 0.03 | 0.3 | 0.14 | 0.15 | ||
| Limit of quantification (μg/kg) | 0.11 | 1.28 | 0.05 | 0.5 | ||
| Repeatability, RSDr (%) | G2=1,G1=5 | Area | 3.26 | 0.75 | 0.82 | 3.39 |
| B2=1 and B1=10 | Retention time | 0.05 | 0.06 | 0.05 | 0.05 | |
| G2=8,G1=40 | Area | 0.5 | 5.13 | 1.12 | 5.3 | |
| B2=16 and B1=80 | Retention time | 0.23 | 0.24 | 0.21 | 0.19 | |
| Reproducibility, RSDr (%) | G2=1,G1=5 | Area | 1.37 | 2.18 | 1.39 | 5.5 |
| B2=1 and B1=10 | Retention time | 0.15 | 0.15 | 0.16 | 0.15 | |
| G2=8,G1=40 | Area | 0.85 | 5.04 | 1.48 | 5.25 | |
| B2=16 and B1=80 | Retention time | 0.04 | 0.03 | 0.03 | 0.03 |
Similarly, Relative Standard Deviations (RSDr) for inter-day samples for peak area at the low level assayed concentration were G2=1.37, G1=2.18, B2=0.1.39 and B1=5.5 and G2=0.85, G1=5.04, B2=1.48 and B1=5.25 at the high level. Similarly, for retention time Relative Standard Deviations (RSDr) for inter-day samples at the low level assayed concentration were G2=0.15, G1=0.15, B2=0.16 and B1=0.15 and G2=0.04, G1=0.03, B2=0.03 and B1=0.03 at the high level (Table 1). Relative standard deviations for retention time and peak area of five replicates were Limit of Detection (LOD) is the concentration of analyte which induce signal (S) that is 3 times higher than the background noise level (N). S/N=3 The detection limits in this study were 0.03, 0.3, 0.014 and 0.15 μg/kg for aflatoxins B1, B2, G1 and G2, respectively, calculated based on three times the standard deviation of the noise (Table 1).
The Limit of Quantitation (LOQ) of the aflatoxins in sample is the concentration of analyte which induce Signal (S) that is 10 times higher than the background noise level (N). S/N=10. The Limit of Quantitation (LOQ) were 0.11, 1.28, 0.05 and 0.5 μg/kg for aflatoxins B1, B2, G1 and G2, respectively, calculated based on 10 times the background noise level (Table 1).
The accuracy of the method was measured from analytical recovery in duplicate sample at spike levels of aflatoxin (G2=4, G=5, B2=4 and B=40 μg/kg). Recovery percentage of each spiked sample was calculated as recovery = (amount found/amount added)*100. The average recovery were AFG2=92.1%, AFG=82.8%, AFB2=97.5% and AFB1=98.3%. The average recoveries for spiked samples ranged from 82.8-98.3% (Table 2). The recoveries obtained were within the range of 70 to 125%, which were acceptable according to AOAC International guidelines for method validation [20].
| Aflatoxin | Aflatoxin concentration in sample (μg/kg) | Aflatoxin level added (μg/kg) | Result found (μg/kg) | Replicate % recovery | Average recovery % | RSD % | ||
| 1 | 2 | 1 | 2 | |||||
| AFG2 | 0 | 4 | 3.81 | 3.56 | 95.25 | 89.03 | 92.14 | 4.8 |
| AFG1 | 12.28 | 5 | 14.05 | 14.56 | 81.31 | 84.26 | 82.79 | 2.5 |
| AFB2 | 0 | 4 | 4.051 | 3.75 | 101.3 | 93.75 | 97.53 | 5.4 |
| AFB1 | 13.878 | 40 | 53.357 | 52.53 | 99.03 | 97.5 | 98.3 | 1.1 |
Table 2: Recovery test of aflatoxin from maize sample.
Levels of aflatoxin in maize samples from West Gojam
About 77.7% total aflatoxin contamination in pre harvest maize obtained in this study is consistence to the result of Ayyathurai et al., [4] who reported that the total aflatoxin contamination about 79.7% of pre harvest maize in India but the results of this study is higher than that of reported in Benin, 42.5% in 1994 and 30% in 1995 in pre harvest maize [10]. These results were also higher than reported in Kenya which was 22.97% of total aflatoxin contamination in pre-harvest maize [21]. The high total aflatoxin contamination in pre harvest may be due to delayed harvesting (high likelihood of kernel damage by pests, insect injury), differences in temperature, humidity, using crop resistance variety, crop rotation system and maintaining adequate irrigation schedule [18]. Genotype, soil types, drought and insect activity are also important in determining the likelihood of pre-harvest contamination [1].Aflatoxin contamination of post-harvest maize (80%) obtained in this study is consistence to result previously reported in Ethiopia, where aflatoxin contamination of post-harvest maize was 88% [12]. However the result of this study is remarkably higher than that of reported in Malaysia which was 40% [20] and 58% in Nigeria [22]. This variation of percentage total aflatoxin contamination in post-harvest may be due to difference in handling process from the time of harvest to the time of consumption. The other reason may be due to once the crop becomes infected under field conditions, the fungal growth continues with increasing at post-harvest and storage conditions [23]. It is also well known that growth of Aspergillus spp. and subsequent production of aflatoxins in maize is dependent on a number of factors such as temperature, humidity, insect injury, handling during pre-harvest, harvest and storage [4,21].According to the present study, in pre harvest maize sample the average aflatoxin G2, G1, B2 and B1 concentration were 2.10 μg/kg , 10.10 μg/kg , 1.17 μg/kg and 5.00 μg/kg respectively. In post-harvest maize sample the average aflatoxin G2, G1, B2 and B1 concentration in the maize sample were 8.14 μg, 18.11 μg/kg, 7.2 μg/kg and 9.86 μg/kg, respectively (Figure 2).Among the naturally occurring aflatoxins (AFG2, AFG1, AFB2 and AFB1), AFB1 is usually predominant and is the most toxic aflatoxin. In this study the most frequently identified was aflatoxin B1 which was 66.7% in pre-harvest and 87.7% in post-harvest. The highest level of AFB1 (29.5 μg/kg) was recorded in post-harvest maize kernel sample. The levels of AFB1 ranged from 3.13 to 27.31 μg/kg and 2.83 to 29.5 μg/kg in pre and post-harvest sample respectively, AFB1 was detected in 60% of pre harvest samples and 80% in post-harvest sample. The samples showed the mean aflatoxin B1 level of 5.00 μg/kg and 9.86 μg/kg for pre and post-harvest maize respectively (Table 4).The current prevalence of AFB1 (66.7%) in pre-harvest and (87.7%) in post-harvest was consistent to results previously reported in India which was 79.7% in pre harvest maize [4] and in Iran which was 77% of post- harvest samples [24] but higher than reported by Muthusamy et al., [21] which was 22.97% of pre-harvest maize and 53.93% post-harvest maize by Ayyathurai et al., [4] which was 22.97% of pre-harvest and 53.93% post-harvest maize. This variation may be due to number of factors such as temperature, humidity, insect injury, handling during pre-harvest, harvest and storage [4,21].
| Type of Sample | Number of Samples | Mean (μg/kg) | Mean of Difference | SD | Std. Error Mean | 95 % CL for Mean | t-test | P-value |
| Pre-harvest | 15 | 18.38 | 25.0 | 26.7 | 6.9 | 10.2-39.8 | 3.6 | 0.003 |
| Post-harvest | 15 | 43.4 |
 Figure 2: Chromatogram of (A) blank sample, (B) standard calebration curve and (C) naturally contaminated fungal sample (elution order AFG2, AFG1, AFB2 and AFB1).
Comparison of the means of total aflatoxin level in pre and post-harvest maize
Comparison of the means of aflatoxin B1 level in pre and post-harvest maize
Paired t-test statistical analysis for mean of Aflatoxin B1 level in pre and post-harvest maize sample is also showed that there was a significant difference in total aflatoxin level between pre and post-harvest maize (t=2.28 p=0.039) which is less than 0.05. Which means aflatoxin B1 level was significantly increase from pre harvest to post-harvest pre harvest maize (Table 4).
| Type of Sample | Number of Samples | Mean (μg/kg) | Mean of Difference | SD | Std. Error Mean | 95 % CL for Mean | t-test | P- value |
| Pre-harvest | 15 | 5.00 | 4.86 | 8.24 | 2.13 | 0.29-9.42 | 2.28 | 0.039 |
| Post-harvest | 15 | 9.86 |
Comparison of aflatoxin results with different international standards
A total of 30 samples consisting of 15 pre-and 15 post-harvest maize samples were collected from farmers’ fields of West Gojam. Samples were analyzed for AFG2, AFG1, AFB2 and AFB1 contamination by HPLC-FLD. The result presented in table 5 showed that 33.3% of pre harvest and 73.3% of post-harvest maize samples were exceeded the limit set by US Food and Drug Administration (FDA), the World Health Organization (tolerance limit of 20 μg/kg). The current percentage is lower than reported in Ethiopia cereal and legume samples [11] higher than reported in Kenya stored maize [26] and India [21].
About 66.7% of pre harvest sample and 86.7% of post-harvest maize samples were exceeded of total aflatoxin levels of European Union (EU) recommended maximum limit 4 μg/kg.
European Union (EU) also established acceptance limit of aflatoxin B1 (
| Sample | FDA/WHO | EU | |
| Total AFTotal AFAFB1 | |||
| Pre-harvest maize sample | 5 (33.3) | 10 (66.7) | 10 (66.7) |
| Post-harvest maize sample | 11(73.3) | 13(86.7) | 13(86.7) |
Aspergillus species were isolated on Potato Dextrose Agar (PDA) and species level were isolated by sub culturing pure cultures of different out growing fungi that were obtained on PDA and by transferring fungal colonies to new PDA plates using sterile tooth picks and incubating the plates for 5-7 days at 25°C. Three different Aspergillus spp. were found to be associated with the pre and post-harvest maize samples collected from West Gojam (Figure 3). The first species isolated from the collected samples was A. flavus. Colonies of this fungus were characterized by a velvety, yellow to green or the old colony was brown mould with a goldish to red-brown on the reverse (Figure 3). This species also distinguished from other Aspergillus species by lack of growth at 5°C, by rapid growth at both 25 and 37°C. The second species were A. niger group, the major distinction from the other species of Aspergillus is the production of carbon black or dark brown spores of biseriate phialides. The current study also confirmed the production of black or brown-black or black conidia by this species (Figure 3). A. parasiticuswas the third species isolated from maize samples tested in the current study. Colonies representing this species produced dark green.
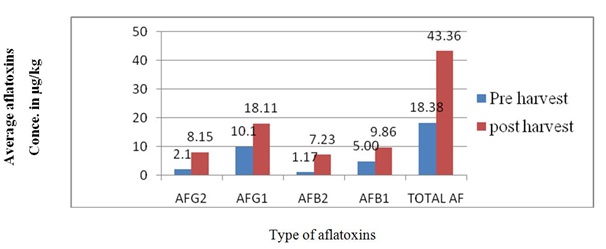 Figure 3: Average concentration of aflatoxin in pre and post-harvest maize.
These observations all the above species were consistent with the findings of [15-17].
From 15 pre-harvest and 15 post-harvest maize samples collected from West Gojam A. flavus, A. parasiticusand A. niger group. A. flavus were isolated on PDA. In pre harvest sample 53.3% of samples were contaminated by Aspergillus species (26.7% = A. flavus, 13.3% = A. parasiticus and 13.3% = A. niger) and in post-harvest maize sample were contaminated Aspergillus species 80% (46.6% = A. flavus, 20.0% = A. parasiticus and 13.4 % = A. niger group) (Figure 4 and 5).
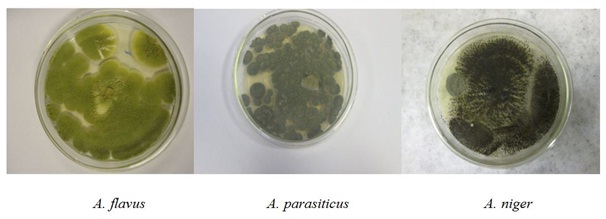 Figure 4: Aspergillus spp. isolated from maize sample.
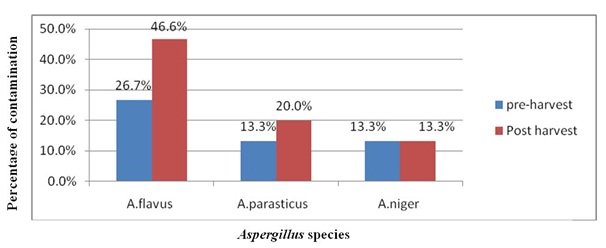 Figure 5: Percentage of Aspergillus species pre and post-harvest maize.
Aspergillus flavusis the main fungal species infecting maize grains. In the current study also the most prevalent Aspergillus species in pre-harvest was A. flavus (26.7%). This was lower than 80% reported in 1994 and 60% in 1995 in Benin [10] and 65 % in Nigeria.
Contamination Aspergillus flavusin post-harvest maize was 46.6%. This was lower than reported in Ethiopia 88% from cereal sample 64% from maize sample [28] and in Kenya 78.5% [29] and higher than reported in Iran 27% [24].
Aspergillus species contamination variation in different countries may be due pre and post-harvest practice of the farmers and also different in temperature, humidity, not (using crop resistance variety, crop rotation system, maintaining adequate irrigation schedule) also the cause of this variation [17]. Genotype, soil types, drought and insect activity are also important in determining the likelihood of Contamination [1]. Moreover, poor harvesting practices, improper storage, and less than optimal conditions during transport and marketing can also contribute to fungal growth and increase the risk of mycotoxin production [16].
CONCLUSION
This research has shown that the level of total aflatoxin contamination is very high in pre and post-harvest maize. In addition, the pre and post maize sample also showed that high aflatoxin B1 level in pre and post- harvest sample. Paired t-test statistical analysis for mean of total and aflatoxin B1 in pre and post- harvest maize samples were showed that both total and aflatoxin B1 increase significantly from pre harvest to post harvest maize. Most of pre and post-harvest samples were exceeded the US Food and Drug Administration (FDA), the World Health Organization (WHO) and European Union (EU) maximum limit of total aflatoxin. In both cases the contaminated maize sample in post-harvest was more exceeded the standards limit than the pre harvest. This research has also shown that high Aspergillus species contamination in pre and post-harvest maize samples. Post-harvest maize samples were more contaminated than the pre-harvest maize.
ACKNOWLEDGMENT
Authors would like to thank the Collage of Natural Science Center for Food Science and Nutrition and Micro Nutrient Initiative (MI) which supported this research work.
REFERENCES
- Muthomi JW, Mureithi BK, Chemining’wa GN, Gathumbi JK, Mutit EW (2012) Aspergillus species and Aflatoxin B1 in soil, maize grain and flour samples from semi-arid and humid regions of Kenya. Inte J Agri Sci 2: 22-34.
- EATA (Ethiopian Agricultural Transformation Agency) (2012) Maize Sector Development Strategy (Working Document 2013-2017), Gabon St, Addis Ababa.
- Abbas HK, Wilkinson JR, Zablotowicz RM, Accinelli C, Abel CA, et al. (2009) Ecology of Aspergillus favus, regulation of Aflatoxin production, and management strategies to reduce Afatoxin contamination of corn. Toxin Reviews 28: 142-153.
- Ayyathurai V, Munusamy M, Muthusamy K, Selvaraj V, Vaikuntavasen P, et al. (2009) Prevalence of Aflatoxin B1 Contamination in Pre- and Post-Harvest Maize Kernels, Food Products, Poultry and Livestock Feeds in Tamil Nadu, India. J Plant Protec Res 49
- Bankole SA, Adebanjo A (2003) Mycotoxins in food in West Africa: current situation and possibilities of controlling it. Afr J Biotech 2 : 254-263.
- Harish C, Jyotsana B, Ajay S (2013) Detection of Aflatoxin in Zea mays L. from Indian Markets by Competitive ELISA. Octa. J. Biosci 1:62-68.
- Kumar P, Lava S, Vera Reddy and Waliyar F (2000) Management of aflatoxins in maize. International Crops Research Institute for the Semi-Arid Tropics (ICRISAT), Andra Pradesh, India.
- Nyandieka HS, Maina JO, Nyamwange C (2009) Destruction of Aflatoxins in Contaminated Maize Samples using Ammoniation Procedures. East Cent Afr J Pharm Sci 12: 47-51.
- Ubwa ST, Asemave K, Igbum GO (2012) Preliminary screening of aflatoxin level in maize (Zea mays L.) in some selected markets in Benue State, Nigeria. Afr J Pure ApplChem 6: 159-163.
- Sétamou M, Cardwell KF, Schulthess F, Hell K (1997) Aspergillus flavusInfection and Aflatoxin Contamination of Pre-harvest Maize in Benin. Plant Dis 81: 1323-1327.
- Habtamu F, Kelbessa U (2001) Survey of Aflatoxin Contamination in Ethiopia. Ethiop J Health Sci 11: 17-25.
- Ayalew A (2010) Mycotoxins and surface and internal fungi of maize from Ethiopia. Afr J food Agric Nutr Dev 9: 4109-4123.
- ECEA (Ethiopia Commodity Exchange Authority) (2003) ECEA.
- AOAC (2000) Official method of analysis of the AOAC, (17th edn), Association of Official Analytic Chemists, Rockville, MD, USA.
- Abdi M, Alemayehu C (2014) Incidence of Aspergillus contamination of groundnut (Arachis hypogaea L.) in Eastern Ethiopia. Afr J Microbiol Res 8: 759-765.
- Negero G, Yimtubezinash W, Daniel A, Asfaw D, Hirut L et al. (2014) Assessment of aflatoxigeinic Aspergillus species in food commodities from local market of Addis Ababa. Research 1: 1-5.
- Cotty PJ (1994) Influence of field application of an aflatoxigenic strain of Aspergillus flavuson the population of A. flavus infecting cotton bolls and on the aflatoxin content of cottonseed. Phytopathology 84.
- Kaaya AN, Warren HL, Kyamanywa S, Kyamuhan W (2005) The effect of delayed harvest on moisture content, insect damage moulds and aflatoxin contamination of maize in Mayuge district of Uganda. J Sci Food Agri 85: 2595-2599.
- Ranjit S (2013) HPLC method development and validation- an overview. Pharm Educ Res 4 : 26-33.
- Hong LS, Yusof NIM, Ling HM (2012) Determination of Aflatoxins B1 and B2 in Peanuts and Corn Based Products. Sains Malaysiana 39: 731-735.
- Muthusamy K, Arumugam K, Rethinasamy V, Srinivasan M, Thangamuthu J (2013) Occurrence of aflatoxin contamination in maize kernels and molecular characterization of the producing organism, Aspergillus. Afr J Biotech 12: 5839-5844.
- Onilude AA, Wakil SM, Odeniyi AO, Fawole O, Garuba et al. (2012) Distribution of aflatoxin and aflatoxigenic, and other toxigenic fungi in maize samples marketed in Ibadan, oyo state, Nigeria. EJEAFChe 11: 148-155.
- Wagacha JM, Muthomi JW (2008) Mycotoxin problem in Africa: current status, implications to food safety and health and possible management strategies. Int J Food Microbiol 124: 1-12.
- Khosrow C, Ehsan A, Ali M (2015) Aspergillus and Aflatoxin B1 Contamination of Stored Corn Grains in Western Iran. Global Veterinaria 14: 39-42.
- Food and Drug Administration (2011) A Guide for Grain Elevators, Feed Manufacturers, Grain Processors and Exporters. FDA Mycotoxin Regulatory Guidance, National Grain and Feed Association Washington D.C, USA.
- Mwihia JT, Straetmans M, Ibrahim A, Njau J, Muhenje O et al. (2008) Aflatoxin levels in locally grown maize from Makueni District, Kenya. East Afr Med J 85: 311-317.
- European Commission (2010) Commission Regulation (EU) No 165/2010 of 26 February 2010 amending Regulation (EC) No 1881/2006 setting maximum levels for certain contaminants in foodstuffs as regards Aflatoxins. European Commission Belgium.
- Chauhan NM, Washe AP, Minota T (2016) Fungal infection and aflatoxin contamination in maize collected from Gedeo zone, Ethiopia. Springerplus 5: 753.
- Benard OO, Hunja M, Isabel NW (2013) Isolation and characterisation of aflatoxigenic Aspergillusspecies from maize and soil samples from selected counties of Kenya. African journal of microbiology research 7: 4379-4388.
Citation: Assaye MA, Gemeda N, Weledesemayat GT (2016) Aspergillus species and Aflatoxin Contamination of Pre and Post- Harvest Maize Grain in West Gojam, Ethiopia. J Food Sci Nutr 2: 013.
Copyright: © 2016 Geremew Tassew weledesemayat, et al. This is an open-access article distributed under the terms of the Creative Commons Attribution License, which permits unrestricted use, distribution, and reproduction in any medium, provided the original author and source are credited.