Australian Milk Fat - Seasonal and Regional Composition of Fatty Acids
*Corresponding Author(s):
Amy LoganCsiro Agriculture And Food, 671 Sneydes Road, Werribee, Vic. 3030, Australia
Tel:+61 397313478,
Email:amy.logan@csiro.au
Abstract
Regional and seasonal differences in milk fat composition affect the human nutritional properties of milk. Milk from 19 bulk production sites across Australia were collected on a monthly basis for 2-years in 1994-1995 and analysed for Fatty Acid (FA) composition. Considerable site and seasonal differences were encountered with the analysis revealing clear seasonal variation in the abundance of short chain saturated FAs, the minor unsaturated FAs, C16:0, and the long chain unsaturated FAs. The magnitude of difference varied with geography, with generally less variation observed in the Queensland, New South Wales and South Australian regions. Positive correlations were measured between the short chain FAs from C4 to C14, diminishing with the increased difference in chain length. Correlations between saturated and mono-unsaturated FAs of the same chain length were mostly positive for C16 and C18 however generally not for C10 and C14, indicating fundamental differences in desaturase activities for different carbon chain lengths and between regions.
These results provide useful information that can be used by the Australian domestic and export dairy industry to understand and predict the effect of season and geographical location within Australia on the abundance of FAs of nutritional importance.
Keywords
Bovine; Desaturase activity; Fatty acid profile; Human nutrition; Milk fat
INTRODUCTION
The fatty acid (FA) composition and their position in the triacylglycerol structure influence physical and melting properties of milk fat. Moreover, both the major and minor FAs of milk fat are nutritionally important [1]. The major FAs in milk fat are palmitic (C16:0), stearic (C18:0) and oleic (C18:1) acid [2] and primarily govern the nutritional value associated with the lipid component, reflected in the food labelling of milk and dairy products. The mono-unsaturated C18:1 is generally regarded as a nutritionally desirable FA and the saturated C16:0 generally undesirable. However, a larger portion of the C16:0 in cow’s milk is esterified at the central carbon, or sn-2 position of the triacylglycerol structure [3,4] assisting in its absorption, compared to vegetable oils often used in infant formula preparations.. It is suggested that sn-2 C16:0 is important in infant nutrition and development, lowering calcium malabsorption and influencing bone density [5]. Milk fat also contains a considerable proportion of unique major and minor FAs. There are up to about 16% of short chain saturated (SC-S) FAs with a carbon length of 12 or less [6]. Although saturated, these FAs are metabolised by humans differently than the longer chain saturated (LC-S) FAs [7], absorbed directly from the intestine and oxidised in the liver. The LC-S, on the other hand, is not absorbed and instead contributes to adipose tissue formation. On a weight basis, SC-S also attributes considerably less energy than the long chain FAs and may prevent intestinal infections, particularly in children [7]. Some minor FAs may also exhibit physiologically beneficial qualities in the available quantities, such as some biologically formed trans FAs. Trans FAs from dairy sources differ from the trans FAs created during chemical partial hydrogenation, and historically present in margarines and cream style fillings [8]. The beneficial trans FAs include conjugated linoleic acid (CLA, cis-9-trans-11-linoleic acid), and believed to prevent the development of tumour cells and reduce plasma cholesterol level in animal models [9]. Other minor FAs include the odd chain FAs C15:0 and C17:0 and their branched anteiso(a) and iso(i) isomers which cannot be synthesised in the human body and are specific to ruminant fat sources. As such, levels of these FAs in human adipose tissue and serum are often used as biological markers for measuring milk fat consumption [1,10-12]. A higher content of C15:0 and C17:0 in human blood serum has been associated with a lower risk of a first myocardial infarction [12]. Moreover, a study has shown C17:0 to be associated with increased insulin sensitivity in overweight subjects with metabolic syndrome, and therefore may reduce risks associated with type 2 diabetes [13]. Their natural variation in milk fat could lead to compositional differences; hence differences in blood serum levels from patients eating a defined level of milk fat, and therefore influence the interpretation of these biological markers. For these reasons the breadth of natural variation of these FA markers in milk fat throughout a season would be of great interest to the dairy industry, consumers of dairy products and health professionals.
Milk fat is the most variable component of milk [14]. Considerable variations between and within countries, regions and season have been reported [4] with examples from France, Germany andthe United States.Other studies include those fromAustralia [15] and regions thereof [2,16,17], the Netherlands [18], New Zealand [19,20], Poland [21], France [22], England [23], Spain [24], China [25], and variations in Conjugated Linoleic Acid (CLA) across Europe [26]. In contrast, it was found that the FA composition of retail milk in the United States was remarkably consistent across geographic regions and seasons [27] likely due to the more consistent year-round farming practices employed.Very few of the surveys report compositions with monthly frequency and cover more than one year or a range of well identified diverse geographic and climatic milk production areas. In many regions and countries seasonal changes in Milk fat composition have been observed, which typically have been related to changing feed availability and composition and associated supplementary feeding,calving patterns and days in milk [4,19, 21-24,28].
This study examines trends in the FA composition of Milk fat collected on a monthly basis for a period of 2-year between 1994 and 1995. The samples were sourced from 19 bulk processing sites located across Australia, in broadly eight geographic regions. Confidentiality restrictions limited the scope for in-depth publications at the time of analysis [15], however the restrictions have since been lifted, and comprehensive reporting and a more meaningful interpretation of data is possible. This data-set is the first and only survey of milk fat collected from sites across all Australia states with significant dairy production, and provide an important benchmark for future studies. The geographical, climate and farming practices of the participating sites were reported in Versteeg et al., [29], which examine the milk fat melting properties.
MATERIALS AND METHODS
Sample sites, collection and preparation
Nineteen bulk milk collection sites (most of these were also dairy product manufacturing factories) from six Australian states and one experimental farm were surveyed across a 2-year period (1994-1995). The sampling sites, milk collection and preparation protocols are detailed in the preceding paper [29], together with the melting properties. The analysis reported herein was conducted at the time of sample collection.
Fatty acid analysis
The FA composition was determined by capillary gas chromatography. Fatty acid methyl esters were prepared according to the Bannon neutralisation method [30], using 0.95 mL of a 5% solution of Milk fat in petroleum spirits with 0.05 mL of 2 M methanolic KOH. After vigorously shaking and settling for 10 min, 0.5 µL of the top layer was injected on a 25 m polyamide fused silica capillary column (25QC2JBPX70 0.25, Scientific Glass Engineering, Australia) using a Varian 3400 Gas Chromatograph (Varian Australia Pty Ltd) with split/splitless injector and a Flame Ionisation Detector. Standard operating conditions included Helium as a carrier gas and makeup gas with a split ratio of 1/44, an injector temperature of 260 °C and a detector temperature of 300 °C. After injection, the column was held at 175 °C for 5 min, increased to 180 °C at a rate of 5 °Cmin-1, held for 5 min and then increased at a rate of 5 °Cmin-1 to 220 °C and held at that temperature for 10 min before cooling the column to starting conditions for 10 min. Peak areas were determined and calculations made with the aid of Varian DAPA StarTM software. Correction factors were determined using the Bureau of Community Reference (BCR) reference milk fat, CRM 164. The FA concentrations were expressed as percentage of the total normalised to 100%. After 9 months into the project and analyses of samples the method was slightly improved, enabling identification and integration of CLA as a separate peak from that point forward into the study.
Statistical methods
All statistical analyses were conducted using GenStat [31]. Samples were unavailable from some sites for some months; 12.3% of all site by year by month combinations. Statistical analyses of the FA composition were generally the same as those used for analysing solid fats, as reported earlier [29]. Box plots were prepared for each FA and group of FAs, all pair-wise correlations were calculated and their significances tested, non-orthogonal Linear Mixed Model (LMM) analyses were performed using residual maximum likelihood to provide estimates for each FA at each site of variability within months (combined sampling and analytical variability), and Bartlett’s tests of homogeneity of variation were performed for each component across the 20 sites to determine whether all measurements could be combined into a single statistical analysis. As in Versteeg et al., [29], the single herd research farm in Ellinbank, East Victoria was excluded from most of further analyses because of its atypical characteristics and responses.
Multi-Dimensional Scaling (MDS) analysis was performed with the similarity matrix calculated using the ‘city block’ metric, and non-metric MDS in 3 dimensions was chosen due to lower stress values [29]. However, for the FA analyses there were two steps of MDS required to reduce the 20 FAs x 19 sites to a meaningful subset of cases for presentation. Firstly, for each FA, means for each month over the 19 sites were calculated and an MDS performed to identify groups of FAs with similar response patterns over time. This resulted in the 20 FAs being placed in 7 groups. Secondly, using these 7 groups to represent the FA composition, the Aitchison distance between compositions [32] was calculated for each pair of sites at each of the 24 months and a mean distance over the 24 months was calculated. The mathematical details of these calculations are given in the supplementary information. An MDS was then performed on the similarity matrix of these mean distances to determine groupings of the sites.
RESULTS AND DISCUSSION
This examination demonstrates the effect of season and geographical region on the FA composition of milk fat, and its relation to the human nutritional properties. This analysis is preceded by an overview of FA composition across all samples, including correlations between FAs, and a discussion of the quality of results determined by variation between duplicate readings. With consideration to established pathways in Milk fat synthesis, and the significance of FAs in human nutrition, the individual FAs were combined into seven groups. To facilitate interpretation further, the 19 bulk collection sites were also grouped, based on similarities in response to seasonal factors. These distinct groupings were used to examine FA composition in relation to season and geography across the 2 year study, with a focus on CLA and differences in desaturase activity.
Overview of fatty acid composition
The range in values encountered for individual FAs across all sites (excluding site 16), are given in Table 1.Except where specifically mentioned, site 16 was excluded from analysis, as it was a single farm collection site which implemented experimental feeding regimes and farming protocol, and some extreme values were encountered. The values are somewhat different from a 1-year study of 11 Victorian bulk milk conducted 20 years earlier between October 1975 to September 1976,which found lower mean concentrations of C16:0 and higher levels for both C18:0 and C18:1 [16]. However, they are broadly similar to a 2001 survey of milk from cows grazing on natural pastures across15 farms in Northern Spain [24], and a 2008 survey of 56 milk processing plants in the USA [27]. An examination of FAs in 60 French butters from 1992 to 1995 showed similar mean values to that of this work for major FAs up to C14:0, however higher values for C16:0 and lower values for C18:0 and C18:1 [33]. Higher levels of C14:0 and C16:0 and lower C18:0 and C18:1 were found by Heck et al., [18] in 52 Dutch bulk milk samples collected in 2005 and 2006, along with lower levels of C4:0. Moreover, a Swedish survey [34] of seven dairies sampled on four occasions across 2001 showed similar mean values for most FAs except C16:0, which were higher than that reported herein, and a 2011 survey of dairy farms across China [24] found lower levels of C4:0, higher levels of C16:0 and similar levels of other major FAs. Overall, with some notable exceptions, the mean values for major FAs in our survey tended to be higher for C4:0, C18:0 and C18:1 and lower for C14:0 and C16:0 than found in most other surveys (Table 1).
|
Min |
Mean |
Median |
Max |
SD |
CV |
Range (%) |
|||||||
|
FA |
|
|
|
|
|
|
|
||||||
|
C4:0 |
3.63 |
4.40 |
4.39 |
5.24 |
0.29 |
6.60 |
37 |
||||||
|
C6:0 |
1.92 |
2.41 |
2.41 |
2.93 |
0.18 |
7.44 |
42 |
||||||
|
C8:0 |
1.00 |
1.35 |
1.34 |
1.77 |
0.13 |
9.84 |
57 |
||||||
|
C10:0 |
1.97 |
2.88 |
2.83 |
4.06 |
0.37 |
12.70 |
73 |
||||||
|
C10:1 |
0.18 |
0.27 |
0.27 |
0.43 |
0.03 |
12.31 |
92 |
||||||
|
C12:0 |
1.68 |
3.17 |
3.12 |
4.51 |
0.40 |
12.60 |
89 |
||||||
|
C14:0 |
7.61 |
10.34 |
10.34 |
12.02 |
0.72 |
6.93 |
43 |
||||||
|
C14:1 |
0.59 |
0.98 |
0.98 |
1.38 |
0.15 |
15.79 |
81 |
||||||
|
C15:0i+a |
0.57 |
0.87 |
0.88 |
1.11 |
0.09 |
10.68 |
61 |
||||||
|
C15:0 |
0.76 |
1.06 |
1.06 |
1.32 |
0.10 |
9.07 |
53 |
||||||
|
C16:0 |
23.44 |
27.96 |
28.04 |
34.22 |
1.98 |
7.07 |
39 |
||||||
|
C16:1 |
1.16 |
1.51 |
1.47 |
2.14 |
0.20 |
13.26 |
65 |
||||||
|
C17:0a |
0.30 |
0.40 |
0.40 |
0.60 |
0.03 |
8.52 |
77 |
||||||
|
C17:0i |
0.38 |
0.49 |
0.49 |
0.60 |
0.04 |
8.15 |
45 |
||||||
|
C17:0 |
0.47 |
0.62 |
0.62 |
0.86 |
0.06 |
9.37 |
62 |
||||||
|
C17:1 |
0.16 |
0.31 |
0.30 |
0.59 |
0.06 |
18.03 |
142 |
||||||
|
C18:0 |
8.43 |
11.59 |
11.59 |
15.23 |
1.06 |
9.11 |
59 |
||||||
|
C18:1 |
18.39 |
23.64 |
23.59 |
29.81 |
1.88 |
7.94 |
48 |
||||||
|
C18:2 |
0.23 |
1.46 |
1.38 |
2.91 |
0.40 |
27.05 |
184 |
||||||
|
C18:3 |
0.00 |
0.67 |
0.68 |
1.04 |
0.15 |
22.79 |
156 |
||||||
|
CLA? |
0.55 |
1.21 |
1.20 |
1.90 |
0.25 |
20.55 |
113 |
||||||
|
Others |
0.38 |
2.45 |
2.52 |
5.01 |
0.62 |
25.33 |
189 |
||||||
|
FA Groupings |
|||||||||||||
|
SC-S |
10.98 |
14.20 |
14.09 |
18.19 |
1.22 |
8.59 |
51 |
||||||
|
MC-S |
9.20 |
12.27 |
12.31 |
14.21 |
0.85 |
6.93 |
41 |
||||||
|
C16:0 |
23.44 |
27.96 |
28.04 |
34.22 |
1.98 |
7.07 |
39 |
||||||
|
C17:0 isomers |
1.26 |
1.51 |
1.50 |
1.82 |
0.10 |
6.43 |
37 |
||||||
|
m-U |
2.17 |
3.06 |
3.00 |
4.31 |
0.36 |
11.87 |
70 |
||||||
|
C18:0 |
8.43 |
11.59 |
11.59 |
15.23 |
1.06 |
9.11 |
59 |
||||||
|
LC-U |
19.71 |
25.77 |
25.70 |
33.08 |
2.04 |
7.91 |
52 |
||||||
Table 1: Fatty Acid (FA) compositions (g/100 g FA) over the 2-yearsof samples (n=796) from the bulk milk production sites (n=19).
i = iso
a = anteiso
CLA = conjugated linoleic acid
SC-S = short chain saturated fatty acids = C4:0 + C6:0 + C8:0 + C10:0 + C12:0
MC-S = medium chain saturated fatty acids = C14:0 + C15:0 i and a + C15:0
C17:0 isomers = C17:0-antiso + C17:0-iso + C17:0
m-U =minor unsaturated fatty acids = C10:1 + C14:1 + C16:1 + C17:1
LC-U =long chain unsaturated fatty acids = C18:1 + C18:2 + C18:3
?The abundance for CLA available only or the last 16 months of the 2-year survey
Correlations between individual fatty acids
The complete correlation matrix of all FAs from all samples combined is provided in the supplementary information (Table S1). Figure 1 shows the correlation between the SC-SFAs (C4:0-C14:0) of all samples. SC-S are derived from carbohydrates in the diet, transformed to volatile FAs in the rumen, transported to the mammary gland and synthesised by a process of chain elongation catalyses by FA synthase [35,36]. All were positively correlated to one another (p<0.01) and highly correlated between C6:0 to C14:0. The positive correlation between C4:0 and other FAs rapidly declined with an increase in chain length, however remained significant due to the large number of samples examined in this work (n=834).A similar pattern was evident for most individual sites, with significant positive correlations between FAs of the range C4:0 to C10:0. This pattern was less evident for C12:0, and present for only about half of the sites for C14:0, including none of the three Tasmanian sites (5, 6 and 7). The results for site 7 are shown in Figure 2. Site 13 in northern Victoria was the notable exception, where C4:0 was not significantly correlated with any other SC-S except for C6:0 (results not shown). Although other factors may be involved, it is noted that, on average, this site experienced one of the lowest maximum daily temperature and the lowest minimum daily temperatures of all sites [29].
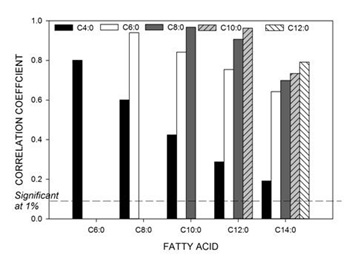 Figure 1: Correlation coefficient between short chain fatty acids (C4:0 – C14:0) for all samples and across all sites (n=834).
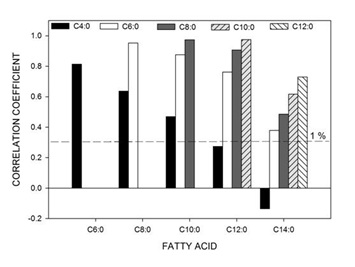 Figure 2: Correlation coefficient between short chain fatty acids (C4:0 – C14:0) for all samples from site 7 (Tasmania) (n=24).
Variability between duplicates
Variability between duplicate readings (collected from two separate samples taken sequentially at different times on the same or next day) within months was estimated from the separate REML analyses performed for each site. The variability was different from site to site, highly significant for C4:0 (p<0.003) and even more so (p<0.001) for all other FAs (results not shown).The coefficients of variation (CV, %) for C16:0 and C18:0 and the FA groupings (derived and discussed in the next section) are shown in table 2, representing a combination of the duplicate sample and analytical variation. The CV between duplicate ‘within month’ readings was 2.8% on average, with the lowest value for Long Chain Unsaturated (LC-U) at site 5 in Tasmania and C16:0 at site 19 in Western Australia (both 0.8%) and the highest for CLA at sites 3 in Queensland and 18 in Western Australia (both 9.7%). Overall, the duplicate sample variation for all FA’s was the lowest for site 5 (1.2%) and highest for site 16 (the experimental farm) in eastern Victoria (5.7%). The same sample reproducibility reported by others is about 2% [33], indicating a high level of reproducibility in the current work as it includes within month sample variation as well.
|
Site |
Region |
SC-S |
MC-S |
C16:0 |
C17:0 isomers |
m-U |
C18:0 |
LC-U |
CLA? |
Mean‡ |
|
1 |
Central NSW |
2.7 |
2.6 |
2.1 |
2.6 |
2.5 |
3.9 |
3.3 |
3.4 |
2.8 |
|
2 |
South East Queensland |
2.7 |
1.6 |
1.2 |
2.0 |
2.7 |
1.8 |
1.5 |
4.0 |
1.7 |
|
3 |
4.7 |
3.0 |
1.6 |
3.8 |
3.1 |
4.4 |
2.6 |
9.7 |
3.0 |
|
|
4 |
South Australia |
4.8 |
3.3 |
1.7 |
2.8 |
3.7 |
5.0 |
3.7 |
5.2 |
3.4 |
|
5 |
Tasmania |
2.3 |
1.0 |
0.9 |
1.6 |
1.8 |
1.8 |
0.8 |
1.0 |
1.2 |
|
6 |
3.2 |
1.7 |
1.2 |
2.0 |
2.0 |
2.3 |
1.9 |
4.2 |
2.0 |
|
|
7 |
2.5 |
1.9 |
2.0 |
1.9 |
3.0 |
2.7 |
3.1 |
2.9 |
2.5 |
|
|
8 |
West Victoria |
3.0 |
1.5 |
1.3 |
1.9 |
4.0 |
1.7 |
1.7 |
2.8 |
1.9 |
|
9 |
4.3 |
2.0 |
1.1 |
1.9 |
3.1 |
2.6 |
2.0 |
3.6 |
2.2 |
|
|
10 |
4.3 |
2.0 |
1.0 |
2.8 |
2.5 |
2.4 |
2.1 |
5.2 |
2.2 |
|
|
11 |
North Victoria |
5.6 |
3.1 |
2.2 |
3.1 |
3.5 |
5.6 |
3.9 |
8.7 |
3.8 |
|
12 |
4.1 |
2.3 |
1.0 |
2.2 |
2.3 |
2.7 |
2.5 |
5.3 |
2.3 |
|
|
13 |
2.9 |
2.0 |
1.4 |
3.3 |
2.7 |
1.8 |
2.0 |
2.4 |
2.0 |
|
|
14 |
East Victoria |
4.4 |
2.7 |
1.4 |
2.6 |
3.5 |
4.1 |
2.6 |
4.5 |
2.8 |
|
15 |
5.0 |
3.8 |
4.4 |
3.8 |
5.2 |
4.8 |
4.6 |
7.1 |
4.5 |
|
|
16 |
7.1 |
4.5 |
3.6 |
6.1 |
6.0 |
5.4 |
8.2 |
9.1 |
5.7 |
|
|
17 |
4.1 |
1.3 |
1.5 |
1.9 |
2.8 |
2.1 |
1.7 |
2.8 |
2.1 |
|
|
18 |
South west WA |
4.1 |
2.2 |
1.8 |
2.8 |
2.4 |
3.2 |
3.1 |
9.7 |
2.8 |
|
19 |
5.1 |
2.3 |
0.8 |
2.2 |
2.7 |
3.1 |
2.6 |
4.6 |
2.5 |
|
|
20 |
4.9 |
5.1 |
2.5 |
4.3 |
5.3 |
4.9 |
4.1 |
9.1 |
4.1 |
|
|
|
Mean |
4.1 |
2.5 |
1.7 |
2.8 |
3.2 |
3.3 |
2.9 |
5.3 |
2.8 |
Table 2: Within month coefficient of variation (%) of concentrations of fatty acids (FAs) C16:0, C18:0, CLA and FA groupings, derived from the within month variance components from the linear mixed models.
NSW = New South Wales
WA = Western Australia
SC-S = short chain saturated fatty acids = C4:0 + C6:0 + C8:0 + C10:0 + C12:0
MC-S = medium chain saturated fatty acids = C14:0 + C15:0 i and a + C15:0
C17:0 isomers = C17: 0-antiso + C17:0-iso + C17:0
m-U =minor unsaturated fatty acids = C10:1 + C14:1 + C16:1 + C17:1
LC-U =long chain unsaturated fatty acids = C18:1 + C18:2 + C18:3
CLA = conjugated linoleic acid
? The abundance for CLA available only or the last 16 months of the 2-year survey
‡ Weighted mean of 8 FAs and FA groups, with weights being the percentages in the composition
Grouping of fatty acids
Using MDS and a number of other considerations we grouped the FAs. The MDS of the mean FA compositions showed discernible grouping patterns based on changes over the 24 months of the survey over all sites (Figure 3). When using just two dimensions, stress factors were over 0.11, indicating poor ordination (MDS not shown). However non-linear three-dimensional scaling gave a stress factor of 0.054, where values below 0.1 are considered to provide good ordination [37,38].
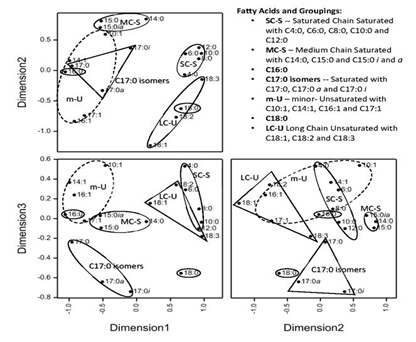 Figure 3: Non-metric multidimensional scaling of fatty acids for monthly means from the 19 bulk milk collection sites (n=401 compositions, stress=0.0546).
The proximity of FAs to each other within the MDS provides insights to which FAs have similar pathway and/or origins in feed. Most clusters were expected, such as the SC-S FAs(C4:0 to C12:0), which are produced through a process of de novo synthesis in the mammary gland [39] and consequently tightly grouped together in dimension 1 and 2, with the separation distance only increasing in dimension three (Figure 3). Although C14:0 is also synthesised in the mammary gland, it can proceed via different pathways [40] and was quite separate from the other SC-S FAs shown in the MDS. This agrees with the poor correlation between C4:0 and C14:0 for several sites, as shown for site 7 (Figure 2). The odd linear chain FA C15:0 was close to the branched FAs C15:0 (i and a) and clustered together with C14:0 as saturated medium chain (MC-S) FAs. The C17:0 linear chain was also close to the branched C17:0i and C17:0a, yet separate to the MC-S cluster indicating that different factors affect the proportions of C15:0 and C17:0 branched FAs in Australian milk fat production. Odd and branched FAs have been associated with the proportion and source of forage in the diet and are a potential diagnostic tool in rumen function [41]. However, the MDS using Multivariate Factor Analyses, Mele et al. [35] reported somewhat different associations for FAs with specific factors; for example C4:0, C6:0 and C8:0 contributed significantly to their ‘short chain FA factor’ and C8:0, C10:0, C12:0 and C14:0 contributed to a different ‘de novo FA factor’. Mele et al., [36] also reported differing factors for the branched and linear odd chain FAs, whereas in our results the saturated branched and linear odd FAs grouped together by the number of carbon atoms, i.e. either C15:0 or C17:0., regardless of any branching.
To facilitate the interpretation of the large data set, we grouped the FAs reported in this study into seven groups (Table 3) using the MDS patterns shown in figure 3 as the primary guide, and, also taking into consideration correlations and established animal physiology and human nutritional factors [4,7,14,48].
|
Group |
FAs |
Factors for individual or grouping |
|
SC-S |
C4:0, C6:0, C8:0, C10:0, C12:0 |
Grouped well in MDS (Figure 3) i.e. highly correlated; produced in the mammary gland [14]; metabolised differently in human body than longer chain FA [42]. |
|
MC-S |
C14:0, C15:0i and a, C15:0 |
Grouped well in MDS (Figure 3), i.e. highly correlated; The C15:0 isomers are synthesised through bacterial flora in the rumen [43]. C15:0 is a biological marker of dairy fat intake and other ruminal animal fat in human nutrition [1,11] as is C14:0 [10] and branched FA’s have anti-carcinogenic activities [44]. |
|
Palmitic acid |
C16:0 |
Although this fatty acid appeared to be associated with the Minor Unsaturated fatty acids (m-U) in the MDS it was kept separately as it is saturated and a Major FA; origin from feed or synthesised in the mammary gland, proportion depending on dietary fat intake, stage of lactation, energy balance and stored fat [14]. |
|
C17:0 isomers |
C17:0a, C17:0i, C17:0 |
Grouped well in MDS (Figure 3) i.e. highly correlated; are biomarkers for milk fat and other ruminant animal fat in human nutrition [1]; Branched FAs have additional benefits [7]. |
|
m-U |
C10:1, C14:1, C16:1, C17:1 |
Broadly associated in MDS in MDS (Figure 3). Relatively low levels of each; all require desaturase activity [14,18]; Mono-unsaturated FA’s are generally considered desirable in human nutrition [45-47]. |
|
Stearic acid |
C18:0 |
Major saturated FA; derived from the adipose tissue and diet [14]; did not group well with other long chain FA’s in MDS (Figure 3). |
|
LC-U |
C18:1, C18:2 C18:3 |
Grouped well in MDS (Figure 3) i.e. highly correlated; derived from the diet and adipose tissue followed by desaturation in the mammary gland, are considered desirable in human nutrition [45-47]. |
Table 3: Fatty Acid (FA) groupings with rationale used in this study.The box plots in figure 4 present the site variation found within each of the selected FA groupings and individual FAs (C16:0, C18:0 and CLA), across sites. Site 20 stood out as the most different compared to other sites (lowest extreme and/or median concentration for SC-S, MC-S and C16:0, and highest for C18:0 and LC-U), as well as site 16 (lowest in C18:0 and LCU, and highest in C16:0). Correlations between the concentrations of FA’s and groupings are shown in figure 5, which shows that C18:0 and the LC-U’s are highly positively correlated, but negatively correlated with all other FA’s and groupings, which will be discussed further in the section on seasonal and regional differences.
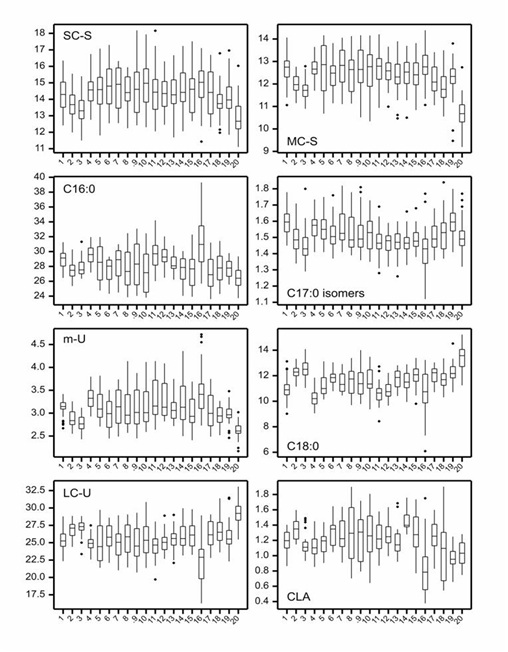 Figure 4: Box plots indicating the spread in fatty acid (FA) composition (wt %) for each site (1-20, x axis) within the study, for; short chain saturated FAs (SC-S), medium chain saturated FAs (MC-S), C16:0, C17:0 isomers, minor unsaturated FAs (m-U), C18:0, long chain unsaturated FAs (LC-U) and Conjugated Acid (CLA).
Note: The median value is represented by the horizontal line in the middle of the box. The lower and upper quartiles are represented by the lower and upper boundaries of the box, and the minima and maxima are represented by the most extreme points or the ends of the extended lines.
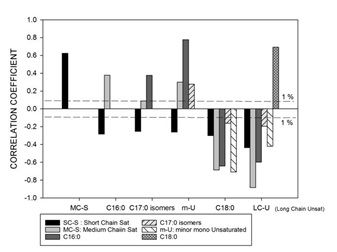 Figure 5: Correlation coefficients between the fatty acid groups; short chain saturated FAs (SC-S), medium chain saturated FAs (MC-S), C16:0, C17:0 isomers, minor unsaturated FAs (m-U), C18:0 and long chain unsaturated FAs (LC-U) for all samples from the 19 bulk milk production sites (n = 794).
Regional groupings for similarities in fatty acids
An MDS (Figure 6), based on compositions across the seven major FA groups (Table 3),was performed to group sites with similar seasonal patterns. In most cases, sites grouped together according to their geographical locations, however in some cases similarities were noted between distant sites. In our previous publication [29], five largely regional groupings (A-E) were determined based on the melting properties. However, the same groupings did not carry over fully to the current MDS analysis for FA composition, with greater differences observed within some regions, resulting in seven distinct groupings instead of five. The groups of western Victoria (group B), northern Victoria (group C) and the combination of sites in eastern Victoria with Tasmania (group D) remained the same as those determined for the melting properties. However the characteristics of the original group A, consisting of central New South Wales (site 1), Queensland (site 2 and 3) and South Australia (site 4), and that of Group E, consisting of the three Western Australian sites (sites 18-20), were broken down further as follows: The New South Wales and South Australian sites associated closely and grouped separately (group A1) from the two Queensland sites (group A2). For Western Australia, sites 18 and 19 (E1) diverge from processing site 20 (E2), which, although located more north in the state, obtained its milk supplies from areas further south, including Albany [49]. These seven groupings were supported by the FA box plots (Figure 4), where site 1 and 4 showed different patterns from sites 2 and 3, and site 20 proved different from site 18 and 19 (and often every other site) for most FA groupings.
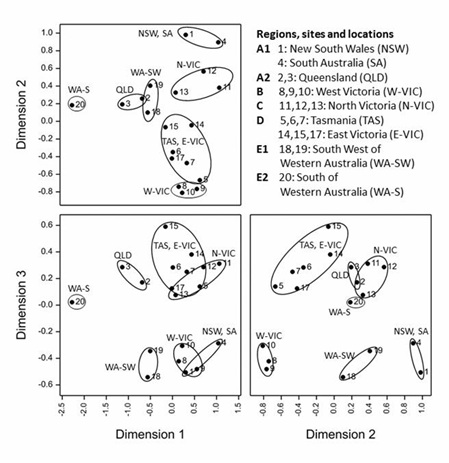 Figure 6: Non-metric multidimensional scaling of the 19 bulk milk production sites derived from similarities calculated as mean distances between compositions over the 2-year study using the FA groups outlined in Table 3 (n = 401 compositions, stress = 0.0502).
Regional differences in fatty acids and seasonal changes
Timelines of the monthly average values of each region for each of the FA groupings are shown in figures 7.1-7.7. Additionally, the results for CLA are plotted in figure 7.8. Figure 7.1Figure 7.2Figure 7.3Figure 7.4Figure 7.5Figure 7.6Figure 7.7Figure 7.8
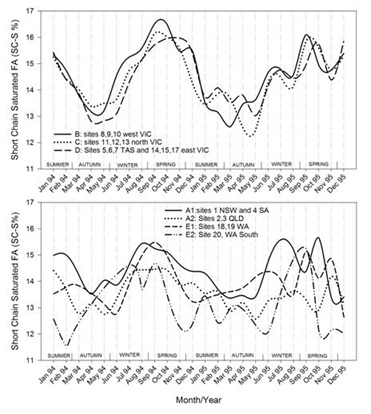
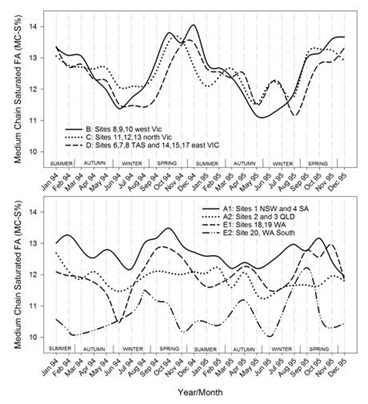
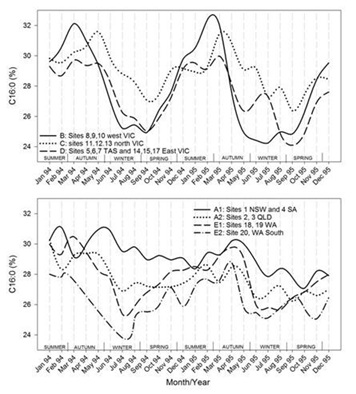
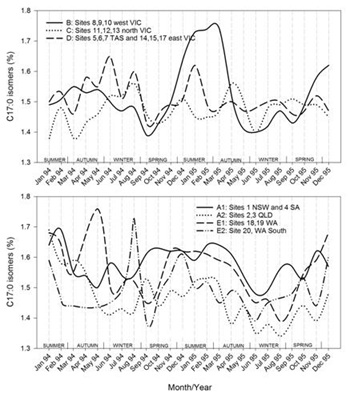
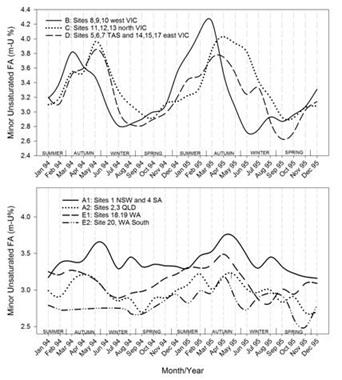
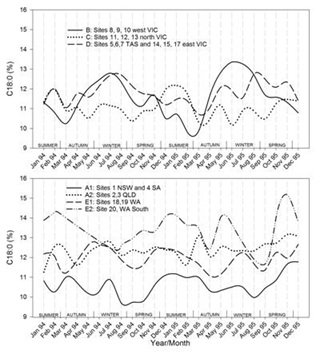
Figures 7.1-7.8: The change in fatty acid (FA) composition over the2-year study for each site grouping; (1) short chain saturated FAs (SC-S), (2) medium chain saturated FAs (MC-S), (3) C16:0, (4) C17:0 isomers, (5) minor unsaturated FAs (m-U), (6) C18:0, (7) long chain unsaturated FAs (LC-U) and (8) conjugated acid (CLA).
Note: The average standard errors of means at each month for site groupings A1, A2, B, C, D, E1, and the standard errors of means at each month for site 20 (E2), are: SC-S: 0.25, 0.45; MC-S: 0.13, 0.39; C16:0: 0.20, 0.47; C17:0 isomers: 0.018, 0.046; m-U: 0.040, 0.099; C18:0: 0.17, 0.47; LC-U: 0.31, 0.86; CLA: 0.030, 0.067, respectively.
Short Chain Saturated (SC-S)
For the three Victorian and Tasmanian regions there are clear seasonal patterns with the SC-S FAs ranging between about 12.5% (March to May) and 16.5% (August to December). Regions differ in timing, with levels of SC-S in western Victoria (B) milk rising about a month ahead of the other 2 regions in the north (C) and east region of Victoria, combined with Tasmania (D). This is consistent with the regional farming data, where western Victoria exhibited the maximum milk production in November (approximately one month earlier than other regions), and the minimum milk production in April-May (2 months ahead) [28]. The de-novo synthesis of FAs (C6:0 to C14:0 and also part of C16:0) increases the first few months of lactation [14]. This typically occurs between July and September in the southern parts of Australia where cows are calved on a seasonal basis. Similar patterns have been observed in New Zealand where seasonal calving is also practiced, with higher levels of C10:0 and C12:0 between September and December and minimum levels between March and June [20]. In contrast, the sites located in all other states moved over narrower ranges in SC-S, with less distinct and inconsistent seasonal patterns. The sites in Queensland (A2) consistently exhibited lower concentrations over nearly all months of the survey compared to New South Wales with South Australia (A1). This is consistent with the milk production volumes being constant over the year in both Queensland and New South Wales, with year-round supplementary feeding. In Western Australia greater variation was observed for site 20 (E2) than the other region in (E1), which had the least variation of all regions in the survey. The lowest proportions of the SC-S were encountered in Nov/Dec to March, which also coincided with the months of the lowest milk production [29].
Medium Chain Saturated (MC-S)
Seasonal variation was observed for MC-S across the three Victorian and Tasmanian regions, but not as clearly defined as SC-S, ranging between 11 and 14 %.The lowest levels were found between May to August and the highest levels from September to February. While these trends were like SC-S, the low and high points were deferred by a few months. The main FA in this group is C14:0, which is also like the SC-S FAs derived from de novo synthesis through chain elongation. Although generally highly correlated (Figures 2 and 5), the elongation to C14:0 appears to be relatively stronger later in the milk production season. North Victoria (C) had the least variation and west Victoria (B) the broadest highs, rising about a month ahead of east Victoria and Tasmania. Of the site groupings in the other states, Queensland (A2) and New South Wales with South Australia (A1) had little variation, varying by only around 1% in total concentration over the 2 years, with regional group A2 consistently about 1% lower than A1. Site 20 (E2) in Western Australia stood out with the lowest levels of MC-S, typically 2% lower than any other region. Often, lower concentrations in site 20 coincided with higher concentrations in most of the other regions, which in the case of the Victorian and Tasmanian sites may be caused by the opposite in seasonal production and/or rainfall patterns and pasture availability [29]. The information available for farming practices are insufficiently detailed to provide possible explanations for the distinct differences within Western Australia.
Palmitic acid (C16:0)
The clearest seasonal pattern was found in group B (west Victoria) with concentrations ranging between ~24% in July and 32% around February/March, thus largely opposite to the occurrence of SC-S. Most other regions also show a distinct seasonal variation, again the exceptions being group A1 (New South Wales and South Australia) and A2 (Queensland), which appear to be generally trending downwards over the 2 years. A similar downward trend was observed in the solid fat contents, particularly at 5 °C [50]. The variation observed in north Victoria (group C) and east Victoria with Tasmania (group D) was less than in west Victoria (group B). Group C had its highs and lows about 2 months later than Group B, whereas Group D moved roughly in line with Group B, with the exception that the second year’s low occurred about 2 months later in the year. In Western Australia, both groups E1 and E2 displayed a seasonal variation in C16:0 content, with E2 usually having lower levels than E1. It is noted that the lows in C16:0 in Western Australia (E1 and E2) were around the same time (July) as in western Victoria (group B), as were the highs in the first year (February/March). However, the highs in the second year occurred later in the year, around April, highlighting a between year difference.C16:0 is derived both from de novo synthesis in the mammary gland and from the diet, the proportions of which may depend on rumen pH and the presence or absence of precursors and inhibitors of de novo synthesis in the cows feed [51]. When dietary fat intake is low, nearly all C16:0 is synthesised de novo in the mammary tissue. However, de novo synthesis decreases to less than 30% of the total C16:0 productions when fat intake is high [14]. It was calculated from data in 28 papers that C16:0 content of milk was negatively related to the level of total and unsaturated FAs absorbed from the diet [52]. For regions B, C and D here is a striking resemblance between the C16:0 content and the graphs for solid fat contents, particularly at 5 oC [50]. Similarities in patterns between C16:0 and solid fat contents can also be observed for in Western Australia (E).
C17:0 isomers
This group of C17:0 odd linear and branched chain FAs is largely derived from rumen bacteria and from de novo synthesis in the mammary gland, particularly the linear odd chain FAs as reviewed by Vlaeminck et al. [41]. Changes in concentrations of odd and branched chain FAs reflect changes in the ruminal flora and potentially synthesis in the mammary gland from propionyl-CoA instead of acetyl-CoA. In our results, the odd and branched chain FAs with the same number of carbons moves together (Figure 3). This probably means that most of the seasonal variations come from changes in the abundance of specific ruminal flora [41] and not from de novo synthesis in the mammary glands. The changes in composition of linear C15:0 and C17:0 would otherwise be more aligned, and independent of their branched isomers. The group of straight and branched C17:0 FAs (when averaged by regions) moved in a range between about 1.35 and 1.75 % (Figure 7, C17:0 isomers). Group B (sites in western Victoria) showed a clear seasonal pattern with a broad high between November and March. Groups C and D (made up of the other Victorian and Tasmanian sites) had much less or no clear seasonal variation. The broad high in western Victoria likely reflects the varying feed quality in the mainly non-irrigated and rain fed pastures and the senescence of pasture in summer [29], whereas less rainfall, higher temperatures and a greater occurrence of irrigation and the supplementary feeding in northern Victoria led to reduced seasonal variation. In contrast, Tasmania experienced cooler summer temperatures and eastern Victoria received more rainfall. This provided conditions for higher levels of pasture growth over the summer months compared to the other Victorian regions [29]. Of the sites in the other states, the Western Australian sites (E1 and E2) showed most variation, with at times relatively large differences within the state. The Queensland sites (sites 2 and 3, group A2) generally had the lowest concentrations of the 17:0 odd and branched acids, which is consistent with the high use of supplementary feeding [29].The C15:0 and C17:0 ruminant specific FAs in human blood serum have been investigated as biomarkers for dairy product consumption in several studies [11,12,53]. Generally, higher dairy product consumption was found to be associated with lower blood pressures, decreased risk of developing metaboli
CONCLUSION
Regional and seasonal differences in milk fat composition will affect the human nutritional properties of milk, and should be considered when consumption measures for dairy-based products are based on the abundance of such FAs. For example, the results show that CLA can vary by more than a factor of two, and levels of the C17:0 isomers often used by blood serum measurements to estimate dairy product consumption, varied up to 30% depending on the source and season. Overall, considerable differences in FA compositions were found between regions or site groupings across the milking season. Based on their seasonal behaviour patterns groupings of FAs were evident, and largely in line with the literature of established animal physiology and the associated source of FAs in milk. However, there were some notable exceptions; for example, C14:0 did not respond in line with the other SC-SFAs from de novo synthesis. Also, the odd chain and branched chain FAs C15:0 and C17:0 grouped with the FAs of same carbon number but not with each other as may be expected from changing ruminal activities. These differences indicate potential points for further investigation into the mechanisms involved. Large seasonal variation occurred for the short chain FAs, C16:0, CLA and the minor and LC-U FAs in Victoria and Tasmania. To a lesser extent, seasonal variation was also noted for C18:0 and the C17:0 isomers. Consistently lower saturated and unsaturated C18 FAs were measured in milk from New South Wales and South Australia, and higher C18 FAs in one site in Western Australia. The results show that animal nutrition effects override the influence of seasonal lactation and that desaturase activities varied by FA, region and season. The activities for C10:1 and C14:1desaturase were most variable but remained synchronised, indicating that the same enzyme system was involved for both, yet different from C16:1 and C18:1 which also differed from each other. This disagrees with what has been reported in the literature. As expected, there was a high correlation between the abundance of C18:0 and C18:1 for all sites except for Northern Victoria.
The number of dairy farms across Australia has reduced considerably over past decades (21,994 in 1979-80 to 5,789 in 2017), leading to more intensive and larger scale operations. Although there is now a greater reliance upon supplemental feeding along with pasture and total mixed rations [60], changes to farming practices across Australia are limited in several regions, for example, in parts of Queensland, New South Wales and Eastern Victoria. This means that the data collected in this expansive1994-95 Australia-wide survey still has great relevance to the Australian dairy industry and provide an important reference point for future studies. Furthermore, the large and beneficial difference in FA composition of some sites, such as site 20 in Western Australia for unsaturated FAs or the abundance of CLA in several sites, provide clues for future achievable large scale interventions.
ACKNOWLEDGEMENTS
We gratefully acknowledge Dairy Australia and the Department of Economic Development, Jobs, Transport and Resources, Victoria for their financial support. We would also like to acknowledge the project team members including Josie Accardi, Mark Alexander, Anne Birkett, Kym Butler, Gail DiGregorio, Stephen Dungey, Fiona Leach, Margaret Papalois, John Reynolds, Michelle Rowney, Lynne Thomas and Yolande Yep for their contributions to the original survey work. Furthermore the diligent collection and provision of samples and additional data from the factory and field staff of the following companies and their predecessors (with current or historic production sites): Murray Goulburn Co-operative Ltd (Koroit, Rochester, Cobram, Kiewa, Maffra, Leongatha);Fonterra Australia (Drouin, Devonport, Legerwood, Wynyard); Lions Pty Ltd (Gloucester, Margaret River, Harvey, Bentley and Simpson); Warrnambool Cheese and Butter (Allansford); Parmalat Australia (Nambour and Monto), United Dairy Power (Murray Bridge) and the Department of Economic Development, Jobs, Transport and Resources, Victoria (Ellinbank)were instrumental for the completion of this project. Alec Zwart from CSIRO Data 61 for statistical advice and Doug Eddy of the Dairy Industry Association of Victoria for his support to mine and publish the survey data in detail. Last but not least, we wish to thank Peter Parodi for his great advice and many insights regarding milk fat composition and its significance over many years.
CONFLICT OF INTEREST
The authors declare no conflicts of interest.
REFERENCES
- German JB, Dillard CJ (2006) Composition, structure and absorption of milk lipids: a source of energy, fat-soluble nutrients and bioactive molecules. Crit Rev Food Sci Nutr 46: 57-92.
- Walker GP, Wijesundera C, Dunshea FR, Doyle PT (2013) Seasonal and stage of lactation effects on milk fat composition in northern Victoria. Animal Production Science 53: 560-572.
- Freeman CP, Jack EL, Smith LM (1965) Intramolecular Fatty Acid Distribution in the Milk Fat Triglycerides of Several Species. J Dairy Sci 48: 853-858.
- Jensen RG (2002) The composition of bovine lipids: January 1995 to December 2000. J Dairy Sci 85: 295-350.
- Innis SM (2016) Palmitic Acid in Early Human Development. Crit Rev Food Sci Nutr 56: 1952-1959.
- MacGibbon AKH, Taylor MW (2006) Composition and Structure of Bovine Milk Lipids. In: Fox PF, McSweeney PLH (eds.). Advanced Dairy Chemistry 2: 1-42.
- Parodi PW (2009) Milk Fat Nutrition. In: Tamime AY (eds.). Dairy Fats and Related Products. Wiley-Blackwell, Chichester, United Kingdom.
- Logan A, Wijesundera C (2014) Trans fat replacement solutions in Australia and New Zealand. In: Kodali DR (eds.). Trans Fats Replacement Solutions. Elsevier Pg no: 399-417.
- MacDonald HB (2000) Conjugated linoleic acid and disease prevention: a review of current knowledge. J Am Coll Nutr 19: 111-118.
- Wolk A, Vessby B, Ljung H, Barrefors P (1998) Evaluation of a biological marker of dairy fat intake. Am J Clin Nutr 68: 291-295.
- Smedman AE, Gustafsson IB, Berglund LG, Vessby BO (1999) Pentadecanoic acid in serum as a marker for intake of milk fat: Relations between intake of milk fat and metabolic risk factors. Am J Clin Nutr. 69: 22-29.
- Warensjo E, Jansson JH, Cederholm T, Boman K, Eliasson M, et al. (2010) Biomarkers of milk fat and the risk of myocardial infarction in men and women: a prospective, matched case-control study. Am J Clin Nutr 92: 194-202.
- Nestel PJ, Straznicky N, Mellett NA, Wong G, De Souza DP, et al. (2014) Specific plasma lipid classes and phospholipid fatty acids indicative of dairy food consumption associate with insulin sensitivity. Am J Clin Nutr 99: 46-53.
- Palmquist DL (2006) Milk fat: Origin of fatty acids and influence of nutritional factors thereon. Advanced Dairy Chemistry Volume 2 Lipids , Springer, New York, USA.
- Thomas L, Rowney M (1996) Australian Milk fat survey--fatty acid composition. Australian Journal of Dairy Technology 51: 112-114.
- Knightbridge JP, Black RG (1995) The variation in firmness of Victorian butters. Australian Journal of Dairy Technology 33: 14-18.
- Black RG (1985) Fatty acid composition of Victorian milk fat. The Dairy Technologist. Gilbert Chandler Institute of Dairy Technology: 48-52.
- Heck JM, van Valenberg HJ, Dijkstra J, van Hooijdonk AC (2009) Seasonal variation in the Dutch bovine raw milk composition. J Dairy Sci 92: 4745-4755.
- Gray IK (1973) Seasonal variations in the composition and thermal properties of New Zealand milk fat: I. Fatty-acid composition. Journal of Dairy Research 46: 207-214.
- Auldist MJ, Walsh BJ, Thomson NA (1998) Seasonal and lactational influences on bovine milk composition in New Zealand. J Dairy Res 65: 401-411.
- Rutkowska J, Adamska A, Bialek M (2012) Fatty acid profile of the milk of cows reared in the mountain region of Poland. J Dairy Res 79: 469-476.
- Ledoux M, Chardigny JM, Darbois M, Soustre Y, Sebedio JL, et al. (2005) Fatty acid composition of French butters, with special emphasis on Conjugated Linoleic Acid (CLA) isomers. Journal of Food Composition and Analysis 18: 409-425.
- Butler G, Stergiadis S, Seal C, Eyre M, Leifert C (2011) Fat composition of organic and conventional retail milk in northeast England. J Dairy Sci 94: 24-36.
- Alonso L, Braña J, Bada JC (2004) Seasonal and regional influences on the fatty acid composition of cow’s milk fat from Asturias. Spain. Grasas y Aceites 55: 169-173.
- Yang Y, Wang J, Yuan T, Bu D, Yang J, et al. (2013) Impact of region on the composition of milk fatty acids in China. J Sci Food Agric 93: 2864-2869.
- Precht D, Molkentin J (2000) Frequency distributions of conjugated linoleic acid and trans fatty acid contents in European bovine milk fats. Milchwissenschaft 55: 687-691.
- O'Donnell-Megaro AM, Barbano DM, Bauman DE (2011) Survey of the fatty acid composition of retail milk in the United States including regional and seasonal variations. J Dairy Sci 94: 59-65.
- Larsen MK, Nielsen JH, Butler G, Leifert C, Slots T, et al. (2010) Milk quality as affected by feeding regimens in a country with climatic variation. J Dairy Sci 93: 2863-2873.
- Versteeg C, Logan A, Müller W (2016) Australian milk fat-Seasonal and regional variation of melting properties. Journal of Dairy Science 99: 2571-2587.
- Bannon CD, Craske JD, Hilliker AE (1985) Analysis of fatty acid methyl esters with high accuracy and reliability. IV. Fats with fatty acids containing four or more carbon atoms. Journal of the American Oil Chemists’ Society 62: 1501-1507.
- GenStat (2016) GenStat (16thedn). VSN International Ltd., Hemel Hempstead, England, UK.
- Aitchison J, Barceló-Vidal C, Martín-Fernández JA, Pawlowsky-Glahn V (2000) Logratio analysis and compositional distance. Mathematical Geology 32: 271-275.
- Wolff RJ, Bayard CC, Fabien RJ (1995) Evaluation of sequential methods for the determination of butterfat fatty acid composition with emphasis ontrans-18:1 acids. Application to the study of seasonal variations in french butters. Journal of the American Oil Chemists' Society 72: 1471-1483.
- Mansson HL (2008) Fatty acids in bovine milk fat. Food Nutr Res 52: 1821.
- Storry JE (1988) The effect of dietary fat on milk consumption, in Haresign W, Cole DJA (eds) Recent Developments in Rumen Nutrition-2, Elsevier, Amsterdam, Netherlands: 111-141.
- Mele M, Macciotta NPP, Cecchinato A, Conte G, Schiavon S, et al. (2016) Multivariate Factor Analysis of Detailed Milk Fatty Acid Profile: Effects of Dairy System, Feeding, Herd, Parity, and Stage of Lactation. J Dairy Sci 99: 9820-9833.
- Cox MAA, Cox TF (1992) Interpretation of Stress in non-metric multidimensional scaling. Statistica Applicata 4: 611-618.
- Clarke KR (1993) Non?parametric multivariate analyses of changes in community structure. Australian Journal of Ecology 18: 117-143.
- Palmquist DL, Beaulieu AD, Barbano DM (1993) Feed and animal factors influencing milk fat composition. J Dairy Sci 76: 1753-1771.
- Dils RR (1986) Comparative aspects of milk fat synthesis. J Dairy Sci 69: 904-910.
- Vlaeminck B, Fievez V Cabrita AR, Fonseca, AJ, Dewhurst RJ (2006) Factors affecting odd- and branched-chain fatty acids in milk: A review. Animal Feed Science and Technology 131: 389-417.
- Parodi PW (1979) Relationship between trisaturated glyceride composition and the softening point of milk fat. Journal of Dairy Research 46: 633-639.
- Wu Z, Palmquist DL (1991) Synthesis and Biohydrogenation of Fatty Acids by Ruminal Microorganisms in Vitro. J Dairy Sci 74: 3035-3046.
- Parodi PW (2008) Milk lipids: their role as potential anti-cancer agents. Sciences des Aliments 28: 44-52.
- Mensink RP, Katan MB (1992) Effect of dietary fatty acids on serum lipids and lipoproteins. Arterioscler Thromb 12: 911-919.
- Kratz M, Cullen P, Wahrburg U (2002) The impact of dietary mono? and poly?unsaturated fatty acids on risk factors for atherosclerosis in humans. European Journal of Lipid Science and Technology 104.
- Li Y, Hruby A, Bernstein AM, Ley SH, Wang DD, et al. (2015) Saturated Fats Compared With Unsaturated Fats and Sources of Carbohydrates in Relation to Risk of Coronary Heart Disease: A Prospective Cohort Study. Journal of the American College of Cardiology 66: 1538-1548.
- Huppertz T, Kelly AL, Fox PF (2009) Milk lipids - composition origin and properties. Dairy Fats and Related Products 8: 1.
- Van Der Wielen M, TruBluBeverages (previously with Lions Pty Ltd, Bentley), Western Australia, Australia (personal communication).
- Versteeg, C, Logan A, Muller W (2016). Corrigendum to "Australian Milk fat-Seasonal and Regional Variation of Melting Properties" (J. Dairy Sci. 99:2571-2587). J Dairy Sci 99: 2571-2587.
- Bauman DE, Griinari JM (2003) Nutritional regulation of milk fat synthesis. Annu Rev Nutr 23: 203-27.
- Moate PJ, Chalupa W, Boston RC, Lean IJ (2008) Milk fatty acids II: Prediction of the production of individual fatty acids in bovine milk. Journal of Dairy Science 91: 1175-1188.
- Nestel PJ, Mellett N, Pally P, Wong G, Barlow CK, al. (2013) Effects of Low-Fat or Full-Fat Fermented and Non-Fermented Dairy Foods on Selected Cardiovascular Biomarkers in Overweight Adults. British Journal of Nutrition 110: 2242-2249.
- Floris R, Dekker R, Slangen C, Ellen G (2006) Influence of pasture feeding and stall feeding on CLA and other fatty acids in bovine Milk fat. Australian Journal of Dairy Technology 61: 13-20.
- Capuano E., van der Veer G, Boerrigter-Eenling R, Elgersma A, Rademaker J, et al. (2014) Verification of fresh grass feeding, pasture grazing and organic farming by cows farm milk fatty acid profile. Food Chem 164: 234-241.
- Chilliard Y, Ferlay A, Mansbridge RM, Doreau M (2000) Ruminant milk fat plasticity: nutritional control of saturated, polyunsaturated, trans and conjugated fatty acids. Annales de Zootechnie 49: 181-205.
- Walker GP, Dunshea FR, Doyle PT (2004) Effects of nutrition and management on the production and composition of milk fat and protein: a review. Australian Journal of Agricultural Research 55: 1009-1028.
- Kelsey JA, Corl BA, Collier RJ, Bauman DE (2003) The effect of breed, parity, and stage of lactation on conjugated linoleic acid (CLA) in milk fat from dairy cows. J Dairy Sci 86: 2588-2597.
- Baumann DE, Lock AL (2006) ‘Conjugated Linoleic Acid: Biosynthesis and Nutritional Significance’, in Fox PF, McSweeney PLF, Advanced Dairy Chemistry Vol 2 Lipids. Springer, New York, USA: 93-136.
- Dairy Australia (2019) “Dairy at a Glance”. Dairy Australia, Australia.
SUPPLEMENTARY FILE
|
|
C4:0 |
C6:0 |
C8:0 |
C10:0 |
C10:1 |
C12:0 |
C14:0 |
C14:1 |
C15:0i+a |
C15:0 |
C16:0 |
|
C4:0 |
|
|
|
|
|
|
|
|
|
|
|
|
C6:0 |
0.821 |
||||||||||
|
C8:0 |
0.636 |
0.943 |
|||||||||
|
C10:0 |
0.470 |
0.852 |
0.970 |
||||||||
|
C10:1 |
0.150 |
0.470 |
0.470 |
0.471 |
|||||||
|
C12:0 |
0.349 |
0.774 |
0.916 |
0.967 |
0.513 |
||||||
|
C14:0 |
0.230 |
0.651 |
0.696 |
0.725 |
0.769 |
0.782 |
|||||
|
C14:1 |
-0.286 |
-0.036 |
-0.045 |
-0.010 |
0.708 |
0.108 |
0.526 |
||||
|
C15:0i and a |
-0.108 |
0.127 |
0.132 |
0.163 |
0.588 |
0.230 |
0.614 |
0.596 |
|||
|
C15:0 |
-0.226 |
0.116 |
0.181 |
0.268 |
0.604 |
0.379 |
0.697 |
0.672 |
0.772 |
||
|
C16:0 |
-0.298 |
-0.208 |
-0.298 |
-0.279 |
0.410 |
-0.199 |
0.329 |
0.686 |
0.418 |
0.486 |
|
|
C16:1 |
-0.373 |
-0.355 |
-0.418 |
-0.411 |
0.246 |
-0.350 |
-0.035 |
0.589 |
0.037 |
0.156 |
0.714 |
|
C17:0 a |
-0.099 |
-0.150 |
-0.150 |
-0.140 |
-0.141 |
-0.177 |
-0.143 |
-0.046 |
0.136 |
0.063 |
0.032 |
|
C17:0 i |
-0.174 |
-0.028 |
0.037 |
0.083 |
0.083 |
0.070 |
0.157 |
0.182 |
0.316 |
0.312 |
0.135 |
|
C17:0 |
-0.152 |
-0.253 |
-0.352 |
-0.359 |
-0.069 |
-0.341 |
0.008 |
0.180 |
0.224 |
0.314 |
0.516 |
|
C17:1 |
-0.273 |
-0.261 |
-0.302 |
-0.307 |
-0.003 |
-0.309 |
-0.109 |
0.242 |
0.005 |
0.123 |
0.387 |
|
C18:0 |
0.070 |
-0.270 |
-0.297 |
-0.344 |
-0.701 |
-0.433 |
-0.678 |
-0.728 |
-0.394 |
-0.632 |
-0.641 |
|
C18:1 |
-0.128 |
-0.451 |
-0.437 |
-0.460 |
-0.712 |
-0.526 |
-0.868 |
-0.609 |
-0.597 |
-0.717 |
-0.599 |
|
C18:2 |
-0.051 |
-0.256 |
-0.264 |
-0.257 |
-0.432 |
-0.309 |
-0.481 |
-0.392 |
-0.360 |
-0.391 |
-0.115 |
|
C18:3 |
0.122 |
0.390 |
0.498 |
0.504 |
0.194 |
0.440 |
0.263 |
-0.103 |
-0.020 |
0.133 |
-0.326 |
|
C20:1 |
-0.261 |
-0.376 |
-0.397 |
-0.381 |
-0.135 |
-0.295 |
-0.220 |
0.157 |
-0.055 |
0.059 |
0.081 |
|
Others |
0.025 |
0.081 |
0.145 |
0.169 |
-0.004 |
0.165 |
0.030 |
-0.114 |
-0.100 |
0.015 |
-0.280 |
|
C16:1 |
C17:0a |
C17:0i |
C17:0 |
C17:1 |
C18:0 |
C18:1 |
C18:2 |
C18:3 |
C20:1 |
|
|
C17:0 a |
0.087 |
|||||||||
|
C17:0 i |
0.119 |
0.521 |
||||||||
|
C17:0 |
0.328 |
0.152 |
0.288 |
|||||||
|
C17:1 |
0.648 |
0.252 |
0.181 |
0.405 |
||||||
|
C18:0 |
-0.552 |
0.032 |
-0.224 |
-0.139 |
-0.227 |
|||||
|
C18:1 |
-0.143 |
0.076 |
-0.213 |
-0.242 |
0.028 |
0.712 |
||||
|
C18:2 |
-0.078 |
0.127 |
0.055 |
-0.105 |
-0.139 |
0.218 |
0.376 |
|||
|
C18:3 |
-0.178 |
-0.079 |
0.018 |
-0.157 |
0.165 |
-0.060 |
-0.077 |
-0.336 |
||
|
C20:1 |
0.099 |
0.110 |
0.106 |
0.168 |
-0.008 |
0.030 |
-0.017 |
-0.021 |
-0.326 |
|
|
Others |
-0.218 |
-0.107 |
0.118 |
-0.090 |
-0.270 |
0.001 |
-0.148 |
-0.091 |
0.148 |
0.141 |
Table S1: Correlation Matrix, all samples from the 19 bulk milk production sites over 24 months (n=794).
Correlations are significant at P= 0.05, P= 0.01 and P= 0.001 when their absolute values are greater than 0.069, 0.091 and 0.117 respectively.
The multidimensional scaling of the 19 sites was based on the fatty acid composition over 7 fatty acid groups for the 24 months of the study. For many sites, compositional data were not available for all of the 24 months, so for any pair of months, differences between two sites could only be based on months when compositions were determined on both the sites.
Let
Pijk = Percentage component for fatty acid group i at site j in month k,
Where i=1…7, j=1…19, k=1…24
Note that for each site/month combination, either all 7 Pijk values were known and add to 100, or all 7 were missing (no milk samples taken).
Firstly we calculate the geometric mean Gijk over the 7 fatty acid groups of the components for each site at each month
Let nst = the number of months where compositional data were available for both site s and site t.
Then the distance between sites s and t, Dst is
From these distances a 19 x 19 symmetric distance matrix M was formed, where is the value in the sth row and tth column (and tth row and sth column). The non-metric 3-dimensional multi-dimensional scaling was performed on this matrix M.
Citation: Logan A, Müller W, Versteeg C (2019) Australian Milk Fat - Seasonal and Regional Composition of Fatty Acids. J Dairy Res Tech 2: 011.
Copyright: © 2019 Amy Logan, et al. This is an open-access article distributed under the terms of the Creative Commons Attribution License, which permits unrestricted use, distribution, and reproduction in any medium, provided the original author and source are credited.