Changes in Carbohydrates and N-Acetylglucosamine (Glcnac) In Response to an Experimental Increase of Temperature in Tissues of Two Oyster Species, the Temperate Introduced Crassostrea Gigas and the Native Tropical Crassostrea Corteziensis
*Corresponding Author(s):
Elena PalaciosCentro De Investigaciones Biologicas Del Noroeste (CIBNOR), Mar Bermejo 195, Col. Playa Palo De Santa Rita, La Paz, B.C.S. 23090, Mexico
Email:epalacio@cibnor.mx
Abstract
The present study evaluates the presence and location of carbohydrates in general, and the monosaccharide N-acetylglucosamine (GlcNAc) on tissues of temperate oyster Crassostrea gigas and tropical oyster C. corteziensis during an increase in temperature during reproduction, a stress which is probably one of the main causes of the oyster’s summer mass mortality events. Adult oysters from both species were placed at 22 °C and exposed to a gradual increase in temperature (1 °C day-1) until reaching 34 °C. The values of the GlcNAc index were higher in C. corteziensis compared to C. gigas in the gonads, vesicular connective tissue and digestive gland of males and females during the experiment, except for the hemocytes in the gonads, where the GlcNAc index was significantly highest in C. gigas at 34 °C. A PCA revealed an inverse association between GlcNAc in tissues (gonad, digestive gland, and vesicular connective tissue) and GlcNAc in hemocytes for females and males. The present study shows evidence that water temperature increase affects the overall immune system capability and hemocyte-tissues signaling function, with deep differences between C. gigas and C. corteziensis, particularly in females. This information provides valuable insights for further studies into the immunological mechanisms of oyster summer mortality events.
Keywords
Carbohydrates; GlcNAc; Introduced oysters; Native oysters; Reproduction; Summer mortality; Thermal stress
Introduction
Carbohydrates are the most abundant organic compounds in living organisms, used as storage of energy, cell interactions, signal transduction, antibody recognition, etc. Sexual maturation in bivalves is closely associated with the metabolism of carbohydrates such as glycogen, which plays a central role in the metabolic and energy supply of gametogenesis in several bivalve species [1-3] and the mobilization of energy reserves in oysters [4,5]. As ovaries mature, there is a mobilization of lipids and carbohydrates to the gonad [6,7], mainly as vitellogenin, where they are stored, mostly as vitellin, or used to maintain gametogenesis. Vitellin (Vt) stored in oocytes is a glycolipoprotein with a molecular weight of ~500kD, that is composed of heterogeneous subunits and lipid and carbohydrate inclusions [8]. In addition to an accumulation of carbohydrates in oocytes, carbohydrates can be accumulated in some species in two types of mantle storage cells, i.e., adipogranular cells that contain glycogen, lipids, and proteins, and vesicular connective tissue cells that store almost exclusively glycogen [2,3].
Carbohydrates are also involved in cell communication, such as apoptosis. The first steps of apoptosis include changes in the cell surface, signaled by carbohydrates and the translocation of phosphatidylserine from the interior cell membrane to the surface [9], followed by hemocyte infiltration. Hemocytes represent the backbone of the bivalve immune system; these circulating cells play an important role in internal immune defense and modulating physiological responses to environmental and biological stressors [10-12]. In invertebrates, atresia, apoptosis, hemocyte infiltration, melanization, encapsulation, and phagocytosis of foreign and self-particles during gametogenesis are parts of the immune system response [13,14] that is modulated by pattern recognition receptors (PRRs), such as lectins, that recognize monosaccharides, such as N-acetyl-β-D-glucosamine (GlcNAc) a monosaccharide derivative of glucose [12,14,15]. The oyster’s capabilities to respond to environmental stress, such as periodically high summer temperatures, strongly depends on the viability and functional response of their hemocytes [14,16]. In oysters, the interaction of environmental stress, reproduction, and stressed immune response has been proposed to increase summer mortalities [17-19] a worldwide phenomenon that can reach up to 80 % losses of oysters during the summer months [5,18,20-23]. This problem has forced the oyster farming industry to consider alternative and resistant species, such as Crassostrea corteziensis, which is a native species from the Gulf of California adapted to tropical waters [6], and a viable option for cultivation by ocean farmers [24]. In previous work, we found that when submitted to an increased temperature, C. corteziensis had much less atresia than C. gigas [25]. The present study aims to evaluate the presence and location of carbohydrates and GlcNAc on tissues of C. gigas and C. corteziensis during the increase of temperature from 22 to 34°C, which is the water temperature reached during the aquaculture of oysters in Northwest Mexico.
Materials and Methods
Source and management of oysters
Adult oysters were produced and cultured in controlled conditions in a commercial production system in Topolobampo, Sinaloa, Mexico. A total of 70 adults of C. gigas (Length = 12.7 ± 0.2 cm) and 70 of C. corteziensis (Length = 10.2 ± 0.1 cm) were collected, packed in ice, and transported by plane to the aquaculture experimental facilities of the Universidad Autónoma de Baja California Sur (UABCS) in La Paz, B.C.S., México. On arrival, oysters were washed and scrubbed to eliminate epibionts. Histological inspection at the start of the experiment using 10 oysters of each species showed that the animals were in good health condition and early gametogenesis (stage I) according to [6].
Experimental design
The oysters were separated by species (60 adults of C. gigas and 60 adults of C. corteziensis) and placed in six 100 L tanks (20 oysters per tank) supplied with filtered seawater (1 µm filtered and UV-treated aerated; 22 ± 1 °C, pH 8.3 ± 0.1, and 35.1 ± 0.1 PSU). Animals were fed with a daily ratio of an algal mixture of Chaetoceros gracilis, C. calcitrans, and Isochrysis galbana (50: 25: 25 equivalent volume) at a density of 410 cells oyster-1 day-1 throughout the whole experiment. After acclimatization, the temperature was increased by 1 °C day-1 using submersible electric heaters (± 1 °C) until reaching 34 °C, as described in [25].
Tissue sampling
Sequential oyster samplings were performed at 23 °C, 28 °C, and 34 °C, 22 °C was kept as control; 15 animals per tank were sampled at each temperature, as described by [25].
Oocytes index and sperm index
The area occupied by gonadal female and male gamets, excluding surrounding connective tissue using digital image analysis programs was determined based on the intensity of the specific color of each cell type and tissue, using the hematoxylin-eosin technique, and expressed in um² in digital images taken at 20×.
The cover area of a specific tissue (τ) from the total tissue image (β) represents as percentage cover area (τ_index), is derived as follows:
τ_index = τ/β*100
Where τ represents: OI is the oocytes index and SI sperm index.
Carbohydrates index (CHI)
The area occupied by carbohydrates coverage was determined based on the intensity of the specific color of each cell type and tissue, using histochemical stain techniques Periodic Acid Schiff (PAS), and expressed in µm² in digital images taken at 20×.
The cover area of a specific tissue (τ) from the total tissue image (β) represents as percentage cover area (τ_index), is derived as follows:
τ_index = τ/β*100
Where τ represents: CHI is carbohydrate index
Labeling of N-acetyl-β-D-glucosamine (GlcNAc) with wheat germ agglutinin (WGA)
Tissue samples were dehydrated in ethanol, cleared in xylene, and embedded in paraffin (Paraplast X-Tra, Mc Cormick Scientific, San Diego, CA, USA). Sections (4-µm thickness) were deparaffined in organic solvents, rehydrated, and mounted in poly-L-lysine coated glass slides (Sigma-Aldrich, St. Louis, MO, USA). Wheat germ agglutinin (WGA) from Triticum vulgaris is used to detect the presence of carbohydrate moieties of N-acetyl-β-D-glucosamine (GlcNAc) [11,26,27]. To analyze changes in the content of GlcNAc in oyster tissues, the histological sections were labeled with the lectin WGA conjugated with green-fluorescein isothiocyanate (FITC Oregon GreenR 488, Invitrogen, Molecular Probes®) following the manufacturer's instructions. Nuclear DNA was counterstained with the fluorescent blue dye DAPI (4', 6-diamidino-2-phenylindole; Invitrogen®). The WGA-FITC and DAPI fluorescent dyes were incorporated into the histological slides whit darkness-incubation times of 20 min and 5 min, respectively. After washing, the sections were coverslipped with a water-soluble antifading mounting medium and stored protected from light.
GlcNAc index
Slides were analyzed with a fluorescence microscope Olympus BX50, (Olympus Optical, Japan). Digital images were taken at different magnifications using the merge function, as not otherwise specified, with the software Image-Pro Premier v.9.0 (Media Cybernetics, Bethesda, MD, USA). An image signal processing technique was applied using the Image-Pro Premier v.9.0 for the automatic identification of pixels with a green-fluorescent signal from GlcNAc. The technique is based on the conversion of the image in color to an intensity-level image to enhance a determined dye [6,7]. The coverage area of specific color pixels () from the total image () represents as the percentage of the coverage area of the GlcNAc index, calculated from the tissue as follows:
GlcNAc Index = (θ/λ) * 100%
Where θ explains the green-fluorescent signal of GlcNAc detected in tissues; and λ is the image total area. The GlcNAc index was the average calculation obtained from three random images taken in different areas of each slide.
Statistical analysis
Statistical analyses were performed using command lines in the R language (R v. 3.2.2, R Core Team, 2016) on the Rstudio programming interface. All values are expressed as mean ± Standard Error (SE). The values expressed in percentages were transformed into arcsine function (arcsine √P) [28]. A priori Levene's and Shapiro–Wilk test was used to determine any heterogeneity of variances and to confirm the normality of frequencies, respectively [29]. To determine any significant differences in the GlcNAc index, the values were analyzed using a two-way ANOVA, where ‘the species’ and ‘temperature’ were fixed factors. In case of a significant interaction (P < 0.05) between the two factors, a post hoc multiple ranges comparisons Tukey HSD was used to detect significant differences (P < 0.05) among means. A Pearson correlation coefficient was run to establish the relationship between the GlcNAc signal in the tissues of both oyster species and the temperature increase [28,29]. Factor analysis was used to determine the effect of temperature in both species of oysters but separating males and females and considering a factor loading ≥ 0.7 and eigenvalues >1.0, as described in [30].
Results
Carbohydrate, oocyte, and sperm index
The Carbohydrate Index (CHI) in the VCT, where it is most abundant, of the mantle of males and females of the two species was affected by Species and Temperature, being highest in C. corteziensis at 22 °C (63.39 ± 6.7%) and lowest in C. gigas at 34 °C (29.83 ± 3.9%) (Figure 1A). In female gonads, the area occupied by oocytes, termed Oocyte Index (OI), was affected by species, with a larger OI in C. gigas (61.7 %) compared to C. corteziensis (35.6 %) (Figure 1B). In male gonads, the area occupied by sperm cells, termed Sperm Cell Index (SI), was affected by species and temperatures, with a larger SCI in C. gigas (61.8 %) compared to C. corteziensis (41.6 %). The testicle acinus of C. corteziensis were found to be reabsorbed at 28 °C in C. gigas and at 34 °C for C. corteziensis, compared to the control temperature (Figure 1C).
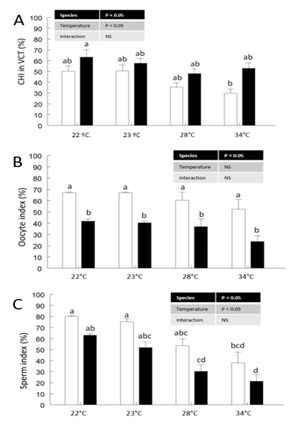 Figure 1: A) Carbohydrate index (CHI) in Vesicular Connective Tissue index (VCT) in the mantle of males and females; B) Oocyte Index (OI) in female oyster gonad; B) Sperm Index (SI) in male oyster gonads of C. gigas white bars and C. corteziensis black bars, subjected to a controlled increase in temperature.
Labeling of N-acetyl-β-D-glucosamine (GlcNAc)
The GlcNAc green-fluorescent signal varied in ovarian tissue according to the gonad development stage in both oyster species (Figure 2). In C. corteziensis, females with late-developing oocytes show a strong GlcNAc signal on cell membranes at 23 °C (Figure 2A, B). The vitellogenic and postvitellogenic oocytes of C. gigas show a discontinuous signal on membranes at 23 °C (Figure 2C, D). As shown in Figure 2E-H, at 34 °C, the atresic oocytes of both species do not show a GlcNAc signal. Abundant surrounding granular hemocytes were observed whit a strong blue-fluorescent signal, which corresponds to healthy nuclear DNA.
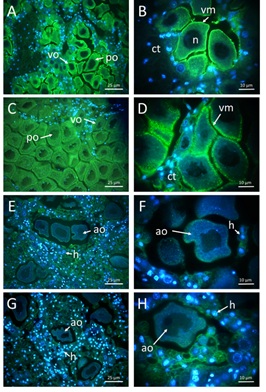 Figure 2: Labeling of N-acetyl-β-D-glucosamine (GlcNAc) in female gonads with WGA-FITC (green) and counterstained with DNA fluorescent blue dye (DAPI).A) C. corteziensis at 23 °C (40 ×); B) C. corteziensis at 23 °C (100 ×); C) C. gigas at 23 °C (40 ×); D) C. gigas at 23 °C (100 X); E) C. corteziensis at 34 °C (40 ×); F) C. corteziensis at 34 °C (100 ×); G) C. gigas at 34 °C (40 ×); H) C. gigas at 34 °C (100 ×); vo, vitellogenic oocytes; po, postvitellogenic oocytes; ao, atresic oocytes; h, granular hemocytes; n, nucleus.
The labeling of GlcNAc was positive in ripe-male gonads of C. corteziensis at 22 °C and 23 °C (Figure 3A), with testicular acinus full of spermatogonia, spermatocytes, and abundant spermatozoa organized concentrically towards the acinar lumen. The GlcNAc signal was detected in all-male germ cell lines (Figure 3). At 28 °C, the disruption of testicular acinus was observed, and the sperm cells begin to be phagocytosed by the surrounding hemocytes (Figure 3C). The blue-fluorescence nuclei of the spermatocytes and spermatozoa were found within the cytoplasm of the hemocytes (Figure 3E). The green fluorescent signal on the granular hemocyte membranes and within the cytoplasm reveals the presence of GlcNAc. Sperm cells were scarce, hemocytes phagocytosed a significant part of the gonad, and the signal of nuclear DNA from all spermatic cells is weak. The few remaining spermatozoa were observed within the cytoplasm of the hemocytes, which phagocytosed them. Hemocytes display a strong fluorescent signal which reveals the immunological role of GlcNAc in the phagocytosis signaling process during thermal stress (Figure 3E, F). In C. gigas, a similar effect to that observed in C. corteziensis was found. The affinity pattern of fluorescent labeling decreases in testicular tissue as temperature increases. The particular details are shown in Figure 3. Controls at 22 °C for both species show the same fluorescent characteristics as oysters exposed to a temperature of 23 °C.
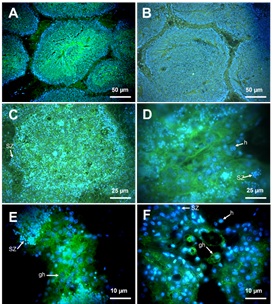 Figure 3: Detection of N-acetyl-β-D-glucosamine (GlcNAc) in male oyster gonad. Simultaneous incorporation of DAPI and WGA-FITC. Blue fluorescence nuclei stained with DAPI. Green fluorescence reveals the presence of GlcNAc. A) Mature C. corteziensis; B) Mature C. gigas, acini filled with spermatogonia, spermatocytes, spermatids and abundant spermatozoa that show abundant GlcNAc on the membrane and cytoplasm in all kinds of cells, (22 °C 20 ×). C) Resorption C. corteziensis; D) Resorption C. gigas; sperm cells lose their organization within the acinus. Membranes and cytoplasms of the granular hemocytes (gh) show abundant GlcNAc, (28 °C, 60 ×). E) Resorption C. corteziensis; F) Resorption C. gigas, residual spermatozoa and granular hemocytes (gh) phagocytosing sperm cells (34 °C, 100).
In the vesicular connective tissue surrounding the gonadal acini the GlcNAc immuno-detection was stronger in the membrane and cytoplasm of the fibrocytes of C. corteziensis than in those of C. gigas at 23 °C (Figure 4A, B). As shown in (Figure 4C, D), at 34 °C, the GlcNAc fluorescent signal in the vesicular connective tissue of both oyster species was lost. In the digestive gland, the GlcNAc green-fluorescent signal was positive in the membrane and cytoplasm of the epithelial cells and microvilli of the digestive diverticula of C. corteziensis, and less intense than those of C. gigas. In digestive glands, a strong hemocyte infiltration was observed throughout the whole experiment in C. gigas (Figure 4E, F).
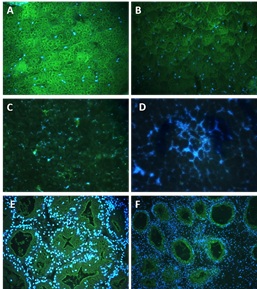 Figure 4: Detection of N-acetyl-β-D-glucosamine (GlcNAc) in tissues of oysters stained with FICT-WGA and nuclei stained with DAPI. A) C. corteziensis vesicular connective tissue at 23 °C. B) C. gigas at 23 °C. C) C. corteziensis at 34 °C; D) C. gigas at 34 °C (40 ×). E) C. corteziensis digestive gland; F) C. gigas digestive gland, (20 ×). Green fluorescence reveals the presence of GlcNAc. Blue fluorescence indicates the presence of DNA.
Influence of the species and temperature on the oyster GlcNAc index
The coverage area of the GlcNAc green-fluorescent signal was evaluated by digital image analysis. Significant differences in the GlcNAc index in female gonads between species and temperatures were found. The highest GlcNAc index values in the ovary were found for C. corteziensis (34 ± 4.7 %; P < 0.05), compared to 29.5 ± 2 % (P < 0.05) in C. gigas, at 22 °C. As shown in (Figure 5A), the significantly lowest values of green fluorescent signal in two species were found at 34 °C, with 15.5 ± 1.8 % in C. corteziensis and 9.5 ± 1 % in C. gigas.
The highest GlcNAc index values in the vesicular connective tissue surrounding the ovarian follicles were found in C. corteziensis at 28 °C (11.1 ± 0.1 %; P < 0.05), with similar values at 22 °C and 23 °C (7 ± 2.6 % and 7.9 ± 0.9 %; P < 0.05, respectively) while the significantly lower value in the GlcNAc index occurred at 34 °C (6.4 ± 1.6 %). In C. gigas, low values in the GlcNAc index at 22 °C and 23 °C (3.8 ± 1.3 % and 3.3 ± 1.2 %, respectively) were found. Those values decreased significantly up to 1.2 ± 0.1 % with the increase of temperature from 28 °C to 34 °C (Figure 5B).
In the digestive gland of female oysters, the highest GlcNAc index in C. corteziensis was found at 28 °C (29.7 ± 2.2 %; P < 0.05) and the lowest at 34 °C (14.1 ± 1.3 %; P <0.05). In C. gigas the GlcNAc signal was significantly higher at 22 °C and 23 °C (14.2 ± 1.8 % and 15.1 ± 0.7 %, respectively), with the minimum values of green fluorescence (P < 0.05) at 28 °C and 34 °C (8.2 ± 0.6 % and 6.1 ± 0.7 %, respectively) (Figure 5C).
The GlcNAc signal in ovary hemocytes was significantly highest in C. gigas at 34 °C and 28 °C (11.1 ± 1% and 7.8 ± 08 %, respectively). In comparison, as shown in (Figure 5D), the lowest values (P < 0.05) for this species were observed at 22 °C and 23 °C (2.1 ± 0.1 % and 2.6 ± 0.3 %, respectively). The oyster C. corteziensis had the lowest values in the GlcNAc index (P < 0.05) in hemocytes; the lowest green fluorescent signal was observed at 22 °C and 23 °C (~ 1%; P < 0.05), and the highest at 34 °C (6 ± 1 %; P < 0.05).
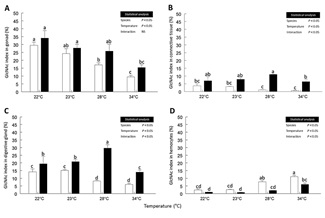 Figure 5: Index of N-acetyl-β-D-glucosamine (GlcNAc) in female-oysters. A) Gonad; B) Vesicular connective tissue; C) Digestive Gland; D) Hemocytes. C. gigas (N = 23) white bars and C. corteziensis (N = 11) black bars, during a controlled increase of temperature. Data (mean ± SE) were analyzed considering the species (two levels) as the first independent factor and the temperature (four levels) as the second independent factor in a two-way ANOVA. The F-test statistic and degrees of freedom are reported. A Tukey post hoc was applied to compare the means. Different superscript letters indicate statistically significant differences between means at P < 0.05.
Significant differences in the GlcNAc index of all tissues of male oysters were obtained due to the effect of temperature, species, and the interaction of factors. In testicles, the highest green-fluorescence values were quantified in C. corteziensis (50.2 ± 3.7 %; P < 0.05) at 23 °C. In C. gigas, the GlcNAc index was significantly highest at 22 °C (41.3 ± 2.6 %). In both species, the detection of GlcNAc in the testicles decreased significantly at 28 °C until reaching minimum values (P < 0.05) of 16 ± 1 % in C. corteziensis and 10.2 ± 1 % in C. gigas at 34 °C (Figure 6A). In the vesicular connective tissue from testicles, the highest values (P < 0.05) of GlcNAc were found in C. corteziensis at 22 °C and 23 °C (13.4 ± 1.9 % and 12.1 ± 0.9 %, respectively), same values decreased significantly with the increase of temperature up to 2.3 ± 0.4 % at 34 °C. In C. gigas, the GlcNAc fluorescent signal was significantly lower than the observed in C. corteziensis throughout the experiment, which progressively decreased (P < 0.05) from 5 ± 0.9 % at 22 °C, to 0.7 ± 0.1 % at 34 °C (Figure 6B).
The GlcNAc index in the digestive gland of male-oysters varied significantly between species and temperatures. The highest values were found in C. corteziensis at 22 °C (22.7 ± 2.4 %, P < 0.05). At 23 °C, the GlcNAc signal was similar in both species (~ 20%; P >0.05). Nonetheless, as seen in (Figure 6C), the detection of GlcNAc decreased gradually and significantly with the increase in temperature to minimum values (P < 0.05) of 10.5 ± 0.9 % in C. corteziensis, and 6 ± 1 % in C. gigas at 34 °C. The hemocytes in the testicle showed the lowest GlcNAc values at the control temperature of 22 °C (~ 1%, P < 0.05) in both species. The GlcNAc index in hemocytes tends to increase continuously with increasing temperature, with significantly higher values in C. gigas, with 31.1 ± 2.4 %, followed by 17.3 ± 0.9% in C. corteziensis at 34 °C (Figure 6D).
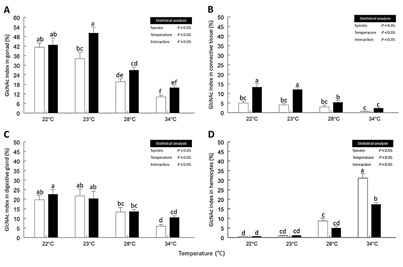 Figure 6: Index of N-acetyl-β-D-glucosamine (GlcNAc) in male-oysters. A) Gonad; B) Vesicular connective tissue; C) Digestive Gland; D) Oyster hemocytes. C. gigas white bars and C. corteziensis black bars, during a controlled increase of temperature. Data (mean ± SE) were analyzed considering the species (two levels) as the first independent factor and the temperature (four levels) as the second independent factor in a two-way ANOVA. The F-test statistic and degrees of freedom are reported. A Tukey post hoc was applied to compare the means. Different superscript letters indicate statistically significant differences between means at P < 0.05.
A decreasing trend in the GlcNAc index was observed in all oyster tissues as a response to thermal stress (Table 1). The strongest inverse relationship between the GlcNAc signal and temperature was found in the gonad and digestive gland of C. gigas in both sexes. Nevertheless, the detection of GlcNAc was also inversely correlated with the temperature (P < 0.05) in the gonads, vesicular connective tissue, and digestive gland of C. corteziensis. In both species, a strong immune-signaling process of GlcNAc in the hemocytes was significant and directly proportional to the increasing temperature.
|
GlcNAc Index |
Temperature (°C) |
|
|
Females |
C. gigas |
C. corteziensis |
|
Gonad |
-0.874* |
-0.865* |
|
Vesicular connective tissue |
-0.815* |
-0.181 |
|
Digestive gland |
-0.818* |
-0.473 |
|
Hemocytes |
0.819* |
0.852* |
|
Males |
|
|
|
Gonad |
-0.911* |
-0.869* |
|
Vesicular connective tissue |
-0.662* |
-0.834* |
|
Digestive gland |
-0.781* |
-0.701* |
|
Hemocytes |
0.914* |
0.891* |
Table 1: Pearson’s correlation coefficient (r) between the N-acetyl-β-D-glucosamine (GlcNAc) index in the different tissues of the oysters, and the experimental increase of temperature.
Most (88.5 %) of the GlcNAc index in female C. gigas was described by two principal components (Figure 6); the first factor explained 68.7 % of the variance, with significant positive contributions of GlcNAc Gonad (0.93), GlcNAc digestive gland (DG) (0.96), GlcNAc Vesicular Connective Tissue (VCT) (0.93) and negative contribution of GlcNAc hemocytes (−0.86). The second factor explained 19.8 % and had significant but negative contributions of the oocyte index (−0.98). In females (Figure 7A), oysters at 22 and 23 °C were well separated from other temperatures and each specie (C. gigas – blue and C. corteziensis -green). C. corteziensis at 28 °C (yellow) also formed an independent group, while C. gigas (red) was not separated from oysters at 34 °C (C. gigas - dark red and C. corteziensis - purple). For male C. gigas, 74.8 % of the variation was given by the first factor, composed of GlcNAc Gonad (0.86), GlcNAc DG (0.91), GlcNAc VCT (0.90), sperm index (0.72) and negative contribution of GlcNAc hemocytes (−0.92). In C. corteziensis, the first factor explained 69.8 % of the variance, with significant positive contributions of GlcNAc Gonad (0.90), GlcNAc DG (0.81), GlcNAc VCT (0.87), sperm index (0.70), and negative contribution of GlcNAc hemocytes (−0.89). The second factor explained 12.8 % and had significant negative contributions of sperm index (−0.70). In males (Figure 7B), oysters at 22 and 23 °C were well separated from other temperatures but not by species (C. gigas – blue and C. corteziensis -green). At 28 °C, C. corteziensis (yellow) was overlaid with C. gigas (red), and the same happened at 34 °C (C. gigas - dark red and C. corteziensis - purple).
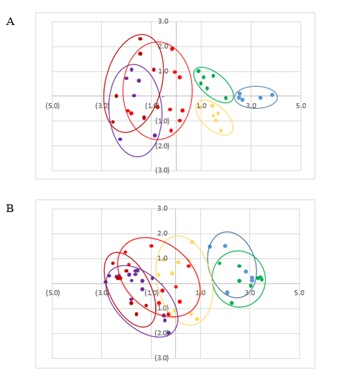 Figure 7: Effect of temperature using factor scores PCA on N-acetyl-β-D-glucosamine (GlcNAc) in tissues (gonad, digestive gland, hemocytes and vesicular connective tissue) in A) females and B) males for C. gigas (23 °C - blue, 28 °C - red, 34°C - dark red) and C. corteziensis (23°C - green, 28°C - yellow, 34°C - purple).
Discussion
N-Acetylglucosamine (GlcNAc) is a monosaccharide derivative of glucose and is widely distributed worldwide is well known for the important structural roles that it plays at the cell surface of many different cell types. GlcNAc is extensively present in the external cover of oocytes, allowing them to interact with the cells that surround them, such as follicular cells and the vesicular connective tissue that supports the follicles. Their number and location change during maturation, as has been described in most animals where oocyte-sperm recognition is necessary, including bivalves [31]; however, changes in GlcNAc in oocytes and sperm have not been studied in oysters. Here, we found that as temperature increased, the GlcNAc significantly decreased in gonads (Figure 3A). This decrease was more evident in the female gonads of C. gigas compared to C. corteziensis. Oocytes lacking monosaccharides in their membranes are probably not viable and could be prematurely spawned or degenerate within the gonads as atresic oocytes [32]. In accordance, we found more atresic and degenerated oocytes in C. gigas at higher temperatures compared to C. corteziensis [25]. In female C. corteziensis, there are no differences in gonad content of GlcNAc until 34 °C, while in C. gigas there is a continual decrease as the temperature increase until reaching a third of the original levels of GlcNAc at 34 °C. This is expected since C. corteziensis’s natural distribution is in subtropical climates that range from 15 °C – 32 °C [24,33]; while C. gigas natural habitat is in temperate climates that range between 4 °C – 24 °C [34]. C. gigas introduction and culture to a more extended range of temperatures has been successful, but even though it grows and reproduces at higher temperatures, it can be doing so in sub-optimal conditions. Oysters are well adapted to mature in stressful conditions, and even do so better than when conditions are stable, maybe as a remanence of tidal stress [35]. But if in addition to reproduction, there is another stress involved, such as an infection, it can die off, as happens often during the so-called summer mortalities [17]. C. corteziensis, in contrast, only had decreased monosaccharides in oocytes at 34 °C, a temperature seldom reached during reproductive peaks in this oyster, which spawn when temperature increases above 27 °C [6], but live in climates where temperature can reach 32 °C in the water [24]. In male gonads, there was a decrease in GlcNAc of C. gigas similar to females, but in male C. corteziensis, there was a slight increase at 23 °C that resulted in significant interaction (Figure 5). Sperm also has a monosaccharide cover that can identify oocytes in the water, a lack of which rendered them not able to fertilize the egg [36]. In addition to the temperature that each species can withstand, each one has a different reproductive approach: C. gigas tends to mature and spawn in one or two peaks a year, while C. corteziensis can produce fewer oocytes during several spawns during the year, and the number of spawns recruited is smaller than in C. gigas [37]. This was also observed here, with female C. corteziensis having a smaller recruitment area than C. gigas (Figure 1B). With more oocytes entering maturation at a determined time, or peak means the effort of reproduction is higher in C. gigas than C. corteziensis; this leaves less energy in the former to face stressful events, such as a strong temperature increase.
Oocytes that are not spawned degenerate through atresia, and can be resorbed by macrophages bivalves [38] to re-direct energy resources from reproduction to counteract stressors [39] a process accompanied by an influx of hemocytes into the gonad or released along with normal oocytes at spawning [32]. In contrast to gonads, hemocytes GlcNAc significantly increased as temperature increased in both species and both in males (Figure 6D) and females (Figure 6D). This could be a result of more hemocytes invading the gonad as the oysters are submitted to a higher temperature and as mentioned above, represent the hemocyte with granules that digest the atresic oocytes for energy recirculation. Here, the disruption in the GlcNAc immune signal in gametes could be a signal to activate hemocytes mediated by PRRs as a response to thermal stress, thus controlling immune processes such as cell death and phagocytosis. GlcNAc-binding lectins present in hemocytes have been widely described in the immune activation of mollusks [14,40,41], reported hemocyte infiltration and phagocytic activity increased significantly over the thermal stress application (12 °C to 21 °C) in C. gigas, but also in the mussel Mytilus galloprovincialis and the cockle Katelysa rhytiphora. Bigger differences between the acclimation temperature and stress temperature can affect negatively hemocyte response, producing decreased total hemocyte count, hemocyte adhesion, and phagocytic activity in invertebrates [12], including Crassotrea. virginica at 25-28 °C [42-44] and C. gigas above 21 °C [21,44]. Here, we found that GlcNAc in hemocytes significantly increased in C. gigas from 28 °C and C. corteziensis from 34 °C. Both species were acclimated to much higher temperatures (above 22 °C and up to 30 °C) than those used for C. gigas in temperate countries, which are usually below 21 °C [45,46]. While 34 °C is a rather extreme temperature that might be seldom encountered in nature, we didn’t yet see a decrease in GlcNAc in either species (Figure 2).
The histochemical composition of the cytoplasm of VCT cells was characterized as neutral glycoconjugates in C. corteziensis by [6]. As the temperature increases, the amount of carbohydrates decreases in the vesicular connective tissue in both oyster species at 28 and 34 °C. We also observed a decrease in monosaccharides in the digestive gland and Vesicular Connective Tissue (VCT) in C. gigas females (Figure 3B and 3C), but in C. corteziensis GlcNAc increased at 28 °C in the digestive gland and VCT, and only decreased at 34 °C, to levels similar to C. gigas at 22 °C. The more extended effect on all tissues analyzed in C. gigas compared to C. corteziensis could indicate a loss of recognition among cells and function of the tissue-organ that could eventually, compromise survival. Similarly, in a previous paper, we found that survival of C. gigas started to significantly decrease at 28 °C (from 100% to 94% and then to 89% at 34 °C) while survival of C. corteziensis significantly decreased only at 34 °C to 96% [25]. These decreases might indicate a process of degeneration, with more advanced tissue damage in C. gigas at lower temperatures, while C. corteziensis might be reaching the same stage of damage several degrees up. Interestingly, the response of GlcNAc in the different tissues was very similar in males of both species (Figure 7B), while in females GlcNAc at 22-23 °C in both species was well separated. In C. corteziensis at 28 °C there was still a clear separation, but in contrast, C. gigas at 28 °C overlaid with 34°C, indicating that deterioration had already started at this temperature, while a similar response was found for C. corteziensis only at 34 °C (Figure 7A). We interpret this as more extended damage to all tissues in the females of the former as temperature increases, while males from the two species had similar behavior. We did not separate dead oysters by sex, but maybe if we had, we could have found more dead females than males; as discussed above, females, and particularly C. gigas females have much more energy invested in developing the gonad, just by the number of oocytes involved.
In conclusion, the present study shows evidence that water temperature increase affects the overall immune system capability and hemocyte-tissues signaling function, with deep differences between C. gigas and C. corteziensis, particularly in females. Considering the worldwide sea warming, and the annual losses in oyster aquaculture, the results of this work are important for improving strategies, such as using native species more adapted to high temperature conditions, to establish oyster farming less susceptible to a globally changing environment.
Acknowledgments
This study was conducted with support from SEP-CONACYT 2016 286252 awarded to E. Palacios. We are grateful to Eulalia Meza Chávez and Francisco Encarnación Ramírez for their assistance during the bioassay and sample analysis.
Conflict of Interest
The authors declare no conflict of interest.
Data Availability Statement
The data that support the findings of this study are available from the corresponding author upon reasonable request.
Ethics statements
The adult oysters (Crassostrea gigas and C. corteziensis) were transported and handled according to CIBNOR Internal Committee for the Care and Use of Laboratory Animals (CICUAL), the number of sampled organisms contemplated "the rule of maximizing information published and minimizing unnecessary studies". In this sense, 140 oysters were considered the minimum number of organisms needed for this experiment.
References
- Gabbott PA (1975) Storage cycles in marine bivalve molluscs: A hypothesis concerning the relationship between glycogen metabolism and gametogenesis. In: Ninth European Marine Biology Symposium. Aberdeen University Press: Aberdeen 191-211.
- Bayne BL, Bubel A, Gabbott PA, Livingstone DR, Lowe DM, et al. (1982) Glycogen utilization and gametogenesis in Mytilus edulis. Biol Lett 3: 89-105.
- Mathieu M, Lubet P (1993) Storage tissue metabolism and reproduction in marine bivalves -a brief review. Invertebr Reprod Dev 23: 123-129.
- Ruiz C, Abad M, Sedano F, Garcia-Martin LO, Lopez, JS (1992) Influence of seasonal environmental changes on the gamete production and biochemical composition of Crassostrea gigas (Thunberg) in suspended culture in El Grove Galicia Spain. J Exp Mar Biol Ecol 155: 249-262.
- Berthelin C, Kellner K, Mathieu M (2000) Storage metabolism in the Pacific oyster (Crassostrea gigas) in relation to summer mortalities and reproductive cycle (west coast of France). Comp Biochem Physiol 125B: 359-369.
- Rodríguez-Jaramillo C, Hurtado M, Romero-Vivas E, Ramírez JL, Manzano M (2008) Gonadal development and histochemistry of the tropical oyster, Crassostrea corteziensis (Hertlein, 1951) during an annual reproductive cycle. J Shellfish Res 27: 1129-1241.
- García-Corona JL, Rodríguez-Jaramillo C, López-Carvallo A, Saucedo PE, Mazón K, et al. (2018) Internal energy management associated with seasonal gonad development and oocyte quality in the horsemussel Modiolus capax (Bivalvia;Mytilidae). J Shellfish Res 37: 1-9.
- Suzuki T, Hara A, Yamaguchi KMK (1992) Purification and immunolocalization of a vitellin-like protein from Pacific oyster Crassostrea gigas. Mar Biol 113: 239-245.
- Vermes I, Haanen C, Steffens-Nakken H, Reutelingsperger C (1995) A novel assay for apoptosis. Flow cytometric detection of phosphatidylserine expression on early apoptotic cells using fluorescein labelled Annexin V. J Immunol Methods 184: 39-51.
- Song L, Wang L, Qiu L, Zhang H (2010) Bivalve immunity Adv Exp. Med Biol 708: 44-65.
- Estrada N, Velázquez E, Rodríguez-Jaramillo C, Ascencio F (2013) Morphofunctional study of hemocytes from lions-paw scallop Nodipecten subnodosus. Immunobiology 218: 1093-1103.
- Allam B, Raftos D (2015) Immune responses to infectious diseases in bivalves. J Invertebr Pathol 131: 121-136.
- Bayne CJ (2003) Origins and evolutionary relationships between the innate and adaptive arms of immune systems. Integr Comp Biol 43: 293-299.
- Rahman MA, Henderson S, Miller-Ezzy P, Li XX, Qin JG (2019) Immune response to temperature stress in three bivalve species: Pacific oyster Crassostrea gigas, Mediterranean mussel Mytilus galloprovincialis and mud cockle Katelysia rhytiphora. Fish Shellfish Immunol 86: 868-874.
- Zhang L, Li L, Zhu Y, Zhang G, Guo X (2014) Transcriptome Analysis Reveals a Rich Gene Set Related to Innate Immunity in the Eastern Oyster (Crassostrea virginica). Mar Biotechnol 16: 17-33.
- Hégaret H, Wikfors GH, Soudant P (2003) Flow cytometric analysis of haemocytes from eastern oysters, Crassostrea virginica, subjected to a sudden temperature elevation. J Exp Mar Biol Ecol 293: 249-265.
- Samain JF, Dégremont L, Soletchnik P, Haure J, Bédier E, et al. (2007) Genetically based resistance to summer mortality in the Pacific oyster (Crassostrea gigas) and its relationship with physiological, immunological characteristics and infection processes 268: 227-243.
- Huvet A, Normand J, Fleury E, Quillien V, Fabioux C, et al. (2010) Reproductive effort of Pacific oysters: A trait associated with susceptibility to summer mortality. Aquaculture 304: 95-99.
- Fleury E, Barbier P, Petton B, Normand J, Thomas Y, et al. (2020) Latitudinal drivers of oyster mortality: Deciphering host, pathogen and environmental risk factors. Sci Rep 10: 1-12.
- Samain J, McCombie H (2008) Summer mortality of Pacific oyster Crassostrea gigas. Ed. Ifremer/Quae Versailles 332.
- Malham SK, Cotter E, O’Keeffe S, Lynch S, Culloty SC, et al. (2009) Summer mortality of the Pacific oyster, Crassostrea gigas, in the Irish Sea: The influence of temperature and nutrients on health and survival. Aquaculture 287: 128-138.
- Wendling CC, Wegner KM (2013) Relative contribution of reproductive investment, thermal stress and Vibrio infection to summer mortality phenomena in Pacific oysters. Aquaculture 412: 88-96.
- Chavez-Villalba J, Lopez-Tapia M, Mazon-Suastegui J, Robles-Mungaray M (2005) Growth of the oyster Crassostrea corteziensis (Hertlein, 1951) in Sonora, Mexico. Aquac Res 36: 1337-1344.
- Mazón-Suástegui JM, Ruíz-García MC, Chávez-Villalba J, Rodríguez-Jaramillo C, Saucedo PE (2011) Analysis of growth and first reproduction of hatchery-reared juvenile Cortez oyster (Crassostrea corteziensis) in northwestern Mexico: Proposal of a minimal fishing size. Aquac Res 42: 1558-1568.
- Rodríguez-Jaramillo C, García-Corona JL, Zenteno-Savín T, Palacios E (2022) The effects of experimental temperature increase on gametogenesis and heat stress parameters in oysters: Comparison of a temperate-introduced species (Crassostrea gigas) and a native tropical species (Crassostrea corteziensis). Aquaculture 561: 738683.
- Emde B, Heinen A, Gödecke A, Bottermann K (2014) Wheat germ agglutinin staining as a suitable method for detection and quantification of fibrosis in cardiac tissue after myocardial infarction. Eur J Histochem 58: 315-319.
- Kuo JCH, Ibrahim AEK, Dawson S, Parashar D, Howat WJ, et al. (2016) Detection of colorectal dysplasia using fluorescently labelled lectins. Sci Rep 2-10.
- Zar JH (2010) Biostatistical Analysis. 5th Edition, Prentice-Hall/Pearson, Upper Saddle River xiii 944.
- Hector A (2015) The New Statistics with R: An Introduction for Biologists (1st ed.). New York, Oxford University Press.
- Hurtado M, Racotta IS, Arcos F, Morales-Bojórquez E, Moal J, et al. (2012) Seasonal variations of biochemical, pigment, fatty acid, and sterol compositions in female Crassostrea corteziensis oysters in relation to the reproductive cycle. Comp Biochem Physiol 163B: 173-183.
- Focarelli R, La Sala G, Balasini M, Rosati F (2001) Carbohydrate-Mediated Sperm-Egg Interaction and Species Specificity: A Clue from the Unio elongatulus Model. Cells Tissues Organs 168: 76-81.
- Beninger PG (2017) Caveat observator: the many faces of pre-spawning atresia in marine bivalve reproductive cycles. Mar Biol 164: 1-12.
- Cáceres-Puig JI, Abasolo-Pacheco F, Mazón-Suastegui JM, Maeda-Martínez AN, Saucedo PE (2007) Effect of temperature on growth and survival of Crassostrea corteziensis spat during late-nursery culturing at the hatchery. Aquaculture 272: 417-422.
- Walne PR (1979) Culture of bivalve molluscs: 50 years' experience at Conwy. Farnham Surrey Fishing News Books.
- Hurtado M, Ramírez JL, Rodríguez-Jaramillo C, Tovar D, Ibarra AM, et al. (2009) Comparison of continuous and batch feeding systems on maturation, biochemical composition and immune variables of the oyster Crassostrea corteziensis (Hertlein 1951). Aquac Res 40: 464-472.
- Dupré E, Gómez D, Araya A, Gallardo C (2012) Role of egg surface glycoconjugate in the fertilization of the rock shrimp Rhynchocinetes typus (Milne-Edwards, 1837). Lat Am J Aquat Res 40: 22-29.
- Rodríguez-Jaramillo C, Ibarra AM, Soudant P, Palacios E (2017) Comparison of quantitative gonad maturation scales in a temperate oyster (Crassostrea gigas) and a sub-tropical oyster (Crassostrea corteziensis). Invertebr Reprod Dev 61: 147-156.
- Le Pennec M, Beninger P, Dorange G, Paulet Y (1991) Trophic Sources and Pathways to the Developing Gametes of Pecten maximus (Bivalvia: Pectinidae). J Mar Bio Ass 71: 451-463.
- Aguirre-Rubí J, Luna-Acosta A, Ortiz-Zarragoitia M, Zaldibar B, Izagirre U, et al. (2018) Assessment of ecosystem health disturbance in mangrove-lined Caribbean coastal systems using the oyster Crassostrea rhizophorae as sentinel species Sci Total Environ 618: 718-735.
- Mullainadhan P, Renwrantz L (1986) Lectin-dependent recognition of foreign cells by hemocytes of the mussel, Mytilus edulis. Immunobiology 171: 263-273.
- Vasta GR, Feng C, Tasumi S, Abernathy K, Bianchet MA, et al. (2020) Biochemical Characterization of Oyster and Clam Galectins: Selective Recognition of Carbohydrate Ligands on Host Hemocytes and Perkinsus Parasites. Front Chem 8: 1-15.
- Chu FLE, Lapeyre JF, Burreson CS (1993) Perkinsus marinus infection and potential defense-related activities in eastern oysters Crassostrea virginica: Salinity effects. J Invertebr Pathol 62: 226-232.
- Hégaret H, Wikfors G, Soudant P, Delaporte M, Alix J, et al. (2004) Immunological competence of eastern oysters, Crassostrea virginica, fed different microalgal diets and challenged with a temperature elevation. Aquaculture 234: 541-560.
- Gagnaire B, Frouin H, Moreau K, Thomas-Guyon H, Renault T (2006) Effects of temperature and salinity on haemocyte activities of the Pacific oyster, Crassostrea gigas (Thunberg). Fish Shellfish Immunol 20: 536-547.
- Lango-reynoso F, Chávez-Villaba J, Le Pennec M (2006) Reproductive patterns of the pacific oyster Crassostrea gigas in france. Invertebr Reprod Dev 49: 41-50.
- Dutertre M, Beninger PG, Barillé L, Papin M, Haure J (2010) Rising water temperatures, reproduction and recruitment of an invasive oyster, Crassostrea gigas, on the French Atlantic coast. Mar Environ Res 69: 1-9.
Citation: Jaramillo CR, García-Corona JL, Estrada N, Palacios E (2023) Changes in Carbohydrates and N-Acetylglucosamine (Glcnac) In Response to an Experimental Increase of Temperature in Tissues of Two Oyster Species, the Temperate Introduced Crassostrea Gigas and the Native Tropical Crassostrea Corteziensis. J Aquac Fisheries 7: 56.
Copyright: © 2023 Carmen Rodríguez-Jaramillo, et al. This is an open-access article distributed under the terms of the Creative Commons Attribution License, which permits unrestricted use, distribution, and reproduction in any medium, provided the original author and source are credited.