Chemical and Consumer Acceptance of Soymilk Enriched Rice Based Masa
*Corresponding Author(s):
Ogori AFDepartment Of Home Science And Management Faculty Of Agriculture, Federal University Gashua, Gashua, Yobe State, Nigeria
Email:ogorifaradayadanu@gmail.com
Abstract
Chemical and Consumer Acceptance of Soymilk enriched rice-based masa was investigated. The source rice for this was cleaned , sorted , soaked and wet milled with soybean milk prepared separately was added at various proportion .Sample A serving as control( 100% rice only), sample B ( 95%rice ;5%soymilk, Sample C at 90%rice ;10%soymilk) , Sample D (85%rice ;15% soymilk and Sample E 80%;20%soymilk).The chemical composition revealed that micro nutrients increased with sample blending .Vitamin C ranged from 1251.6-7710.5mg/kg, β-carotene increased from (2.22-2.25)mg/kg, calcium also increased from (3.41- 6.92)mg/kg, Iron (0.34 1.02)mg/kg,Mg (0.31-8.07)mg/kg and P (0.24-0.75)mg/kg.Proximate value similarly increased as blend ration increased from (47.28-53.87)% on moisture content, crude protein content (0.140-0.783)%,Fat content (16.30-20.24)% and Ash content( 0.156-0.577)% respectively. However, Carbohydrate value decreased with blending (308.42-285.64) %. Consumer preferred masa samples with more soymilk enrichment for characteristic taste, aroma, texture, and overall acceptability. Rice masa enriched soymilk before baking or frying could alleviate protein energy malnutrition and could reduce hidden hunger in rural children as well as displaced people in any violence turned communities.
Keywords
Acceptance; Chemical; Consumer; Enrichment; Masa; Soymilk; Rice
Introduction
Masa, a fermented traditional food could also be made from rice. This fermented, traditional pan fried masa is a delicacy commonly found in the Northern part of Nigeria, but lightly appreciated in the southern and western parts of Nigeria [1]. Rice masa is a cereal based food served as breakfast and snakes [2,3]. Single cereal based food or products are commonly low in protein and micronutrient to complement adequacy of nutrition [4] in which rice massa is no exception. Fermentation is a redox reaction and one of the methods of food processing, hence extends the shelf-life of food materials [5], and improves rheological properties of food [6]. Fermentation also improves nutrient absorption of nutrient by enzymatic splitting of large biological molecules especially in plant food matrixes that are not digestible by humans into simpler sugars and sugar derivatives [7].
People life styles and changing dietary pattern have led to the increasing precedence of diseases. Hence Supplementation, Enrichment and Functional foods can help prevent and treat such disease prevalence and problems [8-10]. These days, consumers view foods as functional [11,12]. Protein Energy malnutrition proliferate amongst children and could further increase because of the Covid -19 pandemic which has hampared and altered cultural orientation, farming attitude and economy of nations. This PEM problem has been attached to animal protein sources to alleviate the menace of PEM from our society. However animal source are expensive and readily available and inaccessible by rural dwellers especially the Northern part of the country; accidentally where masa delicacies are much desired. Soya milk drink is limited by beany flavour,off flavour and trypsin binding factor from inadequacy of processing. Conversely, soymilk has high nutrient density with adequate protein profiles. The incorporation of soymilk into rice masa before pan frying; could make rice masa a functional snack that may increase consumer acceptance , increase bio nutrient matrix ,reduce beany and off flavours as well as inactive further, trypsin inhibitors. The study on masa enriched with legumes has been extensively studied but study on rice masa enriched with soymilk is scanty. To our best knowledge, the enrichment of soymilk with rice masa has not been studied. Herein, some chemical and consumer acceptance were investigated. It is expected that this enrichment could result in a bioactive composite and functional food with promising nutritional and consumer acceptable qualitie
Materials And Methods
Materials
Local white rice orzya sativa soya bean glycine max, baking yeast, bakng powder sugar, onion, salt and vegetable oil were purchased from wurukum market in Benue state, Nigeria.
Soymilk preparation
The method of [13] was adopted. The soybean seeds were hand sorted to remove dirt, stones and other contaminants. The soya bean seeds were soaked in clean water for6-8 hours, the outer coat robed away and wet milled and made into slurry grits with clean water. The soybean slurry grits was sieved and to obtain desired soymilk texture and the final soymilk was boiled for 15-30 minutes and cool to obtain final soy milk (Figure 1 & Figure 2) below.
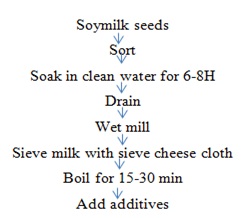 Figure 1: preparation of soymilk.
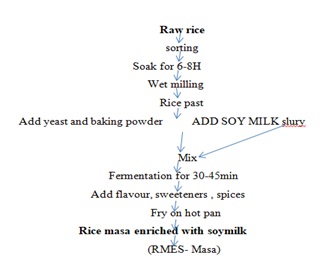 Figure 2: Preparation of Rice masa enriched with soymilk.
Methods
Vitamin and mineral analyses
Determination of β- carotene
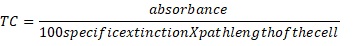
The β- carotene was determined using the AOAC method (AOAC, 2005). About 5g of the sample was transferred into a separating funnel and a solution containing 60ml of hexane, 40ml of ethanol were swirled vigorously after adding 2ml of 2% NaCl. This was then allowed to stand for 30 min after which the lower layer was runoff. The absorbance of the top layer was determined at a wavelength of 460mm using a spectrophotometer, using the equation below:
 Where,
TC: Total carotenoids (mg)
Molar extinction coefficient (∑) = 15 X 10-4
Specific extinction coefficient (∑) = (∑X molar mass of β- carotene)
Molar mass of β- carotene = 536.88g/mol
Path length of cell = 1cm
Determination of vitamin C
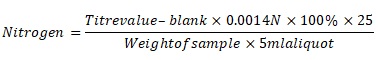
The vitamin C was determined using the method described by Helmenstine (2008). In order to actualise the Vitamin C, a blank solution (25ml) made from sample and 10 drops of starch solution added. The mixture was titrated with iodine solution until the first black blue color, which persisted for about 20s. Blended juice samples (25ml) were titrated exactly the same way as the standard solution. The initial and final volume of iodine solution required to produce the color change at the end points were recorded, through which the vitamin C was determined.
Determination of calcium and magnesium
Mineral composition (specific to Ca and Mg) were determined by acid digestion method (AOAC, 1990). Ash obtained after incineration at 600°C was dissolved in 5ml HCl solution and transferred into a 50ml volumetric flask. The resulting solution was made to mark with distilled water. The mineral contents were then measured using atomic absorption spectrophotometer (AAS).
Determination of potassium and Iron
The mineral elements such as Potassium and Iron were determined using the method by (AOAC ,1990) One gram of each sample was weighed into a 100 mL round bottom flask, and 5 mL of perchloric acid was added and heated over an electric heater in a fume chamber until the solution becomes colorless. Each of the solutions was made up to 10 mL mark with distilled water and the diluted sample set aside for further studies. The Potassium and Iron content were analyzed using the Atomic Absorption Spectrophotometer
Proximate analyses
Determination of moisture
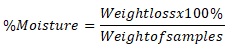
Moisture content is determined by the AOAC method (AOAC, 1990). Cleaned crucible is dried in the oven at 100°C for 1 h to constant weight and then cooled in the desiccator. Approximately 2 g of the samples were weighed into the crucible and dried at 100oc to a constant weight and calculated thus:
 Determination of crude protein
Crude protein was determined using the AOAC method (AOAC, 1990) with slight modifications. Approximately 1 g of the sample was place with of selenium catalyst ,in the micro Kjeldahl digestion flask. The mixture was digested to clean clear solution. The flask was cool then diluted with distilled water to 50ml mark of conical flask and 5 ml of the mixture transferred into distillation apparatus, and 5 of 2% boric acid added unto 100 capacities conical flask (the receiver flask) with 4 drops of methyl red indicator. Then, adding 50% of NaOH constantly to the digested sample until the solution turned cloudy, indicating the solution achieving alkalinity. Distillation was carried out in the boric acid solution at the receiver flask. During the distillation process, the pink color of the solution in the receiver flask turned blue indicating the presence of ammonia. The resulting solution in the conical flask was then titrated with 0.1M HCL and the protein content calculated as below:
% Nitrogen × 6.25(1ml of 0.1N HCL = 0.0014gN)
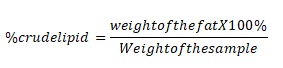
 Determination of Crude fat
Crude fat was determined using the AOAC method (AOAC, 1990) with slight modifications. The 100 ml beaker used were washed and dried in an oven for one 1 h at 105 °C, thereafter cooled in a desiccator and weighed. Approximately 10 ml of the samples, mixed with hexane in a separating funnel, and organic layer transferred into the pre-weighed beaker, subject to water bath, and thereafter weighed. The crude fat was determined using the equation below:
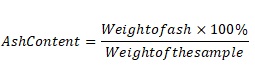
 Determination of ash
The ash content was determined from the loss in weight during incineration following the AOAC method (AOAC, 2005) with slight modifications. This method allows the entire organic matter to be burnt off, without the appreciable decomposition of the ash constituent. Approximately 5 g of samples were placed in the incinerator. The ashing was done at 600 °C for 6 h, and calculated using the equation below:
 Sensory analysis
The enriched rice massa cake with soymilk were subjected to sensorial analysis. This was done with the help of ten (10) panelists, comprising of students and staff of the College of Food Technology and Human Ecology Food Science and Technology Department, Federal University of Agriculture Makurdi. These panelists underwent sensorial training before their participation at the study. Each panelist was provided with adequate space, to without any co-operation with another in the process of sampling the freshly prepared enriched rice masa cake. The sensory attributes were based on color, flavor, taste and overall acceptability. Each sensory attribute was on a 9-point Hedonic scale with the least value (1) designated as ‘disliked extremely' and the highest value (9) designated as ‘liked extremely’ [14].
Statistical analysis
One-way analysis of variance (ANOVA) was used to analyse the data. The results were presented in terms of mean values ± standard deviation (SD) from duplicate measurements. The Fisher’s Least Significant Difference (LSD) was used to resolve means. The probability level of statistical significance was set at p < 0.05 (95% confidence interval). IBM SPSS software (version 22.0) was used to run the data analysis.
Results and Discussion
Proximate composition of rice based masa enriched with soy milk
The approximate composition of traditionally prepared masa and enriched masa is shown in table 1.The moisture content of the masa increased and ranged from 47.28 (sample R95:SM5) to 53.89% (sample R80; SM20) which could be as a result of the high moisture content of soymilk.There was an increase in the protein content due to the fact that soymilk is a good source of protein. Increased protein content increased significantly (p<0.05), the increase ranges from 0.140 (sample R100; SM0) to 0.783% (sample R80; SM20). Thses value quite agreed with total free amino acid of masa samples between 3.92 - 12.87 mg glycine/g during the period of fermentation on massa froma maize and acha cereal [15]. This observation according to [15] asserts that total free amino acid increased with increase in soybean milk fortification. Soybean contains protein with good amino acid profile [16]. Protein is needed for the building of blocks of the body, necessary for growth and repairs of won tissue (Wadlaw, 2004). Masa product increase in total free amino acid is attributed to hydrolysis of protein moieties and the actions of proteolytic enzymes during fermentation. Process of masa making increase in soluble protein which could improves digestibility of food by increasing absorbable proteins in the body [17]. The fat content f masa samples varied significantly (p<0.05) ranging from 16.30 (sample A) to 20.24% (sample E) high fat associated with the high fat produced by the soymilk.The ash content increased from 0.156 (sample R100:SM0) to 0.577% (sample R80:SM20) with significant increase (p<0.05). the ash content shows the presence of mineral in a food substance.Crude fiber decreased across the samples having the lowest value of 0.001% in sample E and the highest value of 0.016% in sample R100:SM00, and carbohydrate also decreases across the samples from 36.17 (sample R100:SM0) to 24.52% (sample R80:SM20).
|
Sample |
Moisture |
protein |
Fat |
Crude Fibre |
Ash |
Carbohydrate |
|
R100:SM0 |
47.28c+_1.18 |
0.140c+_0.03 |
16.30d+_0.28 |
0.016a+_0.008 |
0.156b+_0.001 |
36.17a+_1.54 |
|
R95:SM5
|
6.87c+_0.46
|
0.379b+_0.03
|
16.75cd+_0.21
|
0.015a+_0.007
|
0.404ab+_0.065
|
35.57a+_0.33 |
|
R90:SM10 |
49.69c+_0.01 |
0.389b+_0.12 |
17.20c+_0.14 |
0.012ab+_0.001 |
0.494a+_0.024 |
32.21b+_0.22 |
|
R95:SM15 |
50.79b+_0.76 |
0.609a+_0.07 |
18.22b+_0.14 |
0.011ab+_0.001 0. |
554a+_0.217 |
29.78c+_0.72 |
|
R80:SM20 |
53.89a+_0.01 |
0.783a+_0.11 |
20.24a+_0.21 |
0.001a+_0.001 |
0.577a+_0.036 |
24.52c+_0.11 |
|
LSD |
1.70 |
0.215 |
0.52 |
0.01 |
0.27 |
2.01 |
Table 1: Proximate Composition of Rice Masa enriched with soymilk.
Values are mean+_ standard deviation of two replications
Means with different superscript within the same column are significantly different at p>0.05
Where
R100:SM0=100% Rice: 0%Soymilk
R95:SM5=95% Rice: 5%Soymilk
R90:SM10=90% Rice: 10%Soymilk
R95:SM15=95% Rice: 15%Soymilk
R80:SM20=80% Rice: 20%Soymilk
Mineral and vitamin composition of rice based masa enriched with soymilk
The result of mineral composition of rice based masa enriched with soymilk is represented in table 2. The vitamin (C) content of masa increased from 1251 (sample R100:SM0) to 7710.55mg/kg (sample R80:SM20)The calcium content of masa produced ranged between 3.41 (sample R100:SM0) and 6.52mg/kg (sample R80:SM20). This is due to the high calcium content of soymilk.The magnesium content ranged between 0.31 (sample R100; SM0) and 8.07 mg/kg (sample R80:SM20). it was observed that the magnesium content increased with the increase in soymilk which is as a result of the high content of magnesium in soymilk.The phosphorus content of the control (sample R10:SM0) was 0.24 and it kept increasing across the table. The increase is as a result of the high content of phosphorus in soymilk. [18] National Nutrient data base.
|
Sample |
VitaminC (mg/100g) |
B-carotene (mg/100g) |
Ca (mg/kg) |
Fe (mg/kg) |
Mg (mg/kg) |
P(mg/kg) |
|
R100:SM0 |
1251d.60+_26.30 |
2.22a+_0.03
|
3.41e+_0.01
|
0.34e+_0.01
|
0.31e+_0.01
|
0.24c+_0.01
|
|
R95:SM5
|
1523c.15+_0.03 |
2.23a+_0.03 |
4.43d+_0.11
|
0.41d+_0.03
|
1.23d+_0.04
|
0.36c+_0.04
|
|
R90:SM10 |
3049.95c+_1.91 |
2.24a+_0.01 |
5.53c+_0.04 |
0.64c+_0.03 |
3.22c+_0.02 |
0.52b+_0.02 |
|
R95:SM15 |
3074b.30+_36.5 |
2.24a+_0.01 |
6.52b+_0.03 |
0.82b+_0.04 |
3.41b+_0.01 |
0.57b+_0.02 |
|
R80:SM20 |
7710.55a+_126.51 |
2.25a+_0.01 |
6.93a+_0.03 |
1.02a+_0.01 |
8.07a+_0.06 |
0.75a+_0.04 |
|
LSD |
154.28 |
0.05 |
0.14 |
0.06 |
0.08 |
0.08 |
Table 2: Micronutrient Composition of Rice Masa Enriched with soymilk.
Values are mean+_ standard deviation of two replications
Means with different superscript within the same column are significantly different at( p>0.05
Where
R100:SM0=100% Rice: 0%Soymilk
R95:SM5=95% Rice: 5%Soymilk
R90:SM10=90% Rice: 10%Soymilk
R95:SM15=95% Rice: 15%Soymilk
R80:SM20=80% Rice: 20%Soymilk
Sensory attributes of rice based masa enriched with soymilk
The result of the sensory evaluation of rice based masa enriched with soymilk I represented in table 3.The appearance of the masa varied in the values recorded with sample R80:SM20 (85% rice, 15% soymilk) having the worst appearance and sample R95:SM5 (95% rice, 5% soymilk) having the best appearance [19,20]. According to the panellist the value of aroma ranged from 6.73 to 7.00. The sample R85:SM15 (85% rice, 15% soymilk) having the best value. This could be as a result of the processing method. Fermentation improves the flavor of food and sample R90:SM10 (90% rice and 10% soymilk) and R80:SM20 (80% rice and 20% soymilk) having the lowest value.The value of the taste ranged from 6.20 (sample R90;SM10) to 7.40 (sample R100;SM0), while sample R90:SM10 (90% rice and 10% soymilk) had the best value of 6.07 for mouth feel and sample R95:SM5 (95% rice, 5% soymilk) had the best value of 7.00Sample (control) was rated the best by panellist and sample R95:SM5 and R90;SM10 the most disliked [21].
|
Sample |
Appearance |
Aroma |
Taste |
Mouth feel |
General acceptability |
Appearance |
|
R100:SM0 |
6.87ab |
6.80ac |
7.40a |
6.13a |
7.87b |
6.87ab |
|
R95:SM5
|
7.47a
|
6.80a
|
7.33a
|
7.00a
|
6.73b
|
7.47a
|
|
R90:SM10 |
7.13ab
|
6.73a
|
6.20b
|
6.07a
|
6.73b
|
7.13ab
|
|
R95:SM15 |
6.53b |
7.00a |
7.07a |
6.87a |
7.60ab |
6.53b |
|
R80:SM20 |
6.93ab |
6.73a |
7.13a |
6.80a |
7.60ab |
6.93ab |
|
LSD |
0.75 |
0.95 |
0.81 |
1.21 |
1.02 |
0.75 |
Table 3: Sensory Attributes of Rice Masa Enriched with soymilk.
Values are mean+_ standard deviation of two replications
Means with different superscript within the same column are significantly different at ( p>0.05
Where
R100:SM0=100% Rice: 0%Soymilk
R95:SM5=95% Rice: 5%Soymilk
R90:SM10=90% Rice: 10%Soymilk
R95:SM15=95% Rice: 15%Soymilk
R80:SM20=80% Rice: 20%Soymilk
Conclusion
The study on rice based masa enriched with soymilk shows that with the addition of soymilk there was an increase in moisture content, fat content, ash content, protein content, and vitamin C content of the product. The micronutrient and macro nutrients was also observed favourable to fried mass when soybean were added to rice based masa.These development could arrest protein energy in -balance in rural settings that has mass as a snack and main menu. The result also revealed product generally acceptability by selected panellist.
References
- Aletor O, Ojelabi A (2007) Comparative Evaluation of Nutritive and Functional Attributes Of Some Traditional Nigerian Snacks and Oil Seed Cakes. Pakistan J of Nutr 6: 99-103.
- Ayo JA, Agu H, Ayo VA, Tamoriyo OF (2008) Effect of Groundnut Paste on the Quality of Maize Based Masa. Pakistan J of Nutr 7: 557-560.
- Igwe EC, Oyebode YB, Dandago MA (2013) Effect of Fermentation Time and Leavening Agent on the Quality of Laboratory Produced and Market Samples of Masa (A Local Cereal Based Puff Batter). African J of Food Agr Nutrition and development 13: 8415-8427.
- Nkama I, Malleshi NG (1998) Production and Nutritional Quality of Traditional Nigerian Masa from Mixtures of Rice, Pearl Millet, Cowpea, and Groundnut. Food and Nutr Bull 19: 366-373.
- Isabel CA, Alexandra N, Lola FD, Antonio B, Ivonne D, et al. (2005) Sorghum Fermentation Followed By Spectroscopic Techniques. Food Chemistry 90: 853-859.
- Hammes WP, Markus JB, Kerstin L, Francis JR, Michael FHS, et al. (2005) Microbial ecology of cereal fermentations. Trends in Food Science and Technology 16: 4-11.
- Parker R, Pace M, Kenny K (2018) Introduction to Food System Science. National Agriculture Institute Inc.
- Florentino R (2001) Experiences on Rice Fortification in the Philippines. In Proceedings of Conference on Forging Effective Strategies to Combat Iron Deficiency, Atlanta, Georgia 7-9.
- Bouis H (1996) Enrichment of food staples through plant breeding a new strategy for fighting Micronutrient malnutrition. Nutr Re 5:131-137.
- Fagan R, Arner T (1995) Epi-Info, Version6. A word processing data base and Statistics program for public health on IBM compatible microcomputers. Center for Disease Control and Prevention, Atlanta demand of Nigeria with improved Technologies. Nantl Cereal Research.
- Siro IE, Kápolna BK, Lugasi A (2008) Functional food. Product development, marketing and consumer acceptance-a review. Appetite 5: 456-467.
- Corbo MR, Bevilacqua A, Petruzzi FPC, Sinigaglia M (2014) Functional beverages: The emerging side of functional foods. Comprehensive reviews in food science and food safety 13: 1192-1206.
- Nelson ML, Busboom JR, Cronrath JD, Falen L, Blankenbaker A, et al. (2000) Effects of graded levels of potato by-products in barley- and corn-based beef feedlot diets: I. Feedlot performance,carcass traits, meat composition, and appearance. J Anim Sci 78: 1829-1836.
- Iwe MO (2002) Handbook of Sensory Methods and Analysis. Rojoint Communication Services Ltd, Uwani-Enugu.
- Malomo AA, Sumbo HA, Hezekiah AA ( 2019) Effects of substitution of acha and soybean on αlpha-amylase activity, sugars and total free amino acid during production of maize J microbiol biotech food sci 20: 534-538.
- Ikujenlola AV (2014) Chemical and Functional Properties of Complementary Food Blends from Malted and Unmalted Acha (Digitaria exilis) Soybean (Glycine max) and Deffated Sesame (Sesame indicus L) Flours. African Journal of Food Science 8: 361-367.
- Ng’ong’ola-Manani TA, Østlie HM, Mwangwela AG, Wicklund T (2014) Metabolite Changes during Natural and Lactic Acid Bacteria Fermentations in Pastes of Soybeans and Soybean-Maize Blends. Food Sci and Nutr 2: 768-785.
- USDA (2008) USDA commodity requirements. CSB 13 Corn soy blend for use in export programs. Accessed November 23rd, 2015.
- Mahesh MS, Mahima VG, Patil K (2011) A comparative evaluation of film and digital panoramic radiographs in the assessment of position and morphology of impacted mandibular third molars Indian. J Dent Res 22: 219-224.
- Philip TK, Itodo IN (2012) Demographic Characteristics Agricultural and Technological Profile of Acha Farmers in Nigeria. Agricultural Engineering International: CIGR Journal 14:1.
- Poutanen K (1997) A Review: Enzymes: An Important Tool in the Improvement of the quality of cereal foods.
Citation: Amove J, Ogori AF (2022) Chemical and Consumer Acceptance of Soymilk Enriched Rice Based Masa. J Food Sci Nutr 8: 144.
Copyright: © 2022 Amove J, et al. This is an open-access article distributed under the terms of the Creative Commons Attribution License, which permits unrestricted use, distribution, and reproduction in any medium, provided the original author and source are credited.