Correlation Study between Onset of Nafld with Physiological Parameters among Populations of Kolkata and Suburbs Facing Rapid Urbanization
*Corresponding Author(s):
Susmita ChandraMaulana Abul Kalam Azad University Of Technology, WB, India
Email:susmitachandra2506@gmail.com
Abstract
Background: NAFLD is associated with the fat accumulation and liver inflammation. The objective of this study was to determine the role of fried food for liver fat accumulation and progression of NAFLD. All the procedures were performed after Institutional Ethical clearance.
Results: Patients with other hepatic disorders, diabetes, improper levels of liver function components. Consumption of deep fried food is found to be directly correlated to the onset of fat in the liver. Most of the patients are showing a positive correlation while some of the patients diagnosed NAFLD without regular habit of deep fried food consumption. On the other hand a group of normal participants were showing interesting results because they consume fried food regularly but without any symptom of NAFLD.
Conclusion: The fatty liver condition has an association with High FBS and impaired Lipid profile, but all diabetics and obese people not found to develop NAFLD.
Keywords
Deep fried food; FBS; HDL; LDL; NAFLD
Abbreviations
NAFLD: Non Alcoholic Fatty Liver Disease
NASH: Non Alcoholic Steato Hepatities
TG: Tri Glyceride
HDL: High Density Lipoprotein
LDL: Low Density Lipoprotein
ALP: Alkaline Phosphatase
TPro: Total Protein
LFT: Liver Function Test
Introduction
A number of recent studies showed that elevated levels of cholesterol, triglycerides, and glucose are significant risk factors, for obesity and take a significant role in the development of fatty liver disease (NAFLD) which is not associated with alcohol consumption but related to high fat diet [1,2].
A major change in the lifestyle and food habit plays a role in changing the metabolic profile of individuals. In Eastern part of India there is rapid urbanization is on the way for the past 30 years [3,4]. As aresult there has been a significant change in cholesterol levels and the lipid metabolism profile among people [5,6]. Which shows an alarming increase in the occurrence of fatty liver disease and well as mortality related to it in these semi urban areas of Bengal. Lipid levels can directly reflect the nutritional patterns [6,7]. The ingestion of saturated and trans fatty acids and high dietary cholesterol along with consumption of less fruits, vegetables and sufficient resistant starch can influence altered levels of low-density and high-density lipoprotein cholesterol and leading to fatty liver disease [8,9].
We took up the hypothesis that rural populations of our countries who are facing rapid urbanization around the Bay of Bengal, the incidence of high glucose, cholesterol, and triglyceride levels in the consumers’ blood should be significantly higher, compared to rural populations, because the rural food habit is much more rich in vegetables [10,11]. In rapidly growing area the first generation in the family facing urbanization, can face significant change in food habit which includes fried and processed packaged ready to eat and ready to fry foods., which resulted in significant change in their metabolic pattern [12-14]. It also brought a significant change in their physiological condition which led to a similar pattern for urban people [15,16].
Regarding the processed food it is found that in most of the cases the food available in the local market in these regions does not meet all the nutritional safety aspects as prescribed by the food safety authorities. And people prefer the lower price and compromise on quality of food and its safety level [17,18].
Different types of deep fried food are highly popular in most part of India. Specially food like French fries, chips, fish ball, meat ball,vegetable balls coated with batter, are eaten in deep fried form [19,20]. For deep frying industrially or locally, different types of saturated fat, palm oil, hydrogenated fatare used because of it high heat withstanding capacity and higher heat energy holding property which helps in faster frying of the food materials. But a frequent intake of such deep-fried food can be harmful to health leading to high accumulation of LDL and TG [21-23].
People in the Rapidly urbanizing areas facing such problem more profoundly because of rapid changes in their lifestyle and food habit leading to diseases like obesity, NAFLD [24,25].
The primary purpose of this study was to investigate the association between various physiological parameters of patients with suspected onset of NAFLD and compare them with different physiological parameters within different age and sex groups, in a suburban population located near Kolkata.
Material and Methods
Exclusion criterion
Individuals who had not measured the levels of glucose and cholesterol for at least 1 year prior to the study were invited through public announcement to participate in the study. The exclusion criteria were age <20 years and >85 years, body mass index between 18.5 and 30 (normal weight and pre-obese individuals, according to WHO classification [26,27]), current diagnosis of obesity, also patients using lipid-and/or glucose-lowering drugs were excluded. Patients with other hepatic disorders, diabetes, hyperthyroidism and irregular food habits were excluded from the study.
All the experiments were done after receiving Institutional Ethical clearance. The individuals were selected from the nearby suburban hospitals. A questionnaire was prepared for collecting the medical history and food habit of the individuals. Participants were selected after they gave their written consent for the experiments that will be done with the collected blood. The details of the experiments and the objectives were informed to the participants in a easier way in their familiar language prior to collecting blood.
Blood sample collection
Human fasting Blood samples were obtained between 8.00 a.m. and 10.00 a.m. after an overnight fast. The blood samples were collected by skilled techniciansonly by venous prick from the arm with a disposable syringe and needle [28-30], (about 2ml) through an aseptic sampling procedure with anticoagulant EDTA. Or the blood is collected aseptically in avacutainer and the plasma was immediately separated fordifferent tests using Diagnostic Solutions Laboratory, India using a colorimetric method. The PP blood was collected after two hours of heavy breakfast from the same patients [31,32]. The blood glucose levels were measured by an autoanalyzer and the liver function test was determined by the standard medical kits.
The participants with written consent from three groups 20-40 yrs, 40-60 yrs, 60-80 yrs, were divided into two major groups namely control group I (healthy or normal) and experimental group II (subclinical obesity and/or diabetes- stage I NASH or steatosis and Patients diagnosed with confirmed onset of Steatohepatities, NASH stage II). A thorough questionnaire was prepared which include parameters like age, sex, food habits, familial history of NAFLD and any other systemic medical problems to maintain the epidemiological data of all patients. Participants with onset of NAFLD / NASH is and their stages were identified through standard USGprocedure and clinical investigations by skilled practitioners only. Total sample collected 1076 participants. After excluding through selection criterion 1054 individuals, 694 men and 360 women (65.8% and 34.2% respectively), were included in the study. Among them 219 participants were included in the control group. In the control group 156 men and 63 women had participated. We consider this percentage adequate to provide significant evidence.
Pathophysiological and biochemical studies
Blood sugar, lipid profile, liver function test: Lipid profile and liver function test wasdoneenzymatically from Serum Triglyceride (TG), High Density Lipoprotein (HDL), Low Density Lipoprotein (LDL), Free Cholesterol (FC). AST (SGOT), ALT (SGPT), ALP, TC, High Density Lipoprotein (HDL), TAG, and SG were measured and analyzed using an automated machine, Roche Diagnostic/Hitachi 902, Germany, according to the manufacturer’s procedures. Fasting and Post Prandial blood glucose was measured by standard medical kit.. For statistical analysis P-values below 0.05 was considered to be statistically significant Analyses was performed using latest versions of Statistica or SPSS statistical tools. Associations between patient characteristics like obesity, metabolic syndrome and their diagnosed blood or liver components of the NASH variables (steatosis, lobular inflammation, and ballooning) was also examined. Insulin levels and also HBA1c were also checked using standard methods and medical kits [33,34].
Statistical analysis
Experimental data was expressed as mean±SD along with significance level and analyzed by SPSS22.0.0.0. The completed data forms were analyzed using Microsoft Excel 2007 for Windows (Microsoft Corporation, Redmond, WA, USA) The differences in the mean values in terms of age groups were assessed by the analysis of covariance method [35].
Results
The mean value of serum fasting glucose level was 122.28+8.75mg/dL for 20-40 yrs. group, 132.34+4.81 for 40-60 yrs group and 125.54+20.45mg/dL for 60-80 years patient group. No significant difference found between men and women (men 122.38±12.43 and women 120.61±12.59. P=0.056) (Table 1).
|
Clinical Parameters |
Value |
|
Male |
56% |
|
Female |
44% |
|
Age range |
20-80 yrs |
|
BMI (Mean) Control |
20.56+1.05 (8.5-24.9) normal range |
|
BMI (Mean) NAFLD patients |
29.5+1.05 (25.0-29.9 over weight and >30.0 obese) |
|
Age groups NAFLD participants |
Percentage on the basis of total diseased participants |
|
20-40 |
32% |
|
40-60 |
48% |
|
60-80 |
20% |
|
Age groups control participants |
Percentage on the basis of total control participants |
|
20-40 |
35% |
|
40-60 |
47% |
|
60-80 |
18% |
Table 1: General participant data and clinical characteristics in summarized form.
Other important glycemic parameter HbA1c was also obtained. No significant difference was found in the different age group (Table 2) or among male and female category.
|
Parameters / Unit |
Age Range Years |
||
|
20-40 |
40-60 |
60-80 |
|
|
FBS-fasting blood sugar mg/dL |
128.28+8.75 |
132.34+4.81 |
125.54+20.45 |
|
PPBS mg/dL |
157.35+12.83 |
184.03+10.45 |
189.82+18.66 |
|
HbA1c % (DCCT unit) |
8.42+1.37 |
10.86+0.53 |
9.01+1.86 |
|
Insulin fasting mIU/L |
8.44+0.98 |
10.1+1.20 |
10.5+2.08 |
|
Cholesterol (Chol) mg/dL |
218+8.54 |
245+ 5.36 |
235+10.56 |
|
HDL mg/dL |
55.44+6.59 |
52.56+2.83 |
50.65+8.44 |
|
LDL mg/dL |
112.48+10.19 |
142.43+8.67 |
150.86+12.22 |
|
TG mg/dL |
154.16+12.01 |
182+12.34 |
186.45+14.24 |
|
HDL/LDL |
0.80+0.09 |
0.72+0.25 |
0.76+0.08 |
|
Total bilirubin mg/dL |
0.62+0.16 |
0.72+0.08 |
0.8+0.94 |
|
SGOTunits per liter of serum |
23.16+5.45 |
26.87+3.46 |
28.59+8.54 |
|
SGPTunits per liter of serum |
38.18+4.59 |
42.74+7.64 |
40.21+10.48 |
|
ALPU/L |
89.20+6.84 |
107.86+4.76 |
115.67+12.16 |
|
Total Protein g/dL |
7.01+1.2 |
7.89+0.94 |
7.59+2.05 |
|
Albumin g/dL |
3.8+0.84 |
4.7+0.52 |
4.5+1.6 |
|
Percentage of patients in NAFLD stage I |
86% |
78% |
64% |
|
Percentage of patients in NAFLD stage II |
14% |
22% |
36% |
Table 2: Physiological, biochemical, epidemiological data of patients.
For people without diabetes, the normal range for the hemoglobin A1c level is between 4% and 6%. Among patients HbA1c levels between above 5-7% (prediabetic) and above 7% in the risk zone of developing diabeteswere found mostly among the age group >40 years.Those control participants not showing any NASH symptom but having high or borderline FBS were not included in the data during calculation.
The mean value of total serum cholesterol level was found to be very close to or above 200mg/dl in different age group. With a statistically significant difference between men and women (men 180.03±44.57, women 228.09±41.89, P=0.003) for the age range 20-60 years. Most of theparticipants with high cholesterol and LDL levels were found to be associated with the development of NAFLD or NASH stage I (P<0.05).
Also a statistically positive correlation was also established between development or Progression of NASH and blood serum glucose values (P<0.01).
Comparison between the different age groups did not reveal statistically significant differences even if for the case of glucose, TG or Cholesterol, the result was only marginal (P=0.051) and 95% CI level (Figures 1-4).
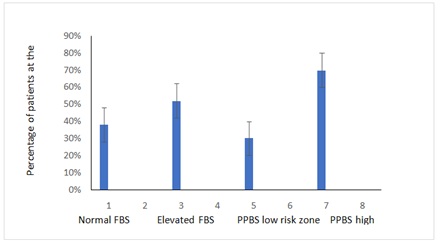 Figure 1: percentage of patients showing onset of NAFLD or NASH symptoms with different FBS and PPBS levels.
Note: Normal FBS=70-110mg/dL, Elevated FBS=>110mg/dL, PPBS low risk zone=under 140mg/dL, PPBS High Risk Zone=140 and 200mg/dl or above 200mg/dL
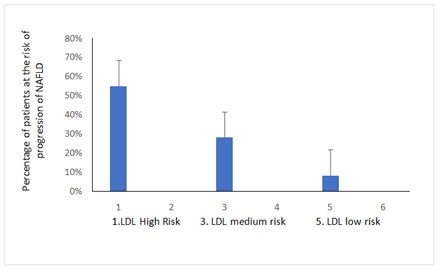 Figure 2: Percentage of patients showing onset of NAFLD or NASH symptoms with different pathophysiological parameters related to Liver function test
Note: LDL High Risk=>200mg/dL 3. LDL medium Risk=140-200mg/dL, 5. LDL low risk, 100-140mg/dL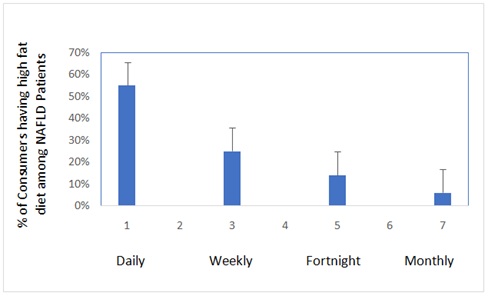 Figure 3: Percentage of patients found to Consume of deep fried Food with different frequency.
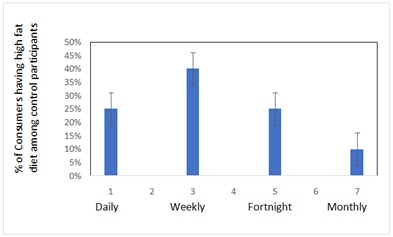 Figure 4: Percentage of control participants found to Consume of deep fried Food with different frequency.
Discussion
Those patients who are suffering from NAFLD either in stage I or stage II condition are showing threshold values of FBS and PPBS. For NAFLD identified patient group the FBS is found borderline high.
FBS and PPBS giving direct correlation with onset of NAFLD apparently but some controversy is there regarding the correlation between onset of NAFLD and lipid profile. Some of the control participants showed high LDL, Cholesterol and TG values. But there was neither any apparent symptom of occurrence of NAFLD nor any USG positive report for the onset.
The total cholesterol values were quite elevated in all the participants irrespective of age; moreover, the values were higher in women than in men. This difference in values could be attributed to the fact that women underwent blood examinations very rarely compared to men. Although LDL levels are mostly within the range but 55% patients are in the risk level I, 28.33% are in the risk level II, and 8% patients are in the category III risk zone of LDL. Surprisingly among those who did not develop NAFLD among control group also found to have LDL risk zone with 27% participants, 8% in the medium risk zone and 2% in the high-risk zone.
It was also evident from the data that people who rarely consumes deep fried food are at lower risk of high LDL formation and development of NAFLD (Table 3). There are some participant data which showed that they have LDL value within lower risk zone even after consumption of deep fried food regularly but this category of people mostly found in the control group within 20-30 yrs of age, while few of such patients with apparently low LDL showed development of NAFLD.
|
Physiological and Biochemical Parameters / Unit |
Control Group Age Range |
|||
|
20-40 |
40-60 |
60-80 |
Clinical Range |
|
|
FBS mg/dL |
90+4.56 |
96+6.44 |
98+12.45 |
70- 110 mg/dL is normal. 110 to 125 mg/dL prediabetes. 126 mg/dL or higher diabetic |
|
PPBS mg/dL |
128+8.45 |
134+10.43 |
142+12.45 |
Normal: under 140 mg/dL Impaired glucose tolerance or Pre-diabetes: between 140 and 200 mg/dL Diabetes: equal to or above 200 mg/dL |
|
HbA1c % (DCCT unit) |
5.62+1.67
|
5.86+0.93 |
5.01+1.86 |
4-6 excellent 7-8 moderate /good 9-14 poor |
|
Insulin fasting |
5.44+0.98 |
6.1+1.06 |
6.5+1.98 |
< 25 mIU/L normal |
|
Chol mg/dL |
187.44+7.2 |
201.57+10.53 |
218+12.56 |
Within 200 -normal/ideal 200-240-borderline >240 high |
|
HDL mg/dL |
78+5.44 |
65+4.63 |
62+6.78 |
30-40 -major risk 40-60 -moderate risk 60-70-minor risk /good |
|
LDL mg/dL |
110+10.45 |
130+12.22 |
128+14.34 |
100-115 - Good 115-140- Satisfactory 140-175 – Moderate Risk 175-190 -High Risk >190- Very High risk |
|
TG mg/dL |
148+8.34 |
165+7.45 |
178+6.34 |
10-150 low risk 150-200 200-350 Medium Risk 350-500 >500 High Risk |
|
HDL/LDL |
0.84+0.34
|
0.52+0.26 |
0.48+0.44 |
>0.4- good 0.4-0.3 moderate < 0.3 High risk |
|
Total bilirubin mg/dL |
0.46+0.16 |
0.48+0.08 |
0.42+0.94 |
1.2 (mg/dL) for adults |
|
SGOTunits per liter of serum |
8.22+1.75 |
11+0.96 |
10+3.22 |
8 and 45 units per liter of serum A score above 50 for men and 45 for women is high and may indicate damage. |
|
SGPTunits per liter of serum |
7+1.56 |
8+0.95 |
10+2.45 |
The SGPT normal range is about 7 to 56 units per litre of blood serum. Thus, very high level of SGPT in the blood can be an indication of damage or problems related to the liver. |
|
ALP U/L |
50+2.33 |
74+1.02 |
82+11.44 |
The normal range is 44 to 147 international units per liter (IU/L) |
|
T PRO g/dL |
7.8+ 1.65 |
8.5+2.34 |
8.1+2.45 |
The normal range is 6.0 to 8.3 grams per deciliter (g/dL) or 60 to 83 g/L |
|
ALB g/dL |
3.2+1.66 |
3.4+2.56 |
3.8+1.85 |
3.4 to 5.4 g/dL |
Table 3: Physiological, biochemical, epidemiological data from the control participants.
The problem is quitecontroversial because it may be an effect of genetic mutations of related genes, further study is to address this controversy [36,37].
Regarding HDL level most of the control are in the normal to medium risk zone while the NAFLD patients showed their HDL level are in the zone of Medium to High risk region. But the most significant correlation found between HDL/ LDL ratio with the onset of NAFLD is that when the ratio enters into the threshold HDL/LDL zone the NAFLD onset is visible.
Some of the patients showed significantly elevated levels of ALP and total protein in the higher side of the threshold risk zone, especially among stage II patients. This might indicate the disease progression towards further cell damage and edema formation [38,39]. Elevated ALP and Total protein may indicate onset of damage among 8-10 % of the patients. About glucose levels, the results emphasized the need for intensive monitoring of glucose levels in people who are unaware of their metabolic status [40].
Conclusion
The results of the study show that Food habit may be a major cause of onset of NAFLD. An increase in the prevalence of hyperglycemia and hyperlipidemia in the rapidly urbanized population is leading to the liver fat accumulation. Further a number or related studies regarding the genetic intervention and correlation with changed food habit can impose more light into the unanswered issues developed from this work.
Ethics Approval and Consent to Publication
Received.
Funding
The authors would like to thank CSIR, Govt of India for funding this project assistance to accomplish this study.
Author’s Contribution
SC conceived the project and AS supported with clinical data and testing. Both the authors were involved in developing the content.
Conflict of Interest
There is no conflict of Interest
Acknowledgement
We acknowledge the various departments of MAKAUT and Sagore Dutta Hospital for their immense support to complete the work.
References
- World Health Organization (2020) World Health Statistics. World Health Organization, Geneva, Switzerland.
- Yusuf S, Hawken S, Ounpuu S, Dans T, Avezum A, et al. (2004) Effect of potentially modifiable risk factors associated with myocardial infarction in 52 countries (the INTERHEART study): Case-control study. Lancet 364: 937-952.
- US Department of Agriculture ARS. Usda Food and Nutrient Database for Dietary Studies.
- Schaefer EJ (2002) Lipoproteins, nutrition, and heart disease. Am J Clin Nutr 75: 191-212.
- World Health Organization (2003) Diet, Nutrition and the Prevention of Chronic Diseases. World Health Organization, Geneva, Switzerland.
- National Health and Nutrition Examination Survey. Module 3: Weighting.
- Posner BM, Franz MM, Quatromoni PA, Gagnon DR, Sytkowski PA, et al. (1995) Secular trends in diet and risk factors for cardiovascular disease: The framingham study. J Am Diet Assoc 95: 171-179.
- Giugliano D, Esposito K (2008) Mediterranean diet and metabolic diseases. Curr Opin Lipidol 19: 63-68.
- Polychronopoulos E, Pounis G, Bountziouka V, Zeimbekis A, Tsiligianni I, et al. (2010) Dietary meat fats and burden of cardiovascular disease risk factors, in the elderly: A report from the MEDIS study. Lipids Health Dis 9: 30.
- Cruz JA (2000) Dietary habits and nutritional status in adolescents over Europe-Southern Europe. Eur J Clin Nutr 54: 29-35.
- World Health Organization (1995) Physical Status: The Use and Interpretation of Anthropometry, Report of a WHO Expert Committee. Geneva, Switzerland.
- Zhou F, Zhou J, Wang W, Zhang XJ, Ji YX, et al. (2019) Unexpected rapid increase in the burden of NAFLD in China from 2008 to 2018: A systematic review and meta-analysis. Hepatology 70: 1119-1133.
- Adams LA, Lymp JF, St Sauver J, Sanderson SO, Lindor KD, et al. (2005) The natural history of nonalcoholic fatty liver disease: A population-based cohort study. Gastroenterology 129: 113-121.
- Jarvis H, Craig D, Barker R, Spiers G, Stow D, et al. (2020) Metabolic risk factors andincident advanced liver disease in non-alcoholic fatty liver disease (NAFLD): A systematic review andmeta-analysis of population-based observational studies. PLoS Med 17: 1003100.
- Bugianesi E, Gastaldelli A, Vanni E, Gambino R, Cassader M, et al. (2005) Insulin resistance in nondiabetic patients with non-alcoholic fatty liver disease: Sites and mechanisms. Diabetologia 48: 634-642.
- Hong HC, Hwang SY, Choi HY, Yoo HJ, Seo JA, et al. (2014) Relationship between sarcopenia andnonalcoholic fatty liver disease: The Korean Sarcopenic Obesity Study. Hepatology 59: 1772-1778.
- Pacifico L, Perla FM, Andreoli G, Grieco R, Pierimarchi P, et al. (2020) Nonalcoholic Fatty liver diseases is associated with low skeletal muscle mass in overweight/obese youths. Front Pediatr 8: 158.
- Younossi ZM, Koenig AB, Abdelatif D, Fazel Y, Henry L, et al. (2016) Global epidemiology of nonalcoholic fatty liver disease-Meta-analytic assessment of prevalence, incidence, and outcomes. Hepatology 64:73-84.
- Tentolouris N, Lathouris P, Lontou S, Tzemos K, Maynard J (2013) Screening for HbA1c-defined prediabetes and diabetes in an at-risk greek population: Performance comparison of random capillary glucose, the ADA diabetes risk test and skin fluorescence spectroscopy. Diabetes Res Clin Pract 100: 39-45.
- Tabibloghmany F, Hojjatoleslamy M, Farhadian F, Ehsandoost E (2013) Effect of linseed (Linum Usitatissimum L.) hydrocolloid as edible coating on decreasing oil absorption in potato chips during deep-fat frying. International Journal of Agriculture and CropSciences 6: 63-69.
- Makrilakis K, Liatis S, Grammatikou S, Perrea D, Stathi C, et al. (2011) Validation of the Finnish diabetes risk score (FINDRISC) questionnaire for screening for undiagnosed type 2 diabetes, dysglycaemia and the metabolic syndrome in Greece. Diabetes Metab 37: 144-151.
- Wang Y, Si S, Liu J, Wang Z, Jia H, et al. (2016) The associations of serum lipids with vitamin D status. PLoS One 11: 0165157.
- Jiang X, Peng M, Chen S, Wu S, Zhang W (2019) Vitamin D deficiency is associated with dyslipidemia: A cross-sectional study in 3788 subjects. Curr Med Res Opin 35: 1059-1063.
- Aggarwal N, Shishu S (2011) A review of recent investigations on medicinal herbs possessing anti-diabetic properties. J Nutr Disorders Ther 1:1.
- Ahmadian M, Suh JM, Hah N, Liddle C, Atkins AR, et al. (2013) PPARγ signaling and metabolism: The good, the bad and the future. Nat Med 19: 557-566.
- Bai N, He K, Roller M, Zheng B, Chen X, et al. (2008) Active compounds from Lagerstroemia speciosa, insulin-like glucose uptake-stimulatory/inhibitory and adipocyte differentiation-inhibitory activities in 3T3-L1 cells. J Agric Food Chem 56: 11668-11674.
- Choi SM, Tucker DF, Gross DN, Easton RM, DiPilato LM, et al. (2010) Insulin regulates adipocyte lipolysis via an Akt-independent signalling pathway. Mol Cell Biol 30: 5009-5020.
- Chung A, Gurtu S, Chakravarthi S, Moorthy M, Palanisamy UD (2018) Geraniin protects high-fat diet-induced oxidative stress in Sprague Dawley rats. Front Nutr 5: 17.
- Chung YS, Ton SH, Gurtu S, Palanisamy UD (2014) Ellagitannin geraniin supplementation ameliorates metabolic risks in high-fat diet-induced obese Sprague Dawley rats. J Func Foods 9: 173-182.
- Haas B, Schlinkert P, Mayer P, Eckstein N (2012) Targeting adipose tissue. Diabetol Metab Syndr. 4: 43-43.
- Kowalska K, Olejnik A, Rychlik J, Grajek W (2014) Cranberries (Oxycoccus quadripetalus) inhibit adipogenesis and lipogenesis in 3T3-L1 cells. Food Chem 148: 246-252.
- Lee BC, Lee J (2014) Cellular and molecular players in adipose tissue inflammation in the development of obesity-induced insulin resistance. Biochim Biophys Acta 1842: 446-462.
- Lin SY, Wang CC, Lu YL, Wu WC, Hou WC (2008) Antioxidant, anti-semicarbazide-sensitive amine oxidase, and anti-hypertensive activities of geraniin isolated from Phyllanthus urinaria. Food Chem Toxicol 46: 2485-2492.
- Liu F, Kim J, Li Y, Liu X, Li J, et al. (2001) An extract of Lagerstroemia speciosa L. has insulin-like glucose uptake-stimulatory and adipocyte differentiation-inhibitory activities in 3T3-L1 cells. J Nutr 131: 2242-2247.
- Adedeji AA, Ngadi MO, Raghavan GSV (2009) Kinetics of mass transfer in microwave precooked and deep fat fried chicken nuggets. International Journal of Food Engineering 91: 146-153.
- Adel-Aal MH, Karara HA (1986) Changes in corn oil during deep-fat frying. Lebensmittel-Wissenschaft Und-Technologie 19: 323-327.
- Stevenson SG, Vaisey- Genser M, Eskin NAM (1984) Quality control in the use of deep frying oils. Journal of the American Oil Chemists Society 61: 1102-1108.
- Kim DN, Lim J, Bae IY, Lee HG, Lee S (2011) Effect of hydrocolloid coatings on the heat transfer and oil uptake during frying of potato strips. Journal of Food Engineering 102: 317-320.
- Frankel EN, Smith LM, Hamblin CL, Creveling RK, Clifford AJ (1984) Occurrence of cyclic fatty acid monomers in frying oils used for fast foods. Journal of American Oil Chemist Society 61: 87-90.
- Funami T, Funami M, Tawada T, Nakao Y (1999) Decreasing oil uptake of doughnuts during deep-fat frying using curdlan. Journal of Food Science 64: 883-888.
Citation: Sharma A, Chandra S (2022) Correlation Study between Onset of Nafld with Physiological Parameters among Populations of Kolkata and Suburbs Facing Rapid Urbanization. J Food Sci Nutr 8: 131.
Copyright: © 2022 Abhishek Sharma, et al. This is an open-access article distributed under the terms of the Creative Commons Attribution License, which permits unrestricted use, distribution, and reproduction in any medium, provided the original author and source are credited.