Development and Nutritional Assessment of Complementary Foods from Fermented Cereals and Soybean
*Corresponding Author(s):
Mengistu Asfaw TufaFood Medicine And Health Care Administration And Control Authority Of Ethiopia, Addis Ababa, Ethiopia
Email:mengeasfaw@yahoo.com
Abstract
The aim of this study was to produce complementary foods from sorghum, maize, sorghum/soybean and maize/soybean blends and evaluate its nutritional quality, antinutritional factors and sensory characteristics. Sorghum variety (Gobyie), Maize variety (Melkassa 4) and Soybean variety (ETV) were collected from the Ethiopian Seeds Enterprise (ESE). The flour was blended in a ratio of 70:30 to prepare various gruels on protein basis. This method was used to achieve the control blend of 70% cereals flour and 30% soybean flour. The chemical composition, functional properties, sensory attributes and nutritional qualities of the food samples were determined using standard methods. Analysis of Variance (ANOVA) was used to establish any significant difference in the analytical data for formulated and control diets. Results showed that the moisture content ranged between 4.1g/100g-7.06g/100g; the total ash content 0.75g/100g-2.6g/100g; crude protein 7.34g/100g-16.73g/100g; crude fat content 3.45g/100g-13.3g/100g; crude fibre 1.58g/100g-4.4g/100g; total carbohydrate 66.39g/100g-85.56g/100g and energy value 402.5kcal/100g-442.46kcal/100g. Results showed that fermentation significantly (p≤0.05) decreased antinutrient (tannin and phytate) and mineral content of the formulation diets. Results indicated that fermentation significantly (p≤0.05) decreased bulk density, dispersibility and increased oil absorption capacity. The pH of the fermented flours was decreased with a concomitant increase in the titratable acidity. The calculated molar ratios of formulation diets for phytate: calcium and phytate: zinc and (Ca) (Phytate)/(Zn) were less than the critical values. For sensory attribute, the fermented sorghum/soybean blend diet was rated better in terms of overall acceptability when compared with other diets. It could be concluded that fermented sorghum/soybean blend diet had a better nutritional quality based on the overall ranking using protein, energy and sensory attributes indices.
Keywords
INTRODUCTION
Legumes and cereals are the main source of nutrients for traditional complementary foods in developing countries [1]. The major cereals such as sorghum, rice, wheat and maize constitute about 85% of total global cereals production amounting to about 200 million tones of harvest annually at average of 10% protein content, out of which a sizeable proportion goes into human consumption [2].
Legumes such as soybean cultivated in Africa and elsewhere are one of the richest and cheapest sources of plant protein that can be good substitute for animal products. Unlike other beans, soy offers enough protein and that can be used to improve the diets of millions of people especially poor and low income society in developing countries because of nutritional quality, attractiveness and functional properties [3]. Cereals and legumes are also rich in micronutrients; however, the availability of those nutrients is usually low due to the presence of antinutritional factors such as phytic acid and tannins. Fermentation and soaking are simple traditional processing treatments that decrease the level of antinutrients in cereals and legumes and increase the nutrients content of diet by increasing the content of minerals, vitamins, amino acids and others [4].
Malnutrition in children is a major nutritional problem in African developing countries which leads to morbidity and mortality, retardation in physical growth and mental development, working capacity and increased risk of adult disease [5]. This nutrition problem is due to the low nutritional value of traditional complementary foods, inappropriate complementary feeding practices and high cost of quality protein-based complementary foods. Globally, more than one billion people are undernourished and in Africa there are more than 70 million undernourished children due to poverty and shortage of food [6]. This vulnerable population survives mainly on starchy staple cereal food such as maize, wheat, rice, sorghum and millet with few or no meat and dairy products [7].
Traditional complementary foods are mostly cereal based and these plant-based complementary foods are not sufficient for growth and development of infant and children. For instance, examinations have shown that only cereal based complementary food often fail to meet the nutritional intake of infant due to poor nutritive quality [8]; hence, they have been implicated in the aetiology of protein-energy malnutrition in the community where they are solely used as the complementary food.
The growth of infants and young children in their first two years of life is very rapid. Breast feeding only will not be sufficient for the infant’s nutritional requirement. After about six months of age, the infant needs complementary foods particularly food of adequate nutrient density, consistency, and appropriate texture, and they need to be fed more often than adults [9]. In view of the nutritional problem that is associated with traditional complementary foods, the present study, therefore, aims at formulating complementary foods from both cereals and soybean. Formulation of complementary foods with a variety of cheapest legumes such as soybean has received considerable attention from nutritionists and food scientists in African countries [10].
It is evident that when cereals and legumes are judiciously selected and combined, a desirable pattern of essential amino acids of high biological value is obtained [11].
Cereals are deficient in essential amino acids like lysine and tryptophan [12]. While, legumes are deficient in sulphur containing amino acids, that is methionine and cystine, but rich in tryptophan and lysine. Improvement of the nutritional quality of traditional complementary foods with soybean is convenient, cheap and highly effective to promote quality of traditional complementary foods. Adding even small quantities of soybean can very much increase protein content and quality of traditional complementary foods [11]. The aim of this study was to develop and evaluate nutritional quality of complementary foods from the combination of cereals and soybeans. These food materials were purposely selected because of their availability locally and also to complement one another to obtain a balanced amino acid profile.
MATERIALS AND METHODS
Materials
Methods
| Sample Code | Formulation Name | Mixing ratio(% w/w) |
| Diet 1 | Unfermented sorghum alone (control) | 100 |
| Diet 2 | Fermented sorghum alone | 100 |
| Diet 3 | Unfermented sorghum/soybean | 70:30 |
| Diet 4 | Fermented sorghum/soybean | 70:30 |
| Diet 5 | Unfermented maize alone (control) | 100 |
| Diet 6 | Fermented maize alone | 100 |
| Diet 7 | Unfermented maize/soybean | 70:30 |
| Diet 8 | Fermented maize/soybean | 70:30 |
Carbohydrate (g/100g) = 100 - (Protein (g) + Fat (g) + Ash (g) + Fibre (g))
Energy value was determined by calculation from fat, carbohydrate and protein contents using Atwater’s conversion factors [19]. Micronutrients such as calcium, iron and zinc were determined using Atomic Absorption Spectroscopy after digestion with hydrochloric acid. Digestion is usually done using sulphuric acid, nitric acid, perchloric acid or combinations as these are strong oxidising agents [17].
Antinutritional factors: Tannin contents were determined by the modified vanillin-HCl methods [20]. Phytate content was determined by following the Latta et al., method [21], modified by Vaintraub et al., method [22].
Phytate mineral molar ratio calculation: Phytate mineral molar ratio was determined according to the Bains K et al., method [23].
% Lactic Acid = V × 0.009008 × 100/W
Where: V = Volume of 0.1N NaOH used for sample titration; 0.009008 = Factor equivalent in which 1ml of 0.1N NaOH = 0.009008g C3H6O5; W = Weight in gram of sample in the mixture.
Bulk density: A 5g flour sample was put into 100ml measuring cylinder. The cylinder was tapped until there was no further change in volume. The weight of the measuring cylinder and its contents was taken and recorded. Bulk density was calculated as weight per unit volume of the sample [25].
Dispersibility: 10g flour samples were weighed into a 100ml measuring cylinder and distilled water was added up to 100ml volume. The sample was vigorously stirred and allowed to settle for 3 hrs. The volume of settled particles was recorded and subtracted from 100 to give a difference that is taken as percentage dispersibility [26].
Water absorption capacity: The WAC which gives an indication of the amount of water available for gelatinization was determined according to methods of Beuchat et al., [27]. 1g of each sample were measured and mixed with 10ml of distilled water and vortexed for 1 min and then centrifuged at 3000rpm for 45min. The volume of the supernatant was recorded in a 10ml graduated cylinder and used for determinations of water absorption; WAC was expressed as the weight of water bound by gram dry flour.
WAC = (W2 - W1) ÷ Ws
Where, Ws is the weight of the sample, W1 is the weight of centrifuge tube plus sample and W2 is the weight of centrifuge tube plus the sediments.
Oil Absorption Capacity: OAC was determined according to the method of Chau et al., [28]. 1g of each sample flour was measured and mixed with 10ml of oil. The mixture was stirred for 30 min at room temperature. After sample was centrifuged at 2500rpm for 30min, the supernatant was transferred to a graduated cylinder of 10ml, where volume was measured. OHCA was expressed as the weight of oil bound by 1g dry flour.
OHCA = (W2-W1) ÷ Ws
Where, Ws is the weight of the sample, W1 is the weight of centrifuge tube plus sample and W2 is the weight of centrifuge tube plus the sediments.
RESULTS AND DISCUSSION
The macronutrient composition of the fermented and unfermented control and formulated diets are present in table 2. The moisture content for both control and formulated food samples were varied. The range was from 4.1g/100g to 7.06g/100g. The diet 6 had the highest moisture content (7.06g/100g) while the diet 3 had the least (4.1g/100g) moisture content. Low moisture content of food samples is desirable for extending the shelf life of food products while high moisture contents in food samples encourage the growth of microorganisms; hence it leads food spoilage [30]. Amankwah et al., reported that moisture content is used as a quality factor for prepared cereals which should have 3-8g/100g moisture content, therefore the maximum moisture content obtained in diet 6 is 7.06g/100g [14]. The relative increase in the moisture content in food samples may be attributed to a variation in the treatment during the drying process of the diets [31].
| Sample Code | Moisture Content | Crude Ash | Crude Protein | Crude Fat | Crude Fibre | Carbohydrate Content | Energy Value (kcal) |
| Diet 1 | 4.60±0.00b | 1.27±0.28b | 9.00±0.49a | 3.45±0.01a | 2.39±0.05b | 83.95d | 402.52a |
| Diet 2 | 4.80±0.28b | 0.75±0.18a | 11.83±0.19b | 6.53±0.12b | 1.58±0.02a | 79.28c | 422.96b |
| Diet 3 | 4.10±0.11a | 2.12±0.23c | 14.31±0.46c | 13.30±0.86c | 3.88±0.34c | 66.39a | 442.46d |
| Diet 4 | 4.6±0.00b | 1.28±0.42b | 16.73±0.21d | 9.78±0.79d | 4.41±0.63d | 67.80b | 426.02c |
| Diet 5 | 6.39±0.01b | 0.8±0.28a | 7.34±0.00a | 4.35±0.79a | 1.95±0.05a | 85.56d | 410.43a |
| Diet 6 | 7.06±0.11c | 1.2±0.00b | 10.61±0.48b | 4.70±0.35a | 1.80±0.10a | 81.69c | 411.71b |
| Diet 7 | 5.4±0.00a | 2.6±0.28c | 12.34±0.34c | 11.50±0.64c | 4.11±0.01b | 69.45a | 430.57d |
| Diet 8 | 5.6±0.28a | 1.2±0.01b | 14.57±0.23d | 9.31±0.60b | 4.12±0.13b | 71.20b | 425.13c |
The range of total ash content of the food samples are 0.75g/100g to 2.6g/100g. The diet 2 and 5 had the least total ash content (0.75 and 0.8g/100g respectively) when compared with the formulated food samples taken by diet 3 and diet 7 (2.12 and 2.6g/100g respectively). Fermentation will significantly (p<0.05) decrease the total ash content in diet 1, 3 and 7 because probably ash was not leached properly during fermentation [32]. According to Munasinghe et al., [33] the ash content of weaning food should not exceed 5g/100g. However, in this experimental study, all values are acceptable. The protein content for both control and formulated food samples are varied i.e., from 7.34g/100g to 16.73g/100g. Diet 5 had the least (7.34g/100g) protein content while diet 4 had the highest protein content (16.73g/100g) which is higher than the value reported by Akanbi et al., [34]. The protein content in all the food samples are significantly increased after 72 hrs of fermentation (p<0.05). Proteins are important both in quantity and quality, for rapid growth and development of a child. The protein content increases during the fermentation, due to the fact that the proteolytic activities of enzymes produced by microorganisms which increases the bioavailability of amino acids [16]. The poor protein levels of traditional complementary foods have been a major concern in infant feeding [35]. Use of the formulation could serve as a practical means of upgrading the protein levels of the traditional sorghum and maize based complementary foods.
The fat content of the food samples ranged from 3.45g/100g to 13.3g/100g. The diet 1 and 5 had the least fat content (3.45 and 4.35g/100g respectively) when compared with the formulated food samples taken by diet 3 and 7 (13.3 and 11.5g/100g respectively). To a great extent, fats contribute to energy value of food as well as provide essential fatty acid for optimal neurological, immunological and functional developments in infants and children [36]. Fat content of diet 4 with (9.78g/100g) and diet 8 with (9.31±0.6g/100g) correspondence to that recommended by Protein Advisory group and the fat composition for complementary foods should not be more than 10% [33]. The reduction of fat content of formulated food samples after fermentation may be attributed to the activities of micro-organisms on these nutrients in utilizing them to synthesize protein for their growth [37]. Complementary foods with low fibre content are very important since it helps in the safety of children, considering the appetite they have to consume more to get satisfied to meet their daily energy requirement [38]. The fiber content of the food samples ranges from 1.58g/100g to 4.41g/100g. The formulated food samples had the highest fibre content compared to control food samples. Fermentation significantly (p<0.05) decreased the crude fiber content in diet 1 and increased the crude fiber content in diet 3 [34]. The reduction of crude fibre content in diet might be due to enzymatic degradation of the fibrous material during fermentation [39]. The low crude fibre content is nutritionally appreciated because it traps less protein and carbohydrates [40]. The crude fiber content of infant foods is expected to be low [41], as food with high fibre content tends to cause indigestion in infants. Hence, samples with low fibre content were rated good as potential complementary foods.
The diet 1 and diet 5 had the highest carbohydrate content (83.95 and 85.56g/100g respectively) while diet 3 and 7 had the least carbohydrate content (66.39 and 69.45g/100g respectively). Fermentation significantly (p<0.05) decreased total carbohydrate content in diet 1 and diet 5 which is in agreement with the values reported by Mihiret [31] and Bekele [11] respectively. The decrease in carbohydrates are calculated and the difference could be due to the fact that starch and soluble sugars are principal substances for fermenting microorganisms; therefore degradation and a subsequent decrease in starch content are expected to occur [42]. The formulated food samples contain total carbohydrate content in the range of 66.39 to 71.2g/100g. The energy value of food samples ranged from 402.52kcal/100g to 442.46kcal/100g. The diet 1 and diet 5 had the least energy value (402.52 and 410.43kcal/100g respectively) while diet 3 and 7 had the highest energy value (442.46 and 430.57kcal/100g respectively). Fermentation significantly (p<0.05) increased the energy value in diet 1 [31] and decreased the amount of energy value in diet 3 which is in comparable with the values obtained by Akanbi et al., [34]. Fermentation significantly (p<0.05) increased the energy value in diet 5 while decreased in diet 7. However, the values are same with values reported by Bekele [11] and as reported by Onilude et al., [43], they are comparable with the values of unfermented blend. It is believed that frequent consumption of the diet along with breast-milk, would satisfy the daily energy requirements of infants. Nutritionally, protein contents and energy values of experimental food samples fulfill the specification guidelines for the young child complementary food formulations.
The mineral composition of control and formulated food sample presented in table 3 shows that calcium had the highest mineral content in diet 3 (231.67mg/100g) followed by diet 7 (217.25mg/100g) while the low value obtained from diet 6 (5.64mg/100g). High iron content is observed in diet 3 (5.15mg/100g) and low value obtained from diet 5, 6 and 8 with values 2.57, 2.50 and 2.52mg/100g respectively. On the other hand the diet 6 had the least zinc value (1.21mg/100g) while diet 3 and 7 had the highest zinc value (3.67 and 3.44mg/100g respectively). However fermentation significantly (p<0.05) decreased the calcium, iron and zinc value in formulated food samples. In comparisons, the mineral contents of formulated food samples are high when compared with traditional complementary food samples (control samples). This observation indicates that formulated food samples would serve as a good source of minerals particularly calcium which is essential for bone and teeth formation and development in infant and children. This formulated food samples were also suitable as complementary food for both infants and children. Reduction of calcium, iron and zinc contents in food samples may be due to utilizing some of hydrolyzed elements by microorganisms for their metabolic activities and also through decantation of water during the drying process in fermentation [44].
| Sample Code | Ca | Fe | Zn |
| Diet 1 | 18.10±1.60a | 4.05±0.14a | 1.74±0.03a |
| Diet 2 | 18.61±1.01a | 4.31±1.62a | 1.78±0.18a |
| Diet 3 | 231.67±2.74c | 5.15±0.52b | 3.67±0.06c |
| Diet 4 | 186.93±2.47b | 4.27±0.04a | 2.60±0.06b |
| Diet 5 | 9.83±0.38b | 2.57±0.59a | 1.78±0.41b |
| Diet 6 | 5.64±0.06a | 2.50±0.11a | 1.21±0.03a |
| Diet 7 | 217.25±3.42d | 4.30±0.40b | 3.44±0.04c |
| Diet 8 | 115.75±0.23c | 2.52±0.29a | 1.62±0.13b |
Antinutrient composition of control and formulated food samples are presented in table 4. High tannin content is observed in formulated food samples compare to control food samples. This enhancement of tannin content food samples are in accordance with the observation made by Ochieng’anyango [45], he reported that as the cowpea had higher tannin content than the sorghum, compositing increased the tannin content of the food samples. However, 72 hrs fermentation decreased the tannin content of all food samples. Low tannin content was obtained from diet 6 with value 1.96mg/100g. These observations are in agreement with that reported by Fagbemi et al., [46] and he stated that reduction in tannin contents was due to fermentation effect that have been caused by the activity of tanniase of fermenting microflora on tannins.
| Sample code | Antinutrient (mg/100g) | |
| Tannin | Phytate | |
| Diet 1 | 19.36±2.14b | 362.43±5.31c |
| Diet 2 | 16.32±0.00a | 194.06±5.18a |
| Diet 3 | 26.16±1.07d | 275.27±2.22b |
| Diet 4 | 22.37±2.13c | 193.44±1.66a |
| Diet 5 | 4.99±3.21b | 254.67±7.22c |
| Diet 6 | 1.96±1.06a | 253.65±5.42c |
| Diet 7 | 31.45±4.27d | 219.75±0.94b |
| Diet 8 | 14.81±2.13c | 173.40±2.19a |
Fermentation significantly (p<0.05) decreased the phytate content of all food samples except for diet 5. The high phytate content was obtained in diet 1 with value 362.43mg/100g while the least value (173.40mg/100g) was recorded in formulated food samples (diet 8) at 72 hrs fermentation time. The results of this study are in agreement with those reported by Cosgrove et al., [47] and he stated that the reduction of phytic acid content in food samples may be due to hydrolysis of phytate content by activity of enzyme phytase into lower inositol phosphates which are activated during fermentation process.
Molar ratios of phytate and zinc, iron and calcium of food samples to predict theirs bioavailability which are shown in table 5. The phytate: Calcium molar ratio was the highest in diet 6 (2.72) followed by diet 5 (1.57) and diet 1 (1.21) respectively. Phytate: Calcium molar ratios >0.24, indicative of poor calcium available and were found in diet 1, diet 2, diet 5 and diet 6 with values 1.21, 0.63, 1.57 and 2.72 respectively, whereas high calcium availability was observed in diet 3 (0.07), diet 4 (0.06), diet 7 (0.06) and diet 8 (0.09) [48]. The phytate: Iron molar ratios >1, indicative of poor bioavailability of iron in all food samples [49]. This could be due to high phytate level in these food samples.
| Sample Code | Phytate: Calcium | Phytate: Iron | Phytate: Zinc | (Ca)(Phytate): Zinc (mol/kg) |
| Diet 1 | 1.21±0.12c | 7.62±0.18b | 20.71±0.23c | 0.09±0.00b |
| Diet 2 | 0.63±0.05b | 4.11±1.45a | 10.94±1.43b | 0.05±0.00a |
| Diet 3 | 0.07±0.00a | 4.57±0.49a | 7.50±0.03a | 0.43±0.00d |
| Diet 4 | 0.06±0.00a | 3.83±0.00a | 7.41±0.06a | 0.34±0.00c |
| Diet 5 | 1.57±0.01b | 8.68±1.79c | 14.92±3.18c | 0.03±0.00a |
| Diet 6 | 2.72±0.08c | 8.63±0.22c | 20.78±1.25d | 0.02±0.00a |
| Diet 7 | 0.06±0.00a | 4.34±0.41a | 6.34±0.11a | 0.34±0.00c |
| Diet 8 | 0.09±0.00a | 5.93±0.74b | 10.74±0.78b | 0.31±0.02b |
| *Critical values | >0.24 | >1.0 | >15 | >0.5 |
The phytate: Zinc molar ratio was the highest in diet 6 and 1 (20.78, 20.71 respectively) followed by diet 5 (14.92). Phytate:zinc molar ratios >15, indicates poor bioavailability of zinc [50,51] and were found in diet 1 (20.71) and diet 6 (20.78) whereas high zinc availability is observed in diet 2 (10.94), diet 3 (7.50), diet 4 (7.41), diet 5 (14.92), diet 7 (6.34) and diet 8 (10.74). Phytate: Zinc molar ratio is considered as a better indicator of zinc bioavailability than total dietary phytate levels alone [54]. The lower phytate: Mineral ratios from fermented diets may be partly ascribed to the decreased content of phytic acid during fermentation which had a significant negative correlation (p<0.05) with minerals bioavailability. Ca × phytate: Zinc molar was high in diet 3 (0.43) and low in diet 6, 5 and 2 with values 0.02, 0.03 and 0.05 respectively, Ellis et al., and Davies et al. indicated that the ratio of Ca × phytate: Zinc is a better predictor of zinc availability and that if the values were greater than 0.5mol/kg, there would be interferences with availability of zinc [52,53]. For all diets the Ca × phytate: Zinc molar ratio is less than 0.5 which means there would be no interference in availability of zinc.
Changes in pH of fermented diets are shown in figure 1. Results indicated that fermentation was found to cause gradual reduction in pH value with increase in fermentation period. The highest pH value (4.13) was obtained in diet 8 (fermented maize/soybean blend) whereas diet 6 (fermented maize) gave the least pH value (3.81) at 72 hrs of fermentation.
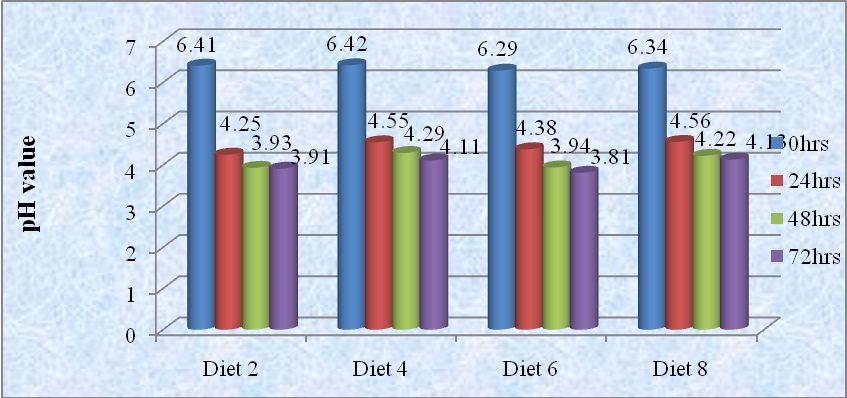 Figure 1: Change in pH of food samples during fermentation periods.
Changes in Total Titratable Acidity (TTA) of fermented diets are shown in figure 2. The Total Titratable Acidity (TTA) of all diets are increased with fermentation period. Diet 8 had the least titratable acidity (0.32) as shown in figure 2, while diet 4 had the highest titratable acidity (0.46) after 72 hrs of fermentation time. According to Akinrele [55], the metabolic activities of microorganism during fermentation reduce the pH and increase the titratable acidity. The increase in acidity is great significance, as it was reported to reduce the incidence of diarrhea in infants consuming fermented maize porridge [56].
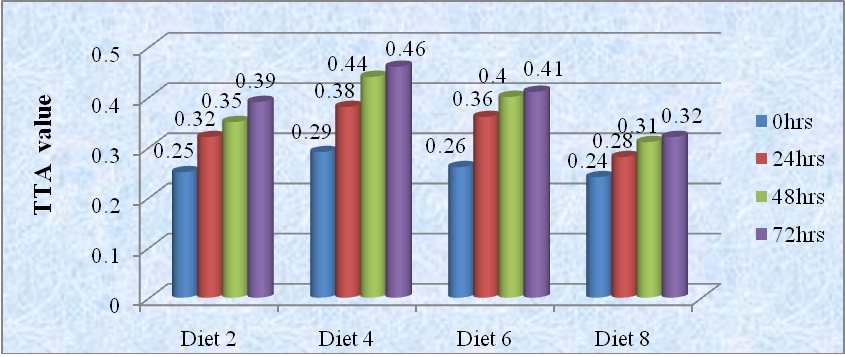 Figure 2: Change in Total Titratable Acidity (TTA) of food samples during fermentation periods.
The functional properties of control and formulated food samples are presented in table 6. In the present study the results showed that the bulk density of food samples ranged between 0.58±0.0g/ml and 0.9±0.0g/ml for diet 4 and 5 respectively. The decrease in bulk density of the fermented diet would be an advantage in the preparation of infant and children foods. Fermentation has been reported as a useful and traditional method for the preparation of low bulk complementary foods [57]. Nutritionally, loose bulk density promotes easy digestibility of food products, particularly among children with immature digestive system [58]. The dispersibility of food samples ranged between 68.5±0.7% and 80.5±0.7% for diet 8 and 2 respectively and high value was obtained from diet 2 and low value was recorded in diet 8. The water absorption of food samples ranged between 1.93±0.06g/g and 2.51±0.05g/g for diet 2 and 8 respectively. Low water absorption capacity would be desired in order to decrease the microorganism of food that causes spoilage of diets [59]. Fermentation significantly (p<0.05) increased the oil absorption capacity of all food samples, high value was obtained from diet 4 while low value was obtained from diet 7 [11]. Oil absorption capacity is important as oil acts as flavor retainer and gives soft texture to food improving the mouth-feel [60,61]. Since the diets from current study had good oil absorption capacity, it suggests the presence of good lipophilic constituents and therefore may be suitable for production of foods [61].
| Sample Code | Bulk Density (g/ml) | Dispersibility (%) | Water Absorption (g/g) | Oil Absorption (g/g) |
| Diet 1 | 0.86±0.04c | 76.0±0.00c | 2.44±0.01b | 3.67±0.15a |
| Diet 2 | 0.76±0.00b | 80.5±0.70d | 1.93±0.06a | 3.95±0.64b |
| Diet 3 | 0.78±0.02b | 73.5±2.12b | 2.48±0.02b | 4.18±0.16b |
| Diet 4 | 0.58±0.00a | 70.0±0.00a | 2.49±0.04b | 4.69±0.02c |
| Diet 5 | 0.90±0.00c | 75.75±0.35d | 2.15±0.03a | 3.66±0.16b |
| Diet 6 | 0.70±0.00a | 73.00±0.00c | 2.35±0.04b | 4.12±0.00d |
| Diet 7 | 0.78±0.02b | 71.50±0.70b | 2.47±0.12c | 3.54±0.07a |
| Diet 8 | 0.72±0.02ab | 68.50±0.70a | 2.51±0.05c | 3.78±0.02c |
The sensory score associated with the gruels made from formulated food samples and control food samples are shown in table 7. Results showed that the color of the gruels made from control food samples (diet 1 and 5) was high while the gruels from formulated food samples was like slightly light and moderate for diet 4 and 8. The control food samples were significantly rated higher in terms of color when compared with the formulated food samples. This observation is in agreement with Mihiret and he who reported that the length of fermentation period decreases the perceived characteristic of color of the products [31].
| Sample Code | Color | Taste | Aroma | Texture | Overall Acceptability |
| Diet 1 | 8.00±1.22c | 7.20±2.90c | 5.80±1.40b | 6.20±0.83a | 6.80±1.16b |
| Diet 2 | 6.80±0.83b | 6.00±1.00a | 5.20±1.30a | 6.80±0.44b | 6.20±0.83a |
| Diet 3 | 7.00±1.22b | 6.60±2.77b | 7.11±1.64c | 7.60±0.54c | 7.00±1.41b |
| Diet 4 | 6.20±1.48a | 6.01±2.04a | 7.00±1.74c | 8.40±0.64d | 7.10±1.42b |
| Diet 5 | 8.80±0.44c | 8.20±0.83d | 5.40±1.78a | 5.80±1.11a | 6.87±0.83b |
| Diet 6 | 7.80±0.43b | 5.40±0.89a | 5.21±1.77a | 6.60±1.88b | 6.23±0.83a |
| Diet 7 | 7.80±1.09b | 7.60±0.81c | 6.20±0.83b | 6.40±1.81b | 7.00±0.70b |
| Diet 8 | 7.26±1.14a | 6.70±1.09b | 6.12±1.48b | 7.20±0.83c | 6.20±0.83a |
Fermentation significantly (p<0.05) decreased the taste score of both formulated and control food samples, the gruels made from control food samples were like moderate for diet 1 and high for diet 5 while the gruels made from formulated food samples were like slightly light for diet 4 and 8. Regarding the aroma, the gruels made from food samples were neither liked nor disliked by diet 1, 2, 5 and 6 while diet 3 and 4 moderately liked the aroma which were made from formulated food samples. Fermentation significantly (p<0.05) influenced the texture of the gruels made from both control and formulated food samples. There was a significant (p<0.05) difference between the texture score of the formulated and control food samples. The texture of the gruels from composite food samples were moderate for diet 3 and high for diet 4 while the control was slight for diet 1 and neither like nor dislike for diet 5. Supplementation of soybean significantly (p<0.05) increased the texture score of formulated food sample compared with the control food samples. These results are similar with those observed by Omueti et al., [62]. Relative to overall acceptability, the gruels made from food samples were like slightly low for diet 2, 6 and 8 while the gruels made from formulated food samples were like moderate for diet 3, 4 and 7.
A ranking system using three nutritional criteria, i.e., protein content, energy value and sensory attributes, was devised to determine the optimal blend combination according to the method modified by Ijarotimi [8] (Table 8). Based on the relative importance and interrelationship of those criteria, ranking was reported on an equal weight basis. The weighting of the above criteria is important to produce identical conclusive results. The four blends which ranked from 1 to 4 were objectively determines the choice of complementary foods. The complementary food which yields lowest score was considered as the most suitable nutritional characteristics. As per table 8 fermented sorghum/soybean blends had lowest rank score followed by unfermented sorghum/soybean, unfermented maize/soybean and fermented maize/soybean blend diet. Therefore, fermented sorghum/soybean blend diet was concluded to possess the most desirable nutritional profile among formulated food samples.
| Parameters | Protein(g/100g) | Energy(kcal) | Sensory Attributes | Total Score |
| Unfermented sorghum/soybean | 3 | 1 | 3 | 7 |
| Fermented sorghum/soybean | 1 | 3 | 1 | 5 |
| Unfermented maize/soybean | 4 | 2 | 2 | 8 |
| Fermented maize/soybean | 2 | 4 | 4 | 10 |
Table 8: Ranking of fermented and unfermented formulated food samples to determine optimal nutritional profile.
CONCLUSION
In conclusion, this research shows that nutritious, acceptable and affordable complementary foods can be formulated using our locally available food items that can be better than traditional complementary foods. In the present work, it was concluded that enriching sorghum and maize flours with soybean flour increased the protein, energy, fat, ash, fibre and minerals contents of sorghum and maize-based complementary foods. In this study, it also observed that the natural fermentation process significantly improves nutritional value of formulated foods by reducing antinutrients. Fermented sorghum/soybean blend flour was concluded to possess the most desirable nutritional profile among the formulated foods followed by sorghum/soybean, maize/soybean and fermented maize/soybean blends respectively.
ACKNOWLEDGEMENT
This master thesis manuscript is prepared at the time the author was learning at Addis Ababa University Center for Food Science and Nutrition. The author thanks, Addis Ababa University, Ethiopian Seeds Enterprise (ESE) and Ethiopian Public Health Institute (EPHI) for facilities available for this thesis. The author is grateful for the financial support provided by Mrs Tsegaye Asfaw.
REFERENCES
- Chavan JK, Kadam SS (1989) Nutritional improvement of cereals by sprouting. Crit Rev Food Sci Nutr 28: 401-437.
- Sofi P, Wani SA, Rather A, Wani SH (2009) Quality protein maize (QPM): Genetic manipulation for the nutritional fortification of maize. Journal of Plant Breeding and Crop Science 1: 244-253.
- Iwuoha CI, Eke OS (1996) Nigerian indigenous fermented foods: Their traditional process operation, inherent problems, improvements and current status. Food Research International 29: 527-540.
- Nadeem M, Anjum FM, Amir RM, Khan MR, Hussain S (2010) An overview of anti-nutritional factors in cereal grains with special reference to wheat-A review. Pak J Food Sci 20: 54-61.
- Michaelsen KF, Hoppe C, Roos N, Kaestel P, Stougaard M, et al. (2009) Choice of foods and ingredients for moderately malnourished children 6 months to 5 years of age. Food Nutr Bull 30: 343-404.
- Serrem CA (2010) Development of soy fortified sorghum and bread wheat biscuits as a supplementary food to combat Protein Energy Malnutrition in young children. Thesis work, University of Pretoria, Pretoria, South Africa.
- Mayer JE, Pfeiffer WH, Beyer P (2008) Biofortified crops to alleviate micronutrient malnutrition. Curr Opin Plant Biol 11: 166-170.
- Ijarotimi OS, Keshinro OO (2012) Formulation and nutritional quality of infant formula produced from germinated popcorn, bambara groundnut and african locust bean flour. Journal of Microbiology, Biotechnology and Food Sciences 1: 1358-1388.
- Achinewhu S (1987) Protein quality evaluation of weaning food mixtures from indigenous fermented foods. Nig J Nutr Sci 8: 23-31.
- Uzogara S, Agu L, Uzogara E (1990) A review of traditional fermented foods, condiments and beverages in Nigeria: Their benefits and possible problems. Ecology of Food and Nutrition 24: 267-288.
- Bekele M (2011) Institute of Technology (AAiT), School of Graduate Study, Department of Chemical Engineering. Addis Ababa University.
- Nout MJR, Rombouts FM (1992) Fermentative preservation of plant foods. Journal of Applied Microbiology 73: 136-147.
- Adebayo-oyetoro A, Olatidoye OP, Ogundipe OO, Akande EA, Isaiah CG (2012) Production and quality evaluation of complementary food formulated from fermented sorghum, walnut and ginger. Journal of Applied Biosciences 54: 3901-3910.
- Amankwah EA, Barimah J, Nuamah AKM, Oldham JH, Nnaji CO (2009) Formulation of Weaning Food from Fermented Maize, Rice, Soybean, and Fishmeal. Pakistan Journal of Nutrition 8: 1747-1752.
- Yimer A (2008) Effect of Processing on some Antinutritional Factors of improved Soybean (Glycine Max) Varieties Grown, Ethiopia. M.Sc. Thesis, Addis Ababa University, Addis Ababa, Ethiopia.
- Amankwah EA, Barimah J, Acheampong R, Addai LO, Nnaji CO (2009) Effect of fermentation and malting on the viscosity of maize-soyabean weaning blends. Pakistan Journal of Nutrition 8: 1671-1675.
- Osborne D, Voogt P (1978) The analysis of nutrients in foods. Academic Press Inc.(London) Ltd., London, UK.
- Tizazu S, Urga K, Abuye C, Retta N (2009) Improvement of energy and nutrients density of sorghum based weaning food using germination. African Journal of Food Agriculture Nutrition and Development 10: 2927-2942.
- Nguyen TTT, Loiseau G, Icard-verniere C, Rochette I, Trèche S et al. (2007) Effect of fermentation by amylolytic lactic acid bacteria, in process combinations, on characteristics of rice/soybean slurries: A new method for preparing high energy density complementary foods for young children. Food chemistry 100: 623-631.
- Maxson ED, Rooney LW (1972) Evaluation of methods for tannin analysis in sorghum grain. Cereal Chem 49: 719-728.
- Latta M, Eskin M (1980) A simple and rapid colorimetric method for phytate determination. J Agric Food Chem 28: 1313-1315.
- Vaintraub IA, Lapteva NA (1988) Colorimetric determination of phytate in unpurified extracts of seeds and the products of their processing. Anal Biochem 175: 227-230.
- Bains K, Uppal V, Kaur H (2014) Optimization of germination time and heat treatments for enhanced availability of minerals from leguminous sprouts. J Food Sci Technol 51: 1016-1020.
- Pearson D (1976) The chemical analysis of foods, Longman, London, UK.
- Okaka JC, Potter NN (1979) Physico?chemical and functional properties of cowpea powders processed to reduce beany flavor. Journal of Food Science 44: 1235-1240.
- Kulkarni KD, Kulkarni D, Ingle U (1991) Sorghum malt-based weaning food formulations: Preparation, functional properties and nutritive value. Food Nutr Bull.
- Beuchat LR (1977) Functional and electrophoretic characteristics of succinylated peanut flour protein. J Agric Food Chem 25: 258-261.
- Chau CF, Huang YL (2003) Comparison of the chemical composition and physicochemical properties of different fibers prepared from the peel of Citrus sinensis L. Cv. Liucheng. J Agric Food Chem 51: 2615-2618.
- Inyang CU, Idoko CA (2006) Assessment of the quality of ogi made from malted millet. African Journal of Biotechnology 5: 2334-2337.
- Temple V, Badamosi E, Ladeji O, Solomon M, Gowok H (1996) Proximate Chemical Composition of three locally formulated complementary foods. West Afr. J. Biol. Sci 5: 134-143.
- Mihiret KA (2009) The effect of Natural Fermentation on Some Antinutritional Factors, Minerals, Proximate composition and sensory charactristics in sorghum based weaning food. A Thesis presented to the school of graduate studies of Addis Ababa University in partial fulfilllment of the requirements for the Degree of Master of Science in Food Science and Nutrition.
- Beebe S, Gonzalez AV, Rengifo J (2000) Research on trace minerals in the common bean. Food Nutr Bull 21: 387-391.
- Munasinghe M, Silva K, Jayarathne K, Sarananda K (2013) Development of yoghurt-based weaning foods for 1-3 years old toddlers by incorporation of mung bean (Vigna radiata), soybean (Glycine max) and brown rice (Oryza sativa) for the Sri Lankan market. Journal of Agricultural Sciences 8: 43-56.
- Akanbi BO, Agarry OO, Garba SA (2010) Quality assessment of selected cereal-soybean mixtures in “ogi” production.
- World Health Organization (1998) Complementary feeding of young children in developing countries: A review of current scientific knowledge, World Health Organization, Geneva, Switzerland.
- Guthrie HA (1989) Introductory Nutrition. Times Mirror/Mosby College Pub.
- Sade FO (2009) Proximate, antinutritional factors and functional properties of processed pearl millet (Pennisetum glaucum). Journal of Food Technology 7: 92-97.
- Eka O, Edijala J (1972) Chemical composition of some traditionally prepared Nigerian foods. Nigerian J Sci 6: 157-62.
- Ikenebomeh MJ, Kok R, Ingram JM (1986) Processing and fermentation of the African locust bean (Parkia filicoidea Welw.) to produce dawadawa. Journal of the Science of Food and Agriculture 37: 273-282.
- Balogun AM, Fetuga BL (1986) Chemical composition of some underexploited leguminous crop seeds in Nigeria. J Agric Food Chem 34: 189-192.
- Olorunfemi OB, Akinyosoye FA, Adetuyi FC (2006) Microbial and Nutritional Evaluation of Infant Weaning Food from Mixture of Fermented Food Substrates. Research Journal of Biological Sciences 1: 20-23.
- Ejigui J, Savoie L, Marin J, Desrosiers T (2005) Beneficial Changes and Drawbacks of a Traditional Fermentation Process on Chemical Composition and Antinutritional Factors of Yellow Maize (Zea mays) Journal of Biological Sciences 5: 590-596.
- Onilude AA, Sanni AI, Ighalo MI (1999) Effect of process improvement on the physico-chemical properties of infant weaning food from fermented composite blends of cereal and soybeans. Plant Foods Hum Nutr 54: 239-250.
- Retta N (2010) Dejene Dida Bulbula. Addis Ababa University.
- Ochieng AJ (2009) Improvement in the protein quality of African sorghum foods through compositing with cowpea. UPSpace, University of Pretoria, Pretoria, South Africa.
- Fagbemi TN, Oshodi AA, Ipinmoroti KO (2005) Processing Effects on Some Antinutritional Factors and In vitro Multienzyme Protein Digestibility (IVPD) of Three Tropical Seeds: Breadnut (Artocarpus altilis), Cashewnut (Anacardium occidentale) and Fluted Pumpkin (Telfairia occidentalis). Pakistan Journal of Nutrition 4: 250-256.
- Cosgrove DJ, Irving G (1980) Inositol phosphates: Their Chemistry, Biochemistry and Physiology, Elsevier, Amsterdam, Netherlands.
- Morris ER, Ellis R (1985) Bioavailability of dietary calcium. American Chemical Society 275: 63-72.
- Hallberg L, Rossander L, Skånberg AB (1987) Phytates and the inhibitory effect of bran on iron absorption in man. Am J Clin Nutr 45: 988-996.
- Adeyeye EI, Arogundade LA, Akintayo ET, Aisida OA, Alao PA (2000) Calcium, zinc and phytate interrelationships in some foods of major consumption in Nigeria. Food Chemistry 71: 435-441.
- Umeta M, West CE, Fufa H (2005) Content of zinc, iron, calcium and their absorption inhibitors in foods commonly consumed in Ethiopia. Journal of Food Composition and Analysis 18: 803-817.
- Ellis R, Kelsay JL, Reynolds RD, Morris ER, Moser PB, et al. (1987) Phytate: zinc and phytate X calcium: zinc millimolar ratios in self-selected diets of Americans, Asian Indians, and Nepalese. J Am Diet Assoc 87: 1043-1047.
- Davies NT, Warrington S (1986) The phytic acid mineral, trace element, protein and moisture content of UK Asian immigrant foods. Hum Nutr Appl Nutr 40: 49-59.
- Urga K, Narasimha HV (1998) Phytate: zinc and phytate × calcium: zinc molar ratios in selected diets of Ethiopians. Bull Chem Soc Ethiop 12: 1-7.
- Akinrele IA (1970) Fermentation studies on maize during the preparation of a traditional african starch?cake food. Journal of the Science of Food and Agriculture 21: 619-625.
- Mensah PP, Tomkins AM, Drasar BS, Harrison TJ (1990) Fermentation of cereals for reduction of bacterial contamination of weaning foods in Ghana. Lancet 336: 140-143.
- Desikachar HSR (1980) Development of weaning foods with high caloric density and low hot-paste viscosity using traditional technologies. Food and Nutrition Bulletin 2: 21-23.
- Osundahunsi OF, Aworh OC (2002) A preliminary study on the use of tempe-based formula as a weaning diet in Nigeria. Plant Foods Hum Nutr 57: 365-376.
- Giami SY, Bekebain DA (1992) Proximate composition and functional properties of raw and processed full?fat fluted pumpkin (Telfairia occidentalis) seed flour. Journal of the Science of Food and Agriculture 59: 321-325.
- Ubbor SC Akobundu ENT (2009) Quality characteristics of cookies from composite flours of watermelon seed, cassava and wheat. Pakistan Journal of Nutrition 8: 1097-1102.
- Aremu M, Olonisakin A, Atolaye B (2006) Some nutritional and functional studies of prosopis Africana. Electron J Env Agric Food Chem 5.
- Omueti O, Otegbayo B, Jaiyeola O, Afolabi O (2009) Functional properties of complementary diets developed from soybean (Glycine Max), groundnut (Arachis Hypogea) and crayfish (Macrobrachium Spp). Electron J Env Agric Food Chem 8: 563.
Citation: Tufa MA, Urga K, Weledesemayat GT, Mitiku BG (2016) Development and Nutritional Assessment of Complementary Foods from Fermented Cereals and Soybean. J Food Sci Nutr 2: 014.
Copyright: © 2016 Geremew Tassew weledesemayat, et al. This is an open-access article distributed under the terms of the Creative Commons Attribution License, which permits unrestricted use, distribution, and reproduction in any medium, provided the original author and source are credited.