Development of Nutritious Healthy Noodles Incorporating Soy Based Functional Food Ingredients
*Corresponding Author(s):
Mangaraj SAgricultural Process Engineering Division, Central Institute Of Agricultural Engineering, Bhopal, India
Tel:+91 9630860191,
Email:sukhdev0108@gmail.com
Abstract
Noodles are ready to eat product that are popular among several group of consumer. However, the presently available noodles provided low protein quality. With the constituents of good quality protein and phytochemicals (isoflavonon), soybean has been accepted as the functional foods that have a potentially positive effect on health beyond basic nutrition. Proponents of functional foods say that they promote optimal health and help to reduce the risk of disease. Thus the study aimed to develop protein enriched soy noodles with Full Fat Soy Flour (FFSF), Defatted Soy Flour (DFSF), and Soy Protein Isolate (SPI) that has acceptable characteristics and contained soy protein 47.0%, 43.2% and 90% respectively of the amount recommended by ICMR/NIN per serving. The DFSF, FFSF and SPI were substituted in wheat flour using 5%, 10%, 15% and 20%, where SPI was also substitute at 8%. It was observed that the level of DFSF, FFSF and SPI substitution was acceptable from the panelist at 10%, 10% and 8% containing 16.91%, 16.69% and 16.87% protein respectively. The noodles packaged in PET-MET/LDPE and MET-MET/LDPE was not affected by moisture and the product was highly acceptable in comparison to LDPE and PP. To lead a nutritious and healthy life, consumer should take soy fortified noodles into their daily diet.
INTRODUCTION
A great interest has raised in the development of functional foods products that may provide a health benefit beyond the traditional nutrients [1]. Noodles are widely consumed throughout the world and a fast growing sector of the noodle industry, second to bread [2,3]. Study indicated that dried noodles or instant noodles contain about 9 g protein per 100 g of product [4]. This is due to low protein content cereals (rice and wheat flour) [5]. Several studies reported that malnutrition at early age causes impaired physical as well as mental development in children [6]. Also, researches carried out in India have confirmed that protein, energy and iron deficiency among school children has increased [7]. It is worthy to note that consumers worldwide are increasingly at risk of premature death from both cardiovascular disease and diabetes due to overweight, elevated cholesterol, high blood pressure and abnormal blood sugar. These risk factors are partially influenced by a diet low in fiber and high in refined grains, sugars and saturated fats. So, for gaining popularity as well as rendering noodles having high in protein and low in fat content in view of curbing varieties of ailment on our body with respect to changing lifestyle, research for alternative raw materials are still in continuing. Today soybeans are one of the most economicalcereal-based diets [8] and valuable agricultural commodities because of its unique chemical composition and multiple uses as food, feed and industrial materials. Soy bean (Glycine max) is an important source of oil (17-25%) and protein (35-45%) [9-11]. Soybeans have the highest protein content (40%) among cereal and other legume species, and the second highest oil content among all food legumes. Soy protein contains most the essential amino acids, most of which are present in amounts that closely match those required for humans or animals [12,13]. Furthermore, soybeans also contain many biological active components, including isoflavones, lecithin, saponins, oligosaccharides, and phytosterols [14]. Mangaraj et al., [15] stated that soybeans are good source of B6, foliate and vitamin E, whole soybeans have the highest levels of phytic acid, an organic acid and mineral cheater present in many plant tissues, especially bran and seed, which binds to certain ingested minerals; calcium, magnesium, iron and especially zinc-in intestinal tract and reduces the amount the body assimilates. It has been suggested that the high intakes of soy may explain, in part, the lower incidence of certain cancers in Asian countries, where soy consumption is high, when compared to Europe or America [16,17]. Nagarajan [18] suggested that soy isoflavonon may inhibit the effect of endothelial cell activation associated to chronicle diseases such as atherosclerosis by blocking the activation of inflammatory cells and the adhesion to the vascular endothelium. On 1999, the US Food and Drug Administration announced that food containing soy protein may reduce the risk of Coronary Heart Disease (CHD). The health claim is based on the US FDA’s determination that 25 grams of soy protein per day, as part of a diet low in saturated fat and cholesterol may reduce the risk of heart disease by reducing blood cholesterol levels. Apart from noodles, enabling fast food items to be more nutritious is to fortify them with protein, vitamins and minerals etc., to compete with other non-nutritional, yet popular, fast food items. Singh et al., [19] prepared noodles from semolina of durum and aestivum wheat and flour of aestivum with or without 10% of different types of full fat soy flour (i.e., enzyme active, conventional and roasted soy flour) and defatted soy flour and reported the product made from durum semolina containing 10% of defatted soy flour was as good as that from durum semolina alone. Osorio [20] studied the quality parameters of noodles made with various supplements (extruded maize, maize, defatted soy flour and maize/soy flour blends, lecithin and wheat straw). The noodles made with extruded maize flour, maize flour, and wheat straw supplements had the highest total sensory score. Young Soo Kim [21] prepared wet noodles from wheat flour with 3, 5 and 7% oyster mushroom and oak mushroom with improved protein and fiber contents having better acceptability.
A number of research studies have been reported on baked products, extruded products and deep fat fried snacks, noodles made from rice, wheat, ragi and legume flours supplemented with soya flour, defatted corn germ meal, soybean meal etc. [Buiet; Rathi; Marques; Osorio; Nielsen; Sudha; Kaur; Hou and Kruk; Fu] [20,22-28]. The main object of the present study is to provide soy based low-fat and high protein nutritious food in accordance to ICME/NIN guidelines [29]. It is a particular object of the invention to provide novel fast food item in which the proteins are balanced to provide optimum nutrition (i.e., up to 13-17g/100g of product). This study will provide an additional source of utilization of soy flour in fast food formulation.
MATERIAL AND METHODS
Raw materials
|
Raw Ingredient |
Protein (%) |
Fat (%) |
Ash (%) |
Fiber (%) |
Carbohydrate (%) |
Energy (k Cal) |
|
Wheat |
12.1 |
1.7 |
2.7 |
1.9 |
69.4 |
341.0 |
|
Refined Wheat Flour (RWF) |
11.3 |
0.9 |
- |
- |
- |
73.9 |
|
Defatted Soy Flour (DFSF) |
47.0 |
1.2 |
- |
4.3 |
38.4 |
329.0 |
|
Full Fat Soy Flour (FFSF) |
43.2 |
19.5 |
4.6 |
3.7 |
20.9 |
432.0 |
|
Soy Protein Isolate (SPI) |
90 |
0.1 |
0.1 |
0 |
- |
- |
Table 1: Chemical composition of raw material (per 100gm).
Mixture design for development of noodles
Soy Protein Isolate based (SPI) mixture design
|
|
Input Parameters |
Output Parameters |
||||
|
Run |
WF |
RWF |
SPI |
Protein (%) |
Fat (%) |
Energy |
|
1 |
19.90878 |
75.09122 |
5 |
14.15463 |
0.99876 |
340.765 |
|
2 |
24.33079 |
70.66921 |
5 |
13.94568 |
1.00034 |
338.675 |
|
3 |
12.33789 |
80 |
7.66211 |
15.13245 |
0.89743 |
343.321 |
|
4 |
21.22119 |
68.78556 |
9.993249 |
17.98453 |
0.94879 |
342.135 |
|
5 |
17.86295 |
72.28429 |
9.85276 |
17.54637 |
0.93654 |
341.875 |
|
6 |
10.60555 |
79.39445 |
10 |
17.87568 |
0.87436 |
343.256 |
|
7 |
14.24135 |
75.86167 |
9.896988 |
16.32452 |
0.90654 |
339.565 |
|
8 |
16.3651 |
78.6349 |
5 |
14.13002 |
0.95765 |
342.321 |
|
9 |
25 |
65.00111 |
9.998892 |
17.98734 |
0.99876 |
338.216 |
|
10 |
24.33079 |
70.66921 |
5 |
13.87523 |
1.00065 |
344.546 |
|
11 |
12.33789 |
80 |
7.66211 |
16.32765 |
0.96453 |
343.674 |
|
12 |
21.33811 |
71.6892 |
6.972685 |
14.94653 |
0.99564 |
339.165 |
|
13 |
16.3651 |
78.6349 |
5 |
13.54362 |
0.96345 |
347.321 |
|
14 |
10.60555 |
79.39445 |
10 |
17.13245 |
0.87965 |
345.34 |
|
15 |
25 |
65.00111 |
9.998892 |
16.98765 |
0.98765 |
341.321 |
|
16 |
25 |
67.76714 |
7.232864 |
14.56743 |
1.00324 |
339.1342 |
|
Input Parameter |
Output Parameter |
|||||
|
Run |
WF |
RWF |
DFSF |
Protein (%) |
Fat (%) |
Energy (Kcal) |
|
1 |
10.6244 |
74.3756 |
15 |
15.512 |
1.00232 |
387.345 |
|
2 |
10.26805 |
80 |
9.731949 |
14.101 |
0.978723 |
338.3712 |
|
3 |
25 |
66.51373 |
8.486266 |
13.341 |
1.00542 |
340.9536 |
|
4 |
25 |
66.51373 |
8.486266 |
13.654 |
0.999872 |
341.9564 |
|
5 |
17.73888 |
74.26112 |
8 |
14.122 |
0.986543 |
339.3452 |
|
6 |
24.99689 |
60.00311 |
15 |
15.325 |
0.985436 |
341.9456 |
|
7 |
21.88654 |
64.74022 |
13.37324 |
15 |
0.985342 |
343.1321 |
|
8 |
13.42041 |
75.85916 |
10.72043 |
14.12 |
0.97543 |
337.4231 |
|
9 |
17.73888 |
74.26112 |
8 |
13.342 |
0.96903 |
335.9876 |
|
10 |
24.99689 |
60.00311 |
15 |
15.342 |
1.00543 |
339.3215 |
|
11 |
14.35615 |
70.64385 |
15 |
15 |
0.98765 |
333.1432 |
|
12 |
18.62192 |
69.39567 |
11.9824 |
14.894 |
0.97654 |
332.9856 |
|
13 |
18.51129 |
66.48871 |
15 |
15.324 |
0.98765 |
338.1432 |
|
14 |
10.26805 |
80 |
9.731949 |
14.444 |
0.97987 |
336.2435 |
|
15 |
21.68259 |
70.31741 |
8 |
14.346 |
1.00834 |
341.4356 |
|
16 |
10.6244 |
74.3756 |
15 |
14.543 |
1.00765 |
332.8796 |
Noodle making machine
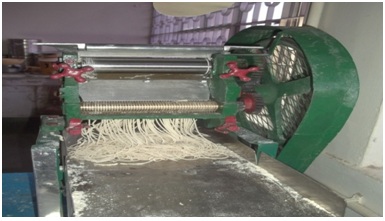 Figure 1: Development of noodles using noodle making machine.
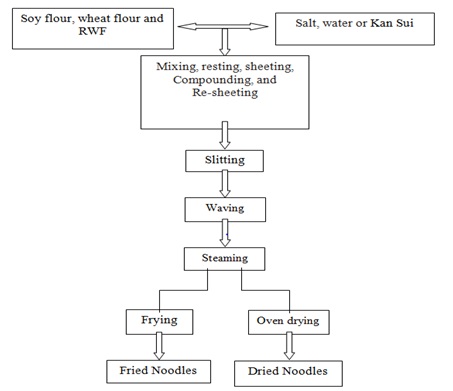 Figure 2: Flow chart of noodle making.
Sensory analysis
Quality assessment of developed products
Nutritional analysis: The moisture, fat, protein and ash were estimated using standard AOAC methods (2005). Carbohydrate and calories was calculated by subtracting the percentage of moisture, ash, crude protein and fat from 100 and by using factors 4.0, 4.0 and 9.0 to calculate the energy provided by protein, carbohydrates and fat, respectively.
Packaging and storage study of extruded snack foods and noodles: The final accepted noodles were filled in different type packaging material as described above and the sample was sealed using heat sealing machine and kept in the ambient temperatures to be studies. Then, quality parameters like moisture content, texture and sensory characteristics were measured in every month up to three month of storage.
Optimization of noodles
RESULTS AND DISCUSSION
Soy Protein Isolate (SPI) based noodles
|
*** Mixture Component Coding is U_Pseudo. *** |
||||||
|
Analysis of variance table [Partial sum of squares-Type III] |
||||||
|
Source |
Sum of Squares |
Df |
Mean Square |
F Value |
p-value Prob>F |
|
|
Model |
37.02865 |
2 |
18.51433 |
59.54066 |
<0.0001 |
Significant |
|
Linear mixture |
37.02865 |
2 |
18.51433 |
59.54066 |
<0.0001 |
|
|
Residual |
4.042385 |
13 |
0.310953 |
|||
|
Lack of fit |
2.377834 |
8 |
0.297229 |
0.892821 |
0.5788 |
Not significant |
|
Pure error |
1.664551 |
5 |
0.33291 |
|||
|
Cor total |
41.07104 |
15 |
||||
|
Std. dev. |
0.557631 |
R-Squared |
0.901576 |
|||
|
Mean |
15.77886 |
Adj R-Squared |
0.886434 |
|||
|
CV% |
3.53404 |
Pred R-Squared |
0.853106 |
|||
|
Press |
6.033076 |
Adeq Precision |
14.76095 |
|||
|
*** Mixture Component Coding is U_Pseudo*** |
||||||
|
Analysis of variance table [Partial sum of squares-Type III] |
||||||
|
Source |
Sum of Squares |
Df |
Mean Square |
F Value |
p-value Prob>F |
|
|
Model |
5.774653 |
2 |
2.887327 |
20.42253 |
<0.0001 |
Significant |
|
Linear mixture |
5.774653 |
2 |
2.887327 |
20.42253 |
<0.0001 |
|
|
Residual |
1.837933 |
13 |
0.141379 |
|
|
|
|
Lack of fit |
0.956299 |
8 |
0.119537 |
0.677931 |
0.7027 |
Not significant |
|
Pure error |
0.881634 |
5 |
0.176327 |
|
|
|
|
Cor total |
7.612586 |
15 |
|
|
|
|
|
Std. dev. |
0.376005 |
|
R-Squared |
0.758567 |
|
|
|
Mean |
14.52563 |
|
Adj R-Squared |
0.721423 |
|
|
|
CV% |
2.58856 |
|
Pred R-Squared |
0.623935 |
|
|
|
Press |
2.86283 |
|
Adeq Precision |
8.937561 |
|
|
Protein=0.10275*WF+0.10239*RWF+0.81480*SPI …… (1) for SPI based noodles
Protein=0.12396*WF+0.12084*RWF+0.32549*DFSF…...(2) for DFSF based noodles
The contour response surface (Figure 3) for protein content showed increasing consistency value of response due to the increasing defatted soy flour concentration. A mixture design surface consistency decreased by the increasing refined wheat flour. The result is in agreement with the report by Sudha et al., [32] who revealed that inclusion of soy flour and whey protein concentrate in instant vermicelli not only enhanced their protein content and in vitro protein digestibility but also reduced the fat uptake in noodles. As SPI and DFSF are the main source of protein in the product, described above, high protein content of the products is also reflected in respective regression coefficients [SPI (>0.80) and DFSF (>0.30)]. This may be because the soy proteins compete strongly for water with the other proteins present in the formulation, which coincides with some stipulations [33], who pointed out that soy proteins have a high hydrophilicity, competing for the water not only with the proteins present in the formulation, but also with starch.
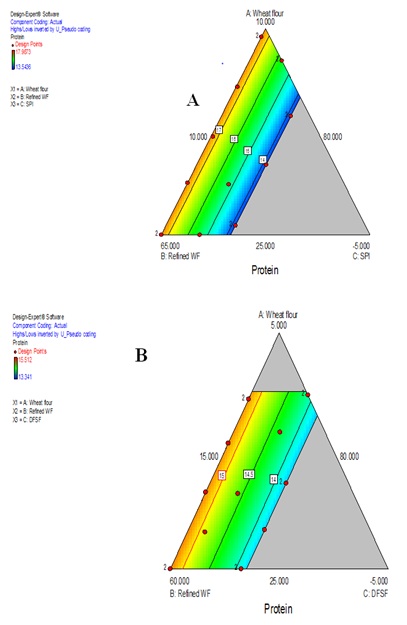 Figure 3: Effect of WF, RWF and DFSF on protein content of noodles. a) SPI based; b) DFSF based.
Fat content: Fat content varied from 0.87 to 1.0% for SPI based and 0.97 to 1.0% for DFSF based noodles with CV of 1.87 and 0.831% respectively with non significant (P>0.05) mean values. There were little variations in fat content because the entire ingredient had lower amount of fat. The model were adjusted for fat content are presented in ANOVA (Table 6 and 7) revealed that all model were significant (P<0.01) with high R2 (>0.72) for both products. The non-significant lack fit (P>0.82) indicated the model is adequate for the independent parameters for fat content for SPI based products. A similar behavior was also found for DFSF based products. The regression equation describing the effect of the process variables on the fat content of product in terms of actual level of the variables are given as:
|
*** Mixture Component Coding is U_Pseudo. *** |
||||||
|
Analysis of variance table [Partial sum of squares-Type III] |
||||||
|
Source |
Sum of Squares |
Df |
Mean Square |
F Value |
p-value Prob>F |
|
|
Model |
0.027184 |
2 |
0.013592 |
42.58544 |
<0.0001 |
Significant |
|
Linear mixture |
0.027184 |
2 |
0.013592 |
42.58544 |
<0.0001 |
|
|
Residual |
0.004149 |
13 |
0.000319 |
|
|
|
|
Lack of fit |
0.001806 |
8 |
0.000226 |
0.481461 |
0.829 |
Not significant |
|
Pure error |
0.002344 |
5 |
0.000469 |
|
|
|
|
Cor total |
0.031334 |
15 |
|
|
|
|
|
Std. dev. |
0.017865 |
|
R-Squared |
0.867578 |
|
|
|
Mean |
0.957124 |
|
Adj R-Squared |
0.847205 |
|
|
|
CV% |
1.866581 |
|
Pred R-Squared |
0.805794 |
|
|
|
*** Mixture Component Coding is UPseudo. *** |
||||||
|
Analysis of variance table [Partial sum of squares-Type III] |
||||||
|
Source |
Sum of Squares |
Df |
Mean Square |
F Value |
p-value Prob>F |
|
|
Model |
0.001822 |
5 |
0.000364 |
5.359067 |
0.0118 |
Significant |
|
Linear mixture |
0.000321 |
2 |
0.00016 |
2.358509 |
0.1448 |
|
|
WF*RWF |
0.000471 |
1 |
0.000471 |
6.927213 |
0.0251 |
|
|
WF*DFSF |
0.000537 |
1 |
0.000537 |
7.905854 |
0.0184 |
|
|
WF*DFSF |
0.000144 |
1 |
0.000144 |
2.112546 |
0.1767 |
|
|
Residual |
0.00068 |
10 |
6.80E-05 |
|
|
|
|
Lack of fit |
0.000296 |
5 |
5.93E-05 |
0.77272 |
0.6079 |
Not significant |
|
Pure error |
0.000383 |
5 |
7.67E-05 |
|
|
|
|
Cor total |
0.002501 |
15 |
|
|
|
|
|
Std. dev. |
0.008245 |
|
R-Squared |
0.728226 |
|
|
|
Mean |
0.990078 |
|
Adj R-Squared |
0.59234 |
|
|
|
CV% |
0.83277 |
|
Pred R-Squared |
0.305582 |
|
|
Fat=0.030966*WF+0.075855*RFW+0.0758*DFSF-2.5396E-4*WF2-1.37816E-3*RWF2-7.4859E-*DFSF2…………. (4) for DFSF based noodles
It is found that the interaction terms WF*RWF, RWF*DFSF and WF*DFSF are significant (P<0.05). From the regression coefficient, it is seen that RWF have high regression coefficient (8.89) indicating its better impact on fat contents on SPI based products. Fat is generally affected by DFSF but the role was meager as evident from regression equation for DFSF based noodles where all three ingredients have similar impact on fat content. For DFSF based noodles, the quadratic model showed two angle effects on the fat response, first effect under increasing consistency of fat response by the increasing refined wheat flour and other hand increasing fat by the increasing wheat flour consistency. From figure 4, lowest fat value are observed corresponding to the increasing of soy protein isolates in the composition but increased in fat percentage is due to the increasing quantity of both component wheat flour and refined wheat flour.
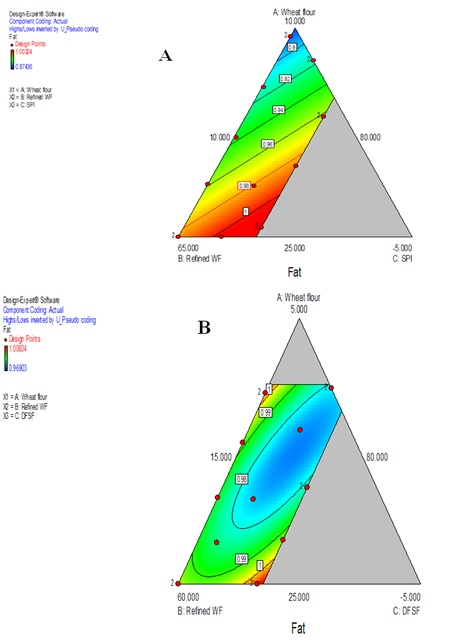 Figure 4: Effect of WF, RWF and DFSF on fat content of noodles. a) SPI based; b) DFSF based.
Generally, the protein content is believed to play a role in oil absorption in extruded product. Defeating increases the protein solubility and water absorption capacity by uncovering of hydrophilic groups in extruded starch-protein material [34] and oil absorption capacities of the extruded products [35]. Again, increase in temperature leads to starch gelatinization where depolymerisation of amylose and amylopectin resulted into the high water and fat absorption capacity of the product [36]. In contrary, Moss et al., [37] reported that noodles made from high-protein wheat flour absorbed less oil than noodles made from low-protein flour. They proposed that the high oil absorption in low-protein flour noodle was due to the formation of coarse globules during steaming, allowing oil to penetrate easily through the noodle. In our study, products having high protein contents were due to protein rich SPI which showed less oil absorption than the low protein samples. Protein content is not the sole factor influencing oil uptake, protein quality also significantly affects free oil absorption in instant noodles [38]. During moisture removal process, the spaces of water vapors may filled by fat globules causing more fat content in extruded products.
Energy content: Energy content was ranged from 338.675 to 347.321 for SPI based, and 332.87 to 387.34 Kcal for DFSF based noodle products with the CV of 0.64 and 0.29% respectively. Using t-test, it was found that mean value for both the products are statistically non significant (P<0.84, tcritical=2.11). The model were adjusted for calorie content in this mixture design, are presented in table 8 and 9. The model were significant (P<0.05; P<0.001) with non significant lack of fit (P>0.85; P>0.37) for both products.
The regression equation describing the effect of the process variables on the fat content of product in terms of actual level of the variables are given as:
|
*** Mixture Component Coding is U_Pseudo. *** |
||||||
|
Analysis of variance table [Partial sum of squares-Type III] |
||||||
|
Source |
Sum of Squares |
Df |
Mean Square |
F Value |
p-value Prob>F |
|
|
Model |
38.47702 |
2 |
19.23851 |
3.95992 |
0.0454 |
Significant |
|
Linear mixture |
38.47702 |
2 |
19.23851 |
3.95992 |
0.0454 |
|
|
Residual |
63.15801 |
13 |
4.858309 |
|
|
|
|
Lack of fit |
26.36935 |
8 |
3.296168 |
0.447987 |
0.8504 |
Not significant |
|
Pure error |
36.78867 |
5 |
7.357733 |
|
|
|
|
Cor total |
101.635 |
15 |
|
|
|
|
|
Std. dev. |
2.204157 |
|
R-Squared |
0.37858 |
|
|
|
Mean |
341.9144 |
|
Adj R-Squared |
0.282977 |
|
|
|
CV% |
0.644652 |
|
Pred R-Squared |
0.041856 |
|
|
|
Source |
Sum of Squares |
Df |
Mean Square |
F Value |
p-value Prob>F |
|
|
Model |
31.81132 |
5 |
6.362263 |
6.532988 |
0.006 |
Significant |
|
Linear mixture |
14.95817 |
2 |
7.479085 |
7.679778 |
0.0095 |
|
|
AB |
15.47507 |
1 |
15.47507 |
15.89033 |
0.0026 |
|
|
AC |
0.354093 |
1 |
0.354093 |
0.363594 |
0.5599 |
|
|
BC |
0.171868 |
1 |
0.171868 |
0.17648 |
0.6833 |
|
|
Residual |
9.738673 |
10 |
0.973867 |
|
|
|
|
Lack of fit |
5.605641 |
5 |
1.121128 |
1.356302 |
0.3731 |
Not significant |
|
Pure error |
4.133032 |
5 |
0.826606 |
|
|
|
|
Cor total |
41.54999 |
15 |
|
|
|
|
|
Std. dev. |
0.986847 |
|
R-Squared |
0.765616 |
|
|
|
Mean |
337.9824 |
|
Adj R-Squared |
0.648423 |
|
|
|
CV% |
0.291982 |
|
Pred R-Squared |
0.427936 |
|
|
Energy=6.55271*Wheat flour+3.42727*Refined wheat flour+1.56198*Defatted soy flour-0.042774*wheat flour*refined wheat flour-0.035375*wheat flour*defatted soy flour-0.025897*refined wheat flour*defatted soy flour……… (6) for DFSF based noodles
From the regression coefficients, energy content is affected by the refined wheat flour (3.49858) and followed by wheat flour (3.20271), soy protein isolate (3.18264). Refined wheat flour was shown more effect compare to other both component.
However, quadratic model followed for DFSF based noodles where all the interaction terms are negative showing their negative impact on energy content. From figure 5 (a), with the increased in WF and RWF the energy content increased for SPI based noodles but in figure 5 (b), it is seen that quadratic effect of responses showed relative effect of all components but some plot area more effected by wheat flour and refined wheat flour because high consistency energy response plot area in increasing wheat flour consistency and decreasing defatted soy flour consistency.
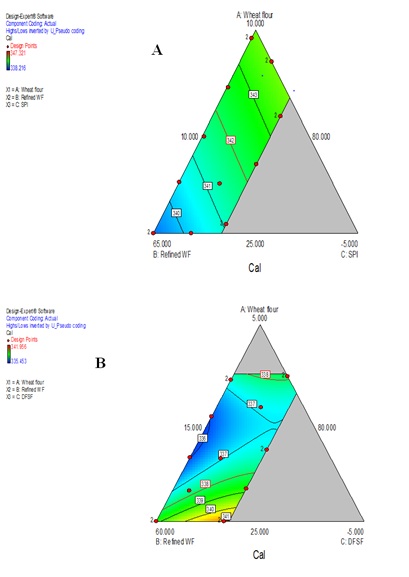 Figure 5: Effect of WF, RWF and DFSF on energy content of noodles. a) SPI based; b) DFSF based.
Optimization of process parameters
|
Formulations |
Protein Content (%) |
Fat Content (%) |
Moisture Content (%) |
Ash Content (%) |
Carbohydrate Content (%) |
Energy Contents (kcal.) |
|
Control |
8.27 |
4.78 |
6.2 |
1.96 |
79.59 |
394.46 |
|
S-1 |
16.91 |
6.85 |
6.9 |
2.26 |
67.08 |
397.61 |
|
S-2 |
16.69 |
8.80 |
6.1 |
2.72 |
66.14 |
410.52 |
|
S-3 |
16.87 |
5.59 |
5.9 |
2.23 |
68.71 |
392.63 |
Table 10: Initial quality of most accepted soy fortified and control noodles.
Quality assessment of optimized noodles
Fat contents: Addition of soy flour (DFSF, FFSF and SPI) to mixed flour markedly increased fat content than control sample. It is revealed that soy fortified noodles with 10% FFSF, 10% DFSF, 8% SPI and control formula contained 6.80%, 8.8%, 5.59% and 4.78% of fat contents respectively. Soy flour blended noodles recorded maximum fat of 8.80% in sample 2 (10% FFSF) and minimum fat 4.78% in control sample.
Moisture content: Incorporation of soy flour (DFSF, FFSF and SPI) to mixed flour slightly increased moisture content than control sample. From the table 10 it is revealed that soy fortified noodles with 10% FFSF 10% DFSF, 8% SPI and control formula contained 6.9%, 6.1%, 5.9% and 6.24% of moisture contents respectively. Soy flour blended noodles recorded maximum moisture of 6.9% in sample 1 and minimum moisture of 6.2% in control sample.
Ash contents: Addition of soy flour to mixed flour slightly increased ash content than control sample. It is revealed that (Table 10) soy fortified noodles with 10% FFSF 10% DFSF, 8% SPI and control formula contained 2.26%, 2.72%, 2.23% and 1.96% of ash contents respectively. Soy flour blended noodles recorded maximum ash content of 2.72% in sample 2 (10% FFSF) and minimum ash content of 1.96% in control sample.
Carbohydrates contents: Addition of soy flour (DFSF, FFSF and SPI) to mixed flour slightly decreased carbohydrate content than control sample. It is found that soy fortified noodles with 10% FFSF, 10% DFSF, 8% SPI and control formula contained 67.08%, 66.14%, 68.71% and 79.59% of carbohydrate contents respectively. Control sample recorded maximum of CHO 79.78%. Minimum carbohydrate content of 66.14% was observed in sample 2 (10% FFSF).
Energy contents: Fortification of soy flour (DFSF, FFSF and SPI) to mixed flour increased energy contents than control sample. Soy fortified noodles with 10% FFSF, 10% DFSF, 8% SPI and control formula contained 397.61 Kcal, 410.52 Kcal, 392.63 Kcal, and 394.46 Kcal of energy respectively. Soy flour blended noodles recorded maximum energy contents 410.52 Kcal in sample 2 (10% FFSF) and minimum energy contents of 394.46 Kcal in control sample.
Textural Properties Analysis (TPA) of soy fortified and control noodles
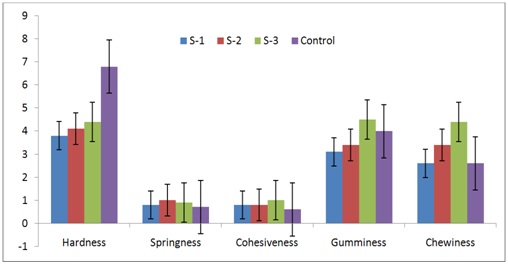 Figure 6: Textural properties of optimized noodles.
Significant (P<0.05) change in hardness of control samples was found than rest samples may be due to low protein content (8.27%) which is in agreement with the report by Leonel et al. and Singh et al. [40,41] reported that addition of fatty acids alters the physical and chemical properties of starchy foods. The springiness in S1-S3 is more elastic to control noodle, which means, these noodle easy to bounce back to its original position. Gumminess is the energy required to disintegrate a semisolid food to a state ready for swallowing and is a combination of hardness and cohesiveness [15]. The gumminess in S1-S3 noodle is pastier than control noodle as there was significant difference (P<0.05) between them. Chewiness is a combination of hardness, cohesiveness, and elasticity. In this study, control noodle is tougher than S1-S3 due to the significant existence between them. The higher value of chewiness, gumminess, cohesiveness and springiness of samples (1-3) may be due to low fat and high carbohydrate content which caused to form inclusion compounds with amylose, with the hydrocarbon portion of the lipid located within the helical cavity of amylose. This is in agreement with the report by Kaur & Singh [19].
Packaging and storage of noodles
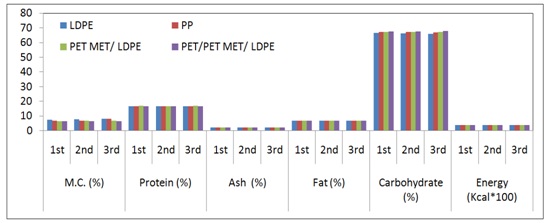 Figure 7: Variations in quality of SPI based noodles during packaging and storage for 3 months.
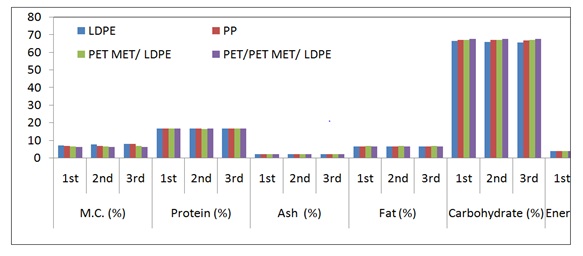 Figure 8: Variations in quality of DFSF based noodles during packaging and storage.
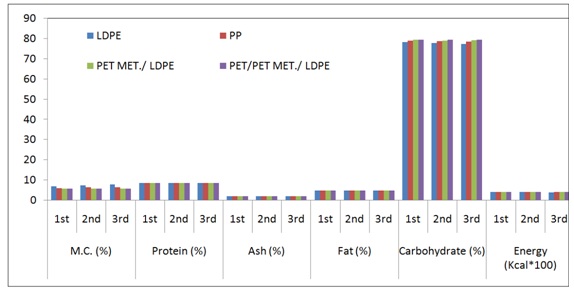 Figure 9: Variations in quality of control noodles during packaging and storage.
The moisture content was affected on the carbohydrate and energy which are related to nutrition value of noodles and quality of product. All types of soy fortifications for the development of noodles and control sample were more interactive to moisture in LDPE packaging material followed by PP, PET MET/LDPE, PET/PET MET/LDPE packages.
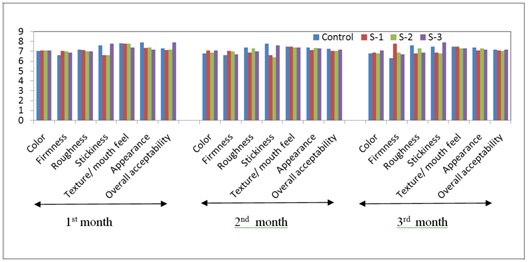 Figure 10: Mean score of soy fortified noodles obtained in sensory evaluations.
Sensory evaluation
CONCLUSION
Efforts have been made to develop nutritious protein enriched healthy noodles by incorporating soy flour at 10% DFSF, 10% FFSF and 8% SPI as per ICMR/NIN requirement for soy health claim. All three (DFSF, FFSF and SPI) noodles contained more protein when compared with control noodles. The increased substitution of soy flour (FFSF, DFSF and SPI) caused brittle and hard cooked noodles strand which reduced the chewiness and increased the firmness respectively. All types of soy fortified noodles give significant difference (P<0.05) in the term of general appearance, color and overall acceptability from control formula. On the other hand, there were no significant difference (F<0.05) among control sample and DFSF, FFSF and SPI formulas in term of stickiness and texture/mouth feel, respectively. FFSF, DFSF and SPI were used as soy protein sources in soy protein enriched noodles because of their low cost and functional food characteristics. Even FFSF cost was lower than other soy protein source (DFSF and SPI). Defatted soy flour and SPI increased the protein, ash content of the noodles keeping the fat at optimum level. It is concluded that SPI and DFSF based noodles provides the best technological responses for getting high energy content and low fat content noodles products with more favourable sensory evaluation. This study focuses to develop the process for production of nutritionally balanced formulated and functional noodles in meeting the intended nutritional requirements and is also accessible to the young children at minimum possible cost. The new products were highly appreciated by the school children when it was given after mid-day-meal.
REFERENCES
- Hou G, Jimenez V (2012) Development of barley fortified instant noodles. AACC international, Minnesota, USA.
- Owen G (2001) Cereal processing technology. Elsevier, Amsterdam, Netherlands. Pg no: 1-248.
- Kulkarni SS, Desai AD, Ranveer RC, Sahoo AK (2012) Development of nutrient rich noodles by supplementation with malted ragi flour. International Food Research Journal 19: 309-313.
- Messina MJ (1999) Legumes and soybeans: overview of their nutritional profiles and health effects. Am J Clin Nutr 70: 439-450.
- Kaur GJ, Rehal J, Singh, AK, Singh B, Kaur A (2014) Optimization of extrusion parameters for development of ready-to-eat breakfast cereal using RSM. Asian J Dairy & Food Res 33: 77-86.
- Swaminathan M (1968) The nutrition and feeding of infants and preschool children in the developing countries. World Rev Nutr Diet 9: 85-123.
- Giri SK, Mangaraj S (2012) Processing influences on composition and quality attributes of soymilk and its powder. Food Engineering Reviews 4: 149-164.
- Sabbatini SB, Sánchez HD, de la Torre MA, Osella CA (2015) Influence of raw materials rich in proteins on the quality of gluten-free noodles. International Journal of Nutrition and Food Sciences 4: 169-172.
- C?pri?? R, C?pri?? A, Cre?escu I (2010) Protein solubility as quality index for processed soybean. Animal Science and Biotechnologies 43: 375-378.
- Mangaraj S, Tripathi MK, Kulkarni SD (2011) Role of processing industry for food security in India. In: Greco AJ (ed.). Progress in Food Science and Technology: Advances in Food Science and Technology. Nova Science Publishers, New York, USA.
- Tripathi MK, Mangaraj S, Kulkarni SD (2010) Isoflavones-A soybean phytoestrogen: Significance in human health. J Adv Res Biol Sci 2: 123-135.
- Tripathi MK, Mangaraj S (2011) Soy food in demand: a present and future perspective. In: Maxwell JE (ed.). Soybean: Cultivation, uses and nutrition. Nova Science Publishers, New York, USA.
- Tripathi MK, Mangaraj S (2013) Effect of coagulants on nutrient and anti nutrient parameters of soy tofu. Trends Biosci 6: 158-160.
- Singh R, Singh G, Chauhan GS (1996) Effect of incorporation of defatted soy flour on the quality of biscuits. J Food Sci Technol 33: 355-357.
- Mangaraj S, Tripathi M K, Ali N (2013) Handbook of Nutraceuticals and Functional Food-Soybean as an Example. Satish Serial Publication, New Delhi, India.
- Messina M (1995) Modern applications for an ancient bean: Soybeans and the prevention and treatment of chronic disease. J Nutr 125: 567-569.
- Tripathi MK, Mangaraj S, Kumar M, Sinha LK, Giri SK, et al. (2015) Effect of processing condition on the quality and beanie flavor of soymilk. Current Science 109: 1164-1171.
- Nagarajan S (2010) Mechanisms of anti-atherosclerotic functions of soy-based diets. J Nutr Biochem 21: 255-260.
- Kaur K, Singh N (2000) Amylose-lipid complex formation during cooking of rice flour. Food Chemistry 71: 511-517.
- Osorio DP, Acevedo AE, Vinalay MM, Tovar J, Bello-Pérez LA (2008) Pasta added with chickpea flour: Chemical composition, in vitro starch digestibility and predicted glycemic index. Ciencia y Tecnologia Alimentaria 6: 6-12.
- Young-Soo K (1998) Quality of wet noodles prepared with wheat flour and mushroom powder. Korean Journal of Food Science and Technology 30: 1373-1380.
- Bui LTT, Small DM (2007) The influence of formulation and processing on stability of thiamin in three styles of Asian noodles. Food Chemistry 102: 1394-1399.
- Rathi A, Kawatra A, Sehgal M (2004) Influence of depigmentation of pearl millet (Pennisetum glaucum L.) on sensory attributes, nutrient composition, in vitro protein and starch digestibility of pasta. Food Chemistry 85: 275-280.
- Marques M, Bora, PS, Narain N (2000) Development of some high protein conventional foods based on wheat and oilseed flours. J Food Sci Technol 37: 394-399.
- Nielsen MA, Summer AK, Whalley LL (1980) Fortification of pasta with pea flour and air classified pea protein concentrate. Cereal Chemistry 57: 203-206.
- Sudha ML, Leelavati K (2012) Effect of blends of dehydrated green pea flour and amaranth seed flour on the rheological, microstructure and pasta making quality. J Food Sci Technol 49: 713-720.
- Kaur G, Sharma S, Nagi HP, Ranote PS (2013) Enrichment of pasta with different plant proteins. J Food Sci Technol 50: 1000-1005.
- Hou G, Kruk M (1979) Asian noodle technology. Technical Bulletin 20: 1-10.
- Indian Council of Medical Research (1989) Nutrient Requirements and Recommended Dietary Allowances for Indians. National Institute of Nutrition, Indian Council of Medical Research, New Delhi, India.
- Ugar?i?-Hardi Z, Hackenberger D, Šubari? D, Hardi J (2003) Effect of soy, maize and extruded maize flour addition on physical and sensory characteristics of pasta. Italian journal of Food Sciences 15: 277-285.
- Cochran WG, Cox GM (1964) Experimental designs. John Wiley & Sons, New York, USA.
- Sudha ML, Rajeswari G, Venkateswara Rao G (2010) Influence of defatted soya flour and whey protein concentrates on dough rheological characteristics and quality of instant vermicelli. Journal of Texture Studies 42: 72-80.
- Ryan KJ, Brewer MJ (2007) In situ examination of starch granule-soy protein and wheat protein interactions. Food Chemistry 104: 619-629.
- Marzec A, Lewicki PP (2006) Antiplasticization of cereal-based products by water. Part I: Extruded flat bread. Journal of Food Engineering 73: 1-8.
- Bhise S, Kaur A, Manikantan MR, Singh B (2013) Optimization of extrusion process for production of texturized flaxseed defatted meal by response surface methodology. International Journal of Research in Engineering and Technology 2: 302-310.
- Swapnil K, Hiregoudar S, Beladhadi RV, Hosamani A, Ramachandra CT, et al. (2015) Optimization of extrusion process parameters for the development of foxtail millet based extruded snacks. Karnataka J. Agric Sci 28: 301-303.
- Moss R, Gore PJ, Murray IC (1987) The influence of ingredients and processing variables on the quality and microstructure of hokien, cantonese and instant noodles. Food Structure 6: 63-74.
- Park CS, Baik BK (2004) Cooking time of white salted noodles and its relationship with protein and amylose contents of wheat. Cereal Chemistry 81: 165-171.
- Stanley DW (1986) Chemical and structural determinants of texture of fabricated foods. Food Tech 40: 65-68.
- Leonel M, Martins JC, Mischan MM (2010) Produção de snacks funcionais à base de farinha de soja e polvilho azedo. Ciência Rural 40: 1418-1423.
- Singh N, Cairns P, Morris VJ, Smith AC (1998) Physical properties of extruded wheat starch-additive mixture. Cereal Chemistry 75: 325-330.
Citation: Mangaraj S, Swain S, Deshpande SS (2018) Development of Nutritious Healthy Noodles Incorporating Soy Based Functional Food Ingredients. J Food Sci Nut 4: 028.
Copyright: © 2018 Mangaraj S, et al. This is an open-access article distributed under the terms of the Creative Commons Attribution License, which permits unrestricted use, distribution, and reproduction in any medium, provided the original author and source are credited.