DNA Tools to Establish Species and Individual Identity of Confiscated Biological Samples in Wildlife Related Crime: A Case Report
*Corresponding Author(s):
Ajay GaurLaboratory For The Conservation Of Endangered Species Lacones, CSIR-Centre For Cellular And Molecular Biology, Hyderabad, India
Tel:+91 4024006433,
Email:agaur@ccmb.res.in
Abstract
DNA techniques are prominently used in forensic investigations involving poaching and illegal trade of endangered animals. In the present case study, we could establish the link between crime scene and seized samples successfully using DNA markers. Three persons were caught, while trespassing the forest area near Badmalhera, Madhya Pradesh, India. Range forest officer seized skin and flesh of wild animal from these persons. The officer also found blood stains on stones and leaves at the suspected spot of crime. The samples seized from the accused and those collected from the crime spot were forwarded to our laboratory to identify species and to establish relatedness amongst the samples, if any. Species identification was done using universal primers’ for mitochondrial cytochrome b gene. All the forwarded samples were found to be of same species i.e., Indian spotted deer. Further, genotyping with eight polymorphic microsatellites revealed that the samples seized from the accused were similar to blood stains found at the crime spot.
Keywords
INTRODUCTION
Conservation and protection assumes greater significance in the present scenario because of increased pressure on forest and the monetary value involved in the wildlife trade. India plays a major role in illegal wildlife trade as an importer, exporter and a conduit for wildlife that enters the $25 billion annual global trade [1,2].
The greatest challenges for enforcement agencies are to detect illegal poaching and trading of wildlife and to obtain concrete evidence for the same. DNA Forensics has become a major tool in wild life crime investigation [3]. DNA analysis is not limited to only species identification but use of DNA for individual identification in wildlife forensic applications has also increased significantly [4]. This involves investigation to determine if two confiscated samples are from the same individual, to determine the pedigree of a particular individual or for questions requiring assignment to population of origin [5,6].
In this case, both mitochondrial cytochrome b (cyt b) and nuclear microsatellites were used to establish the species and individual identity to link the evidences collected from the spot of crime and seized from the accused.
MATERIAL AND METHODS
Case report
DNA isolation
Species identification
Individual identification
RESULTS AND DISCUSSION
In the present study, high molecular weight DNA was obtained from all the four samples namely WL1751, WL1752, WL1753 and WL1754. The cyt b sequences obtained for all four samples were aligned and compared with cyt b sequences of the vast number of known animal species in CCMB database and closely related Indian species i.e., Axis axis, Axis porcinus, Cervus unicolor, Antelope cervicapra and Boselaphus tragocamelus available in mitobase of NCBI (Respective accession numbers were JN093092.1, AY035874.1, FJ556575.1, AF022058.1, and AJ222679.1), using MEGA 6.0. Sequence comparison shows total 116 variations in total (Table 1) and pairwise comparisions differentiated all investigated species by a minimum of 33 nucleotide variations and the sequences obtained from seized samples showed maximum similarity (>99%) with Axis axis i.e., Indian spotted deer (Table 2).
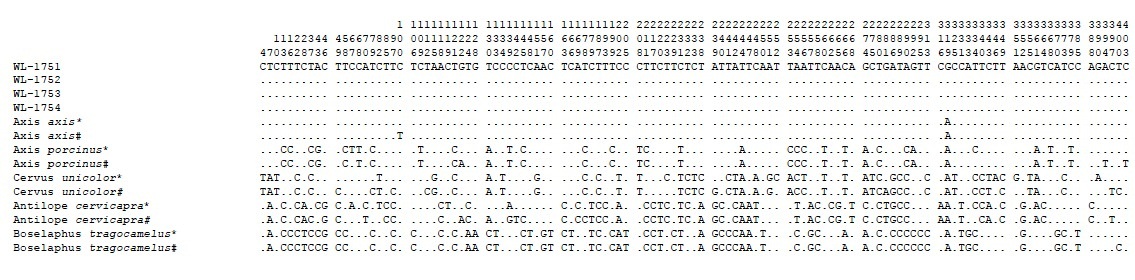
#Reference sequences obtained from NCBI Genbank (JN093092.1, AY035874.1, FJ556575.1, AF022058.1, and AJ222679.1)
| 1 | 2 | 3 | 4 | 5 | 6 | 7 | 8 | 9 | 10 | 11 | 12 | 13 | 14 | ||
| 1 | WL-1751 | 0 | 0 | 0 | 0 | 1 | 2 | 33 | 34 | 50 | 53 | 58 | 60 | 63 | 64 |
| 2 | WL-1752 | 100 | 0 | 0 | 0 | 1 | 2 | 33 | 34 | 50 | 53 | 58 | 60 | 63 | 64 |
| 3 | WL-1753 | 100 | 100 | 0 | 0 | 1 | 2 | 33 | 34 | 50 | 53 | 58 | 60 | 63 | 64 |
| 4 | WL-1754 | 100 | 100 | 100 | 0 | 1 | 2 | 33 | 34 | 50 | 53 | 58 | 60 | 63 | 64 |
| 5 | Axis axis | 99.8 | 99.75 | 99.75 | 99.75 | 0 | 1 | 32 | 33 | 49 | 52 | 57 | 59 | 62 | 63 |
| 6 | A. axis (JN093092.1) | 99.5 | 99.51 | 99.51 | 99.51 | 99.8 | 0 | 33 | 34 | 50 | 53 | 58 | 60 | 63 | 64 |
| 7 | Axis porcinus | 91.9 | 91.85 | 91.85 | 91.85 | 92.1 | 91.85 | 0 | 5 | 49 | 49 | 68 | 66 | 58 | 59 |
| 8 | A. porcinus (AY035874.1) | 91.6 | 91.6 | 91.6 | 91.6 | 91.9 | 91.6 | 98.77 | 0 | 52 | 52 | 72 | 65 | 61 | 62 |
| 9 | Cervus unicolor | 88.6 | 88.64 | 88.64 | 88.64 | 88.9 | 88.64 | 87.9 | 87.2 | 0 | 14 | 67 | 67 | 73 | 74 |
| 10 | C. unicolor (FJ556575.1) | 87.7 | 87.65 | 87.65 | 87.65 | 87.9 | 87.65 | 87.9 | 87.2 | 96.5 | 0 | 65 | 63 | 68 | 67 |
| 11 | Antelope cervicapra | 85.9 | 85.93 | 85.93 | 85.93 | 86.2 | 85.93 | 84.2 | 83.2 | 84 | 84 | 0 | 14 | 55 | 56 |
| 12 | A. cervicapra (AF022058.1) | 85.4 | 85.43 | 85.43 | 85.43 | 85.7 | 85.43 | 84.69 | 84.9 | 84 | 84 | 96.5 | 0 | 56 | 57 |
| 13 | Boselaphus tragocamelus | 84.7 | 84.69 | 84.69 | 84.69 | 84.9 | 84.69 | 86.17 | 85.4 | 83 | 84 | 86.4 | 86.2 | 0 | 1 |
| 14 | B. tragocamelus (AJ222679.1) | 84.4 | 84.44 | 84.44 | 84.44 | 84.7 | 84.44 | 85.93 | 85.2 | 82.7 | 84 | 86.2 | 85.9 | 100 | 0 |
Further, eight pairs of microsatellite loci were successfully amplified in all samples and showed the presence of same allele for each locus (Table 3). The relationship calculated between four samples by estimation of LR value was 1.00, which indicates that the blood stains on stones, leaves and samples seized from the accused belonged to same individual animal. For reference, the LR values between the four samples and other Indian spotted deer available in CCMB in-house database was 0.00, which proves the significant similarity at the level of microsatellite loci. Based upon the forensic evidences obtained, the accused were taken into custody under Indian Wildlife Protection Act (1973) for wildlife poaching and cruelty towards wild animals. We could detect the crime more effectively and establish a link between the evidences and the suspect with a significant degree of confidence. This particular case report once again emphasizes the role of DNA tools in the fight against poaching of endangered and protected species.
| Locus | WL-1751 | WL-1752 | WL-1753 | WL-1754 | ||||
| Allele 1 | Allele 2 | Allele 1 | Allele 2 | Allele 1 | Allele 2 | Allele 1 | Allele 2 | |
| Ca13 | 210 | 218 | 210 | 218 | 210 | 218 | 210 | 218 |
| Ca18 | 128 | 128 | 128 | 128 | 128 | 128 | 128 | 128 |
| Ca30 | 301 | 307 | 301 | 307 | 301 | 307 | 301 | 307 |
| Ca42 | 128 | 150 | 128 | 150 | 128 | 150 | 128 | 150 |
| Ca38 | 172 | 190 | 172 | 190 | 172 | 190 | 172 | 190 |
| Ca60 | 320 | 320 | 320 | 320 | 320 | 320 | 320 | 320 |
| Ca71 | 311 | 327 | 311 | 327 | 311 | 327 | 311 | 327 |
| Ca75 | 190 | 202 | 190 | 202 | 190 | 202 | 190 | 202 |
Table 3: Observed allele size in Base Pair (bp) in four confiscated samples.
ACKNOWLEDGE
The authors would like to acknowledge the financial support from CSIR and CZA, Government of India.
REFERENCES
- Menon V, Kumar A (1999) Wildlife Crime: An enforcement Guide, Natraj Publisher, Dehra Dun, India.
- International Consortium on combating wildlife crime (2013) CITES Progress Report. Convention on International Trade in Endangered Species of wild Fauna and Flora, Geneva Switzerland.
- Gaur A, Singh CS, Sreenivas A, Singh L (2012) DNA-based identification of a snake in a wine bottle using universal primers: a case of mistaken identity. Forensic Sci Int 214: 51-53.
- Johnson RN, Wilson-Wilde L, Linacre A (2014) Current and future directions of DNA in wildlife forensic science. Forensic Sci Int Genet 10: 1-11.
- Gaur A, Reddy A, Annapoorni S, Satyarebala B, Shivaji S (2005) The origin of Indian star tortoises (Geochelone elagans) based on nuclear and mitochondrial DNA analysis: a story of rescue and repatriation. Conser Genet 7: 231-240.
- Singh A, Gaur A, Shailaja K, Satyare Bala B, Singh L (2004) A novel microsatellite (STR) marker for forensic identification of big cats in India. Forensic Sci Int 141: 143-147.
- Sambrook J, Fristish EF, Maniatis T (1989) Molecular Cloning: A laboratory manual. (2ndedn), Cold Spring Harbor Press, New York, USA 1: 40-41.
- Verma SK, Singh L (2003) Novel universal primers establish identity of enormous number of animal species for forensic application. Mol Ecol Notes 3: 28-31.
- http://www.ncbi.nlm.nih.gov/sites/entrez?db=nucleotide
- Kumar S, Nei M, Dudley J, Tamura K (2008) MEGA: a biologist-centric software for evolutionary analysis of DNA and protein sequences. Brief Bioinform 9: 299-306.
- Gaur A, Singh A, Arunabala V, Umapathy G, Shailaja K, et al. (2003) Development and characterization of 10 novel microsatellite markers from Chital deer (Cervus axis) and their cross-amplification in other related species. Mol Ecol Notes 3: 607-609.
- Kalinowski ST, Wagner AP, Mark TL (2006) ML-RELATE: a computer program for maximum likelihood estimation of relatedness and relationship. Mol Ecol Notes 6: 576-579.
Citation: Modi N, Sreenivas A, Tabasum W, Gaur A (2015) DNA Tools to Establish Species and Individual Identity of Confiscated Biological Samples in Wildlife Related Crime: A Case Report. J Forensic Leg Investig Sci 2: 006.
Copyright: © 2016 Noopur Modi, et al. This is an open-access article distributed under the terms of the Creative Commons Attribution License, which permits unrestricted use, distribution, and reproduction in any medium, provided the original author and source are credited.