Do Commercial Probiotics Influence The Fatty Acid Composition And Lipid Indices Of European Catfish (Silurus Glanis L.) Grown In a Recirculating Aquaculture System?
*Corresponding Author(s):
Grazina ZibieneVytautas Magnus University, K. Donelaicio G. 58, Kaunas, LT - 44248, Lithuania
Email:grazina.zibiene@vdu.lt
Abstract
This experiment evaluated the influences of a commercial probiotic on the fatty acid and lipid indices of European catfish grown in a recirculating aquaculture system. To conduct the experiment, two experimental fish groups, each in triplicate, were divided into six tanks containing 30 fish each. The growing conditions for the fish in the trial tanks were identical. However, 1 ml of a commercial Smart Fishery probiotic was added to the water in three tanks every other day. In this study, the use of a probiotic was observed to significantly affect the growth performance of European catfish. The composition of muscle tissue in three catfish from each tank was also examined, and 25 fatty acids were identified. We observed statistically significant differences in the sum of each acid in the two groups (Saturated Fatty Acid (SFA), Monounsaturated Fatty (MUFA) Acid, and Polyunsaturated Fatty Acid (PUFA), (P<0.05)). The group raised with probiotics had higher contents of SFA and MUFA than the control group. In both groups, the n-6/n-3 ratio was within the range recommended by the World Health Organization but was higher in the probiotics group. Indices of atherogenicity and thrombogenicity were higher in the probiotic group, while higher flesh-lipid quality and more hypocholesterolemic acid were observed in the control group. Based on a comparison of the essential n-6 and n-3 fatty acid content and their ratios and lipid indices, better results were obtained in fish rearing without probiotics. Commercial Smart Fishery probiotics could thus be successfully used to increase the growth performance of European catfish. The use of probiotics in growing water did not significantly impair the fatty acid composition of European catfish meat and could be used as an additive in a healthy human diet.
Keywords
Commercial probiotic; Freshwater fish; Lipid indices; MUFA; PUFA; RAS; SFA
Introduction
The European catfish naturally lives in, or was introduced to, Eastern Europe in the basins of the Baltic, Black, Caspian, and Aral Seas [1]. Because of its rapid growth rate and high commercial value, in the last few years, the economic importance of the European catfish S. glanis has increased in many central and eastern European countries [2]. According to the Eurofish International organization, the growth rates of European catfish have remained stable in the European Union (EU) since 2010 (over 1000 tonnes are reared per year).
Although the European catfish is considered a fast-growing fish, it is recommended that catfish be grown in intensive aquaculture systems to shorten the fish’s growing time to 7-8 months (from eggs to a market size of 1.5 kg) [3].
The use of probiotics is a conventional practice in aquaculture. In a previous article, [4] presented generalized information about probiotic administration in aquaculture, with systematic information on the use of probiotics in aquaculture provided in their review article. Many experiments have shown that probiotics encourage growth, improve water quality, increase fish growth performance, and can help to prevent disease [4-6]. Previous authors have outlined several methods for probiotic use, including injections, direct addition to the water in which the animals are reared, and probiotic use with live and/or processed feed. Probiotics can be directly poured into the water in the growth tank from the first day of incubation, allowing the growth conditions to improve in later stages [7,8]. Moreover, liquid probiotics can be used simultaneously in the growth tank water and live feed supplied to larvae. Many authors [9-13] have discussed the use of various types of probiotics in aquaculture for disease control, prophylaxis, and improving water quality and growth parameters.
Fish represent an important source of fat and protein in the human diet and improve protection against heart and vascular diseases. The European catfish is desirable because of its white boneless fillet, which has a very pleasant taste and texture and contains a low content of fat, thereby making this fish a valuable addition to the human diet (https://www.tv3.lt/naujiena/gyvenimas/neatrastas-samas-ne-tik-skani-bet-ir-sveikatai-naudinga-zuvis-n1102596). Fatty acids are the main components of cell membranes [14]. Unsaturated fatty acids are very important to organisms and are more valuable than the saturated fatty acids prevalent in fatty muscle tissue and dairy products [15]. Some omega acids are not synthesized in the human body and must be ingested with food. These omega acids include eicosapentaenoic (EPA, C20:5 n-3), docosahexaenoic (DHA, C22:6 n-3), and arachidonic (20:4 n-6). These essential polyunsaturated fatty acids are found in the muscle tissues of freshwater and marine fish [14,16,17]. Considerable research has been conducted on the fatty acids present in naturally and artificially reared fish, and information on the content of these omega acids present in the muscle tissues of various fish is available. The content of fatty acids in fish muscle tissue depends on the age of the fish, the species, the animal’s diet, and environmental factors such as salinity, temperature, season, geographical location, and whether the fish are farmed or wild [15,17-19].
Supplementing a fish diet with probiotics can improve the intestinal microbiota and lead to changes in metabolism and energy expenditure [20]. The use of probiotics also strengthens the host’s immune system and increases its resistance to pathogens, improves overall health, and indirectly promotes nutrition and growth [21]. These effects highlight the potential for probiotics to enhance fish health by manipulating the fish gut microbiota [22,23] determined that Pediococcus pentosaceus could be used as a beneficial probiotic to improve the growth performance, digestive enzyme activity, and haemato-immunological responses in a common carp culture.
[24] examined the ontogenetic variations in lipid class composition and fatty acid partitioning between neutral and polar lipids of haddock (Melanogrammus aeglefinus) larvae in relation to changes in diet and the microbial environment. The larvae exposed to Arthrobacter sp. showed a superior rate of increase in dry mass and lipid accumulation compared to the control groups, suggesting that Arthrobacter sp. enhanced the general health of the haddock larvae by modifying their bacterial microflora. [25] determined that probiotics could be used to enhance the protein and lipid content in tilapia farming, thereby improving the taste and smell of the fish. In another study with yellowtail (Seriola dumerili), the dietary inclusion of probiotics in the fish’s diet seemed to support the recovery of intestine histology [26].
As stated in [27] most of these probiotics are derived from terrestrial sources and not from the environment in which the aquatic animals live or the host animal. In recent years, there has been great interest in the use of host-derived probiotics in the aquaculture industry. The benefits of host-associated probiotics include improved growth performance, feed value, enzymatic contribution to digestion, inhibit adherence, and colonization of pathogenic microorganisms in the gastrointestinal tract, increase hematological parameters, and immune response [27-32] provide a review of use of probiotic Shewanella putrefaciens SpPdp11, isolated from the skin of healthy gilthead seabream were investigated in two commercially important fish species in aquaculture (gilthead seabream and Senegalese sole). The results have shown that oral administration of SpPdp11 (viable or non-viable) as a probiotic in the culture of gilthead seabream and Senegalese sole has several stimulatory effects and can be highly effective by contributing to host metabolism, nutrition, growth, immune response, stress response, disease resistance, and fish survival. The first report of the improvement of growth and health of B. gonionotus fishes by its gut bacteria was published in 2021 [33]. This study [33] was aimed to isolate and identify probiotic bacteria from the gut of Barbonymus gonionotus and evaluate their effects on growth, hematological parameters, and breeding performances of the host. The application of these probiotics significantly increased gut lactic acid bacteria and activities of digestive enzymes but did not show any antibiotic resistance nor any cytotoxicity in vitro. A similar results were obtained examine Bacteriocinogenic and Non-Bacteriocinogenic Lactic Acid Bacteria strains previously isolated from the intestines of Nile tilapia and Common carp and that showed potent antibacterial activity against host-derived and non-host derived fish pathogens were assayed for their probiotic and safety properties so as to select promising candidates for in vivo application as probiotic in aquaculture [34]. As reported in the [35], 18 LAB strains isolated from the intestinal contents of Cyprinus carpio, were effective in improving growth, innate immunity and disease resistance.
There is a lack of research on the use of probiotics during the growth of European catfish, especially in RAS. The aim of this research is to determine the fatty acid composition of muscle tissue of European catfish (Silurus glanis) when commercial probiotics are used in the rearing water and to simultaneously examine the suitability of the muscle tissue of this catfish for human consumption as a source of omega-3 and omega-6 fatty acids.
Materials And Methods
- Experimental design
The experiment was conducted at the Vytautas Magnus University Aquaculture Centre Laboratory. Catfish were brought in from the Simnas division of the Fisheries Service under the Ministry of Agriculture of the Republic of Lithuania. The experiment started after 14 days, at which point the fish had adapted to their new living conditions. The fish were fed Alltech Coppens Supreme-15 feed. Fish health was assessed visually; the fish were active and well fed and featured no spots or wounds on the skin.
The fish were placed into six separate identical tanks, with 30 fish of similar biomass in each tank. The Control Group (CG) biomass was 5945 g, and the group given probiotics (PG) had a starting biomass of 5993 g. The average weight of the fish was 131.88 ± 38.72 and 133.18± 53.91 g in CG and PG, respectively.
The growing tanks were rectangular with rounded corners and a volume of 1.1 m3. The tanks were filled to a 0.6 m3 volume. Each tank was equipped with a separate water treatment system, in which the water was passed through brushes, porous sponges, and volcanic stones and then returned to the tanks. In this system, brushes, sponges, and volcanic stones acted as biological filters, and the brushes also trapped solid materials in the water. Water circulation was ensured using a pump with 20 W of power, a lifting height of 2.8 m, and efficiency of 3.6 m3/h.
The experiment lasted for six weeks. The fish were weighed every two weeks using scales with an accuracy of 0.1 g.
The feeding rate was calculated according to the recommendations provided by the manufacturer of the Alltech Coppens Supreme-15 after weighing the fish and selecting the correct feed percentage of biomass according to the water temperature and the size of the fish. The feed percentage of biomass ranged from 1.93% at the beginning of the experiment to 0.90% at the end of the experiment.
The fish in both groups were fed Alltech Coppens Supreme-15 feed. The composition of this feed is presented in (Table 1).
|
Ingredients |
Content |
|
Protein (%) |
46 |
|
Fat (%) |
15 |
|
Crude (%) |
1,9 |
|
Ash (%) |
6,0 |
|
Total P (%) |
0,87 |
|
Vitamin A (IE/kg) |
10.000 |
|
Vitamin D (IE/kg) |
2.700 |
|
Vitamin E (mg/kg) |
200 |
|
Vitamin C (mg/kg) |
500 |
Table 1: Composition of the Alltech Coppens Supreme-15 Feed.
The feeding rate was calculated according to the recommendations provided by the manufacturer of the Alltech Coppens Supreme-15 after weighing the fish and selecting the correct feed percentage of biomass according to the water temperature and size of the fish. The feed percentage of biomass ranged from 1.93% at the beginning of the experiment to 0.90% at the end of the experiment.
In this study, Smart Fishery probiotics from Baltic Probiotics Ltd. (Latvia) were used. Smart Fishery is a biological product produced by natural fermentation whose ingredients include effective microorganisms. This product is bio-degradable and completely safe for humans, animals, and plants. The composition of Smart Fishery probiotics includes Lactobacillus spp., Bifidobacterium spp., Lactococcus spp., Saccharomyces cerevisiae, yeast culture, sugar cane molasses, natural mineral powder, sea salt, herbal extracts, and water that has not been treated with chlorine. The total level of microorganisms in the probiotic suspension used in the study was 1.5 x 10⁶ CFU/ml. One milliliter of probiotic was mixed with 1 l of rearing water, and the mixture was then poured into the tank at a specific time every other day according to the manufacturer’s recommendations.
The survival rate of the fish during the experiment was 100%.
- Growth and feed utilization
The following equations were used to calculate the weight gain (Wg), Feed Conversion Ratio (FCR), and Specific Growth Rate (SGR) [36].
Weight gain (Wg) was calculated as follows: 
where Wg is the weight gain (g); Wt is the weight at the end of the experiment (g), and Wo is the weight at the start of the experiment (g).
FCR was calculated as follows:
 SGR in %/day was calculated as follows:
 where t duration of the experiment (in days).
- Determination of the chemical composition and fatty acid profiles
Three catfish from each tank were used to analyze the muscle tissue quality. The analysis was performed at the Center of Animal Husbandry Selections, Breeding Values, and Dissemination at Vytautas Magnus. The structure of intramuscular fatty acids was determined using the gas chromatography method by analyzing the methyl esters of the fatty acids (Shimadzu GC—2010 PLUS, Shimadzu Corporation, Japan). The muscle tissue pH value was measured using a pH-meter (Hanna HI-2002-02, Hanna Instruments Inc., and Woonsocket, Rhode Island, USA) with a glass electrode standardized for pH 4.6 and 7.0. The dry materials were estimated using an automatic moisture analyzer (RADWAG, MA 50/1.R, Poland). The water-holding capacity was determined using the Hamm pressing method (1972) [37]. The fat content was determined using the Soxhlet extraction method [38] , and the protein content was determined according to the Kjeldahl method described in [39].
- Lipid quality indices
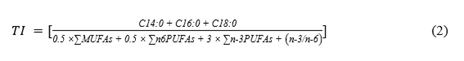
The atherogenicity index (IA) and thrombogenicity index (TI) were used to assess the lipid quality of the fish muscle tissue [39,40]. These assessments were calculated as follows:
Atherogenic Index (IA):
 Thrombogenic Index (TI):
 Hypocholesterolemic/hypercholesterolemic index [41]:
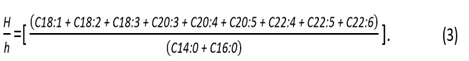 The Flesh-Lipid Quality (FLQ) indicates the percentage of the correlation between the main n-3 PUFA (EPA +DHA) and the total lipids and is calculated as follows [42]:

- Statistical analysis
The homogeneity of the analyzed parameters was confirmed using Levene‘s test. A one-way analysis of variance (ANOVA) was used to determine significant differences in chemical and fatty acid composition and lipid quality indices between the tested groups. Differences were considered significant at P < 0.05. The statistical analysis was conducted using the STATISTICA 10 program.
Results
- Growth performance and feed conversion ratio
The average weight per fish at the beginning of the experiment was 131.88 ± 38.72 g in CG and 133.18 ± 53.91 g in PG. At the end of the experiment, the average weight increased to 267.89 ± 73.47 g in CG and 305.35 ± 107.9 g in PG (Figure 1). A statistically significant result was acquired (P < 0.05) when comparing the weight gain from the beginning to the end of the experiment. The condition factor at the end of experiment was 0.88±0.09 in CG and 0.93±0.08 in PG
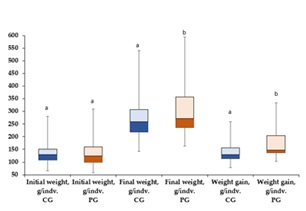 Figure 1: Box plot for changes in weight and weight gain of S. glanis during the study period. Bars with the same letters are not significantly different (ANOVA test, P < 0.05).
The SGR was higher in the PG. At the end of the experiment, the difference between the CG and PG was only 15.6%/d (with a CG and PG of 5.11 ± 0.29 %/d and 6.06±0.63 %/d, respectively); the difference was significant (P >0.05). Moreover, the SGR was highest in PG (Figure 2), and the difference was found to be significant (P < 0.05) based on a comparison of the CG and PG SGR data from the beginning to the end of the experiment.
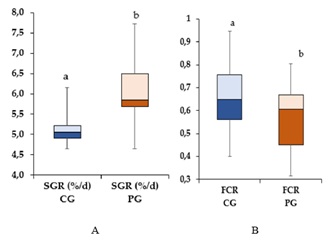 Figure 2: Box plot for changes in the Specific Growth Rate (A) and Feed Conversion Rate (B) of S. glanis during the study period. Bars with the same letters are not significantly different (ANOVA test, P < 0.05)
At the end of the experiment, the CG FCR was 0.71±0.17, while in the PG, it was 0.62±0.13 (Figure 2B). After comparing the CG and PG FCR data, a significant difference was noted (P < 0.05).
Chemical composition and fatty acid profiles and lipid indices of muscle tissue in European catfish
Despite the pH, all the measured compositional characteristics were different (P<0.05, Table 2). The muscle tissue from CG contained a larger content of dry material than that in the filets from PG. Further, the moisture, fat, ash, and protein content was higher in PG.
|
|
Dry matter % |
pH |
Moisture % |
Fat % |
Ash % |
Protein % |
|
CG |
21.22 ± 0.824b |
6.26 ± 0.086a |
61.51 ± 0.153a |
1.05 ± 0.023a |
0.92 ± 0.020a |
16.14 ± 0.049a |
|
PG |
18.92 ± 0.407a |
6.28 ± 0.085a |
62.88 ± 0.250b |
1.39 ± 0.017b |
1.03 ± 0.015b |
18.60 ± 0.080b |
Table 2: Chemical composition (mean ± STD) of the muscle tissue of European catfish grown in RAS with and without probiotics.
Means in a column followed by a different letter were significantly different at P < 0.05.
During the experiment, 26 fatty acids were identified (Table 3). The total percentage of saturated fatty acids was not significant (P>0.05). The most prevalent saturated fatty acids were C18:0 in CG and C16:0 in PG. The content of C14:0, C15:0, C17:0, C21:0, and C22:0 fatty acids was higher in CG than that in PG. Only the C16:0 and C20:0 fatty acids were more prevalent in PG.
|
Fatty acids |
Control group |
Probiotics group |
|
C12:0 |
0.889 ± 0.003b |
0.338 ± 0.003a |
|
C14:0 |
0.365 ± 0.305 b |
0.211 ± 0.047a |
|
C15:0 |
0.78 ± 0.062b |
0.583 ± 0.054a |
|
C16:0 |
1.777 ± 0.098a |
4.624 ± 0.228b |
|
C17:0 |
0.645 ± 0.040b |
0.44 ± 0.087a |
|
C18:0 |
3.288 ± 0.188b |
2.872 ± 0.170a |
|
C20:0 |
2.246 ± 0.215a |
3.08 ± 0.122b |
|
C21:0 |
0.254 ± 0.046b |
0.231 ± 0.018a |
|
C22:0 |
1.411 ± 0.148b |
0.487 ± 0.045a |
|
∑ saturated acid SFA |
11.66 ± 1.06a |
12.86 ±0.751a |
|
C14:1 n-5 |
1.902 ± 0.153a |
3.128 ± 0.214b |
|
C15:1 n-5 |
1.176 ± 0.114b |
0.371 ± 0.026a |
|
C16:1 n-7 |
7.728 ± 0.120a |
12.420 ± 0.310b |
|
C17:1 cis n-7 |
1.50 ± 0.105b |
0.416 ± 0.025a |
|
C18:1 n-9 |
11.844 ± 0.145a |
17.924 ± 0.003b |
|
C18:1 trans n-9 |
12.233 ± 0.188a |
18.273 ±0.002b |
|
C22:1 n-9 |
3.916 ± 0.236b |
1.12 ±0.003a |
|
∑ monounsaturated acid MUFA |
40.299 ± 1.03a |
53.65 ± 0.945b |
|
C18:3 n-3 |
0.45 ± 0.040a |
0.43 ± 0.025a |
|
C22:6 n-3 DHA |
8.53 ± 0.261b |
5.03 ± 0.080a |
|
C20:5 n-3 EPA |
2.02 ± 0.087a |
2.65 ± 0.100b |
|
C18:3 n-6 |
1.074 ± 0.085a |
1.106 ± 0.048b |
|
C18:2 n-6 |
5.235 ± 0.065a |
10.424 ± 0.140b |
|
C18:2 trans n-6 |
3.773 ± 0.095a |
6.061 ± 1.78b |
|
C20:3 n-6 |
4.821 ± 0.161b |
1.643 ± 0.050a |
|
C20:2 n-6 |
5.593 ± 0.122b |
1.124 ± 0.080a |
|
C23:2 n-6 |
2.5 ± 0.212b |
0.954 ± 0.021a |
|
C20:4 n-6 |
1.618 ± 0.115b |
0.624 ± 0.011a |
|
∑ polyunsaturated acid PUFA |
35.614 ± 1.22b |
30.046 ± 0.615a |
|
∑ unsaturated acids |
75.913 ± 2.25 |
83.696 ± 1.56 |
|
Others |
12.428 ± 0.981b |
3,446 ± 0.112a |
|
Sum n-6 |
24.614 ± 0.835b |
21.754 ± 0.407a |
|
Sum n-3 |
11.000 ±0.385b |
8.11 ± 0.205a |
Table 3: Fatty acid composition (% of total fatty acids) (mean ± STD) in the muscle tissue of European catfish grown in RAS with and without probiotics.
Means in a column followed by a different letter were significantly different at P < 0.05.
The percentage of total fatty acids represented by Monounsaturated Fatty Acids (MUFA) was large in both groups. The difference between the groups was statistically significant (P < 0.05). In both groups, the most prevalent fatty acid was C18:1 n-9 (P < 0.05).
The content of Polyunsaturated Fatty Acid (PUFA) between the groups was also statistically significant (P < 0.05). In both groups, the most prevalent fatty acid was C18:2 n-6 (9.008±0.008% in the control group and 16.485±1.681% in the probiotic group, P < 0.05). The comparison of various PUFAs belonging to the n-3 and n-6 families showed that there was a significant difference (P < 0.05) between the two groups for all the PUFAs except for C18:3 n-3; the contents of the latter two fatty acids were similar in the two experimental groups (P>0.05). The content of DHA (C22:6 n-6) in the CG was higher than that in the PG. Moreover, the content of EPA was higher in the PG than that in the CG. Separate analysis of the n-3 and n-6 families of fatty acids showed that the CG filets exhibited higher levels of these fatty acids. The content of C18:3 n-6 and C18:2 n-6 fatty acids was higher in PG than that in CG, while the content of C20:3 n-6, C20:2 n-6, C23:2 n-6, and C20:2 n-6 fatty acids was higher in the CG filets (Table 3). The total content of unsaturated fatty acids was statistically significant (P<0.05). The content of unsaturated fatty acids was higher in PG.
Through analysis of the health lipid indices and nutritional quality of S. glanis, we determined that the hypercholesterolemic fatty acid ratio was 8.11±0.340 in the PG and 16.4±2.139 in the CG. This difference was statistically significant (P < 0.05) (Figure 3). The CG values were higher in all parameters, except for n-6/n-3, FLQ, and h/H, which were higher in the PG (Figure 3).
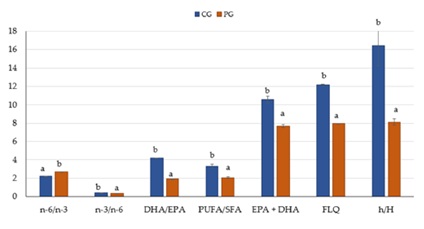 Figure 3: Health lipid indices and nutritional quality of the muscle tissue of European catfish grown in RAS with and without probiotics. Data are shown as the mean (bars) ± standard deviation (whiskers) within the treatments. Bars with the same letters are not significantly different (ANOVA test, P < 0.05).
The atherogenicity index (AI) value of the muscle tissue of catfish from the CG was lower than that of muscle tissue from the PG (0.05±0.016 and 0.07±0.008 for CG and PG, respectively) (Figure 4).
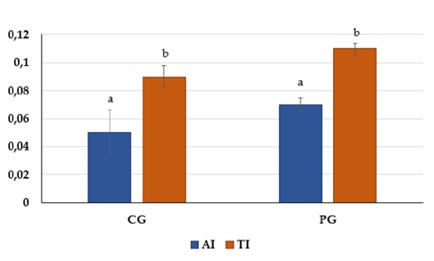 Figure 4: The Atherogenicity Index (AI) and Thrombogenicity Index (TI) for the muscle tissue of European catfish grown in RAS with and without probiotics. Data are shown as the mean (bars) ± standard deviation (whiskers) within the treatments. Bars with the same letters are not significantly different (ANOVA test, P < 0.05).
The difference was found to be statistically significant at PTI) also showed a statistically significant difference (P < 0.05). In PG, the significance was 0.11±0.004, and in CG, it was 0.09±0.005.
Discussion
- Growth performance
Probiotic supplementation in the diet was found to improve growth, strengthen the immune system, and increase resistance to stressors in aquaculture [5]. The main mechanism of action among probiotic bacteria is to improve the mucosal defenses of the gastrointestinal tract, including increased antimicrobial activity and enhanced mucosal barrier functions against ingested pathogens and immunomodulation [42]. In this study, the use of probiotics significantly affected the growth performance of European catfish. All growth performance parameters were higher in PG than in CG, confirming the effects of the probiotics used. Fish survival between treatment groups was 100%, and the growth performance and feed conversion ratio of the fish groups differed significantly. [43] performed experiments with Asian catfish (Pangasius hypophthalmus) using Bacillus licheniformis Dahb 1 probiotics and observed a significantly larger weight gain in the probiotic group after only 24 days. The better feed assimilation can be explained by an increase in beneficial bacteria in the European catfish digestive system. In [44,45], probiotics were discovered to be a good supplement able to improve digestion and feed assimilation, as well as lower the FCR. In this study, the FCR in PG was lower than that in CG. Faster growth and lower levels of feed consumption are attractive to European catfish growers. In this way, fish could achieve their sale weights more rapidly while using less feed, which would significantly decrease rearing costs.
The positive effects of different probiotic strains on fish and shellfish have been proven by many researches. Studies from the last two years related to the use of probiotics strain (also Lactococcus spp., Lactobacillus spp., Bifidobacterium spp., combination of Bacillus spp. and Saccharomyces cerevisiae spp.) in finfish aquaculture and their effect on weight gain, specific growth rate, food conversation rate, food conversion efficiency, food conversion ratio, protein efficiency ratio, survival rate, digestive enzyme, and disease resistance of finfish, are discussed in the articles [30] The authors note that probiotics have beneficial immune effect on the specified parameters in finfish and shrimp, especially in larvae and juveniles. The use of probiotics increases feed utilization, the disease resistance and growth performance of both fish and shellfish. It is also emphasized that excessive concentrations of probiotics bacteria can have the opposite effect and cause an imbalance in the intestinal microbiota. As stated in the article [46] the administration of cell-free extract of L. plantarum could effectively improve the growth performance of L. vannamei via the improvement of digestive enzyme activities and the enterocytes height of shrimp. [47] conducted a study on the antibacterial effect of probiotics L. acidophilus against Vibriosis in juvenile shrimp (Penaeus monodon) and demonstrated that the treatment with L. acidophilus 04 resulted in 20% final mortality compared to 86.7% in the control group. [48] demonstrated Lactobacillus plantarum effect on growth and resistance against Acute hepatopancreatic necrosis disease pathogens in white-leg shrimp (Litopenaeus vannamei).
The effect of probiotic strains with bacteria Lactobacillus casei M15, Lac. plantarum D8, Lac. pentosus BD6, Lac. fermentum LW2, Enterococcus faecium 10-10, and Bacillus subtilis E20, and one yeast, Saccharomyces cerevisiae P13 on Asian seabass against Aeromonas hydrophila were conducted [49]. In this article it was concluded that the probiotic mixture could adequately provide probiotic efficiency for Asian seabass, and the diet containing 109 CFU (kg diet)-1 probiotic mixture is recommended to improve the growth and health status of Asian seabass. In another study [50], effect of individual Lactobacillus rhamnosus JCM1136 and Lactococcus lactis subsp. lactis JCM5805 and combination of these probiotics on tilapia juveniles (Oreochromis niloticus) was conducted. After a 6 week study, these probiotics, especially Lactococcus lactis subsp. lactis JCM5805 and the it’s combination with other probiotics such as 108 CFU/g, a feed addition, improves growth performance, intestinal microbiota, intestinal morphology, immune response and disease resistance. [51] examined that the administration of Bacillus NP5 as probiotic show the best result on daily growth rate, feed efficiency, and protein and lipid composition of catfish. The effect of Saccharomyces cerevisiae as part of a low fishmeal diet on orange-spotted grouper (Epinephelus coioides) submitted [52]. The results of treatment indicated that the addition of 2 g/kg S. cerevisiae extract could increase the mucosal folds length of the foregut, and the muscle thickness of the entire intestine, and maintain the growth of the Epinephelus coioides.
The use of various strain of probiotics (including Lactococcus spp, Lactobacillus sp., Saccharomyces cerevisiae) for diseases control is discussed in a review article [53]. The authors of this article have classified different pathogens and separately described the effects of probiotics as a protective strategy against diseases. A similar topic is discussed in the article [54].
- Chemical composition, fatty acid profiles, and lipid indices
We expected that some major differences would be found in the chemical and fatty acid composition of fish muscle tissue in CP and PG.
According to the literature, fish are classified as lean (less than 2% fat), average (2-7% fat), fatty (7-15% fat), or very fatty (over 15% fat) [55]. In this study, under this classification scheme, the European catfish grown in RAS were lean fish. The results of the chemical muscle tissue analysis in this experiment are similar to the results reported in [56,57] examined the muscle tissue of European catfish grown on a farm in eastern Poland. The catfish were fed natural feed without additional feeding. The average weight of the analyzed fish was 2.71± 0.15 kg, and the determined fat percentage was 3.33±1.83%. Other authors analyzed the muscle tissue of European catfish that live in ponds and consume natural feed alongside fish reared in RAS and fed artificial feed [58]. Our results differ from these previous studies, likely due to differences in the ages of the fish, their feed composition, and their living environment. [59] conducted an experiment with European catfish reared in creels on a farm in Croatia [59]. The creels were populated with one-year-old catfish, and the weight of the fish varied from 148.5 to 151.5 g/fish. The fish were fed artificial feed enriched with various quantities of linoleic acid, and the results of the chemical composition analysis were similar to the results in this study. Notably, a higher content of fat and protein was found in the muscle tissue of the fish that received additional linolenic acid. In this research, higher fat and protein content was found in the group that received additional probiotics. Compared to the results reported in [59], lower fat content was observed in both groups. The results of these experiments correlate well with each other because the weight of fish was lower in the previous study, despite the fact that the fish were older [59]. The fish used in [59] were one-year old; however, in the present study, we used five-month-old catfish that had been reared in RAS since hatching.
In this experiment, probiotics did not have an effect on the total content of Saturated Fatty Acid (SFA) but analyzing the content of individual SFAs revealed significant differences. The results from analyzing the MUFA and PUFA were also found to be statistically significant. The content of saturated fatty acids is the main reason for an increased incidence of cardiovascular diseases. Three main SFAs are responsible for an increased risk of cardiovascular disease: myristic acid, lauric acid, and palmitic acid [60]. In this experiment, the content of lauric acid (C12:0) was lower in the probiotic group (difference, 62%), as was the content of myristic acid (C14:0) (difference, 42%) [61]. However, the palmitic acid (C16:0) levels were higher (a difference of 62%) in the muscle tissue of the probiotic group. Analyzing the work of other authors showed that the highest quantity of C16:0 saturated fatty acids was present in the muscle tissue of all analyzed fish [57,60-64]. Comparing the fatty acid ratios to those reported by [65] similar results were observed. However, in this experiment, the most prevalent fatty acid in the control group was C18:0, not C16:0. C16:0 was also the most prevalent fatty acid in [58,65] for fish grown under natural conditions and in RAS and in [59] for creels given additional linolenic acid [57,61].
The two main classes of PUFA, omega-3 and omega-6, cannot be substituted and have different biochemical effects on human health [56]. Linoleic acid (C18:2 n-6) and Alpha-Linolenic Acid (C18:3 n-3, ALA) are known to be important for nutrition because they cannot be synthesized in the human body.
In [58] experiment in which catfish were fed artificial feed, the contents of EPA and DHA were higher than those in the muscle tissue of fish fed natural feed (EPA 7.67±0.10% and 4.46±0.62%; DHA 13.53±0.17% and 9.94±0.92%, respectively). In [60], which studied catfish fed using feed enriched with linolenic acid, the percentages of EPA and DHA were similar to the percentages found in the present experiment (depending on the content of added linolenic acid, the EPA fluctuated from 3.51% to 4.01%, and the DHA fluctuated from 7.84% to 10.86%). Moreover, market-bought fish muscle tissue contains more DHA than EPA [66,67]. In the muscle tissue of other catfish species, including Rhamdia quelen [68], C. gariepinus [69], and Silurus triostegus [70], the content of DHA was found to be higher than that of EPA. In the muscle tissue of other freshwater fish, more EPA than DHA was reported [71], but [72] determined that some freshwater fish caught in a natural environment contained more DHA than EPA, as also shown in [14,73].
The ratio of omega-3 to omega-6 fatty acids, as well as the PUFA/SFA ratio, in the human diet is important. Pigott and Tucker determined that the n-3/n-6 ratio could be the best indicator for measuring the nutritional value of fish oil [74]. Maintaining an optimal n-3/n-6 ratio in the human diet confers protection against cardiovascular disease and lowers the risk of cancer by decreasing plasma lipid levels [75]. According to the literature, the n-3/n-6 ratio in saltwater fish fluctuates from 4.7 to 14.4, while in freshwater fish, this ratio ranges from 0.5 to 3.8 [65]. In the present experiment, the measured n-3/n-6 ratio was 0.446±0.0004 in CG and 0.369 ±0.002 in PG, and the difference was found to be statistically significant (P < 0.05). As stated in [15], to decrease the risk of cardiovascular diseases and cancer, the n-3/n-6 ratio in the human diet should be < 0.25. In both analyzed groups, the n-3/n-6 ratios were observed to be higher than the values recommended in the literature, but in the group in which probiotics were used, the n-3/n-6 ratio was closer to the recommended value. A broad analysis of the muscle tissue of adult European catfish and other catfish species showed that this ratio was higher than that recommended in the literature [68, 69,70,71] reported n-3/n-6 ratios of 0.27 in Cyprinus carpio, 0.23 in Labeo rohita, and 0.23 in Oreochromis mossambicus.
Nutritionists stress the importance of the n-6/n-3 PUFA ratio in protecting against atherosclerosis. High values of this ratio can have a negative influence on health and can cause cardiovascular diseases. Simopoulos A. recommended an n-6/n-3 ratio of 2 or 1, while the highest recommended value of this ratio is 4 [18]. In the present experiment, the measured n-6/n-3 ratios were 2.237±0.002 and 2.704±0.018 in CG and PG, respectively. These values did not exceed the highest recommended value and thus remain within the boundaries of the recommended ratios. [64] determined this value to be 1.72. Although the results of this experiment differ from the results in [56,61], which reported ratios of 0.65 and 0.69, respectively, the age of the fish and their growing environment also differed.
In this experiment, the PUFA/SFA ratio was higher in CG than that in PG (3.306±0.213 and 2.057±0.099, respectively). These values differ from those reported in [64] (a PUFA/SFA ratio of 1.61) and [56] (a PUFA/SFA ratio of 0.96±0.3). In [59], the PUFA/SFA ratio fluctuated from 2.07 to 2.63. As stated in [15], to avoid cardiovascular diseases and cancer, the PUFA/SFA ratio in the human diet should be higher than 0.4-0.5. The PUFA/SFA ratios measured in this experiment correspond to the above requirement.
[66] presented the results of an experiment that demonstrated the seasonal variation in the composition and percentage distribution of fatty acids in Mesopotamian catfish (Silurus triostegus). The authors determined that there is seasonal fluctuation in the levels of SFA, PUFA, and MUFA and in the content of n-3 and n-3 omega fatty acids. By rearing fish in RAS, this inconsistency can be avoided, and the product can achieve a consistent quantity of fatty acids, including omega n-3 and n-6 acids.
[38] Suggested that the thrombogenicity index and atherogenicity index can be used to evaluate the biological effects of fatty acids. The TI evaluates the content of saturated fatty acids as a ratio of monounsaturated and polyunsaturated n-3 and n-6 fatty acids (antithrombotic). A certain content of these fatty acids in food can cause clot formation in blood vessels [39,75]. There are specific recommendations concerning the most beneficial AI and TI values. In the human diet, these indices should be lower than 1 [76]. The AI and TI values measured in this experiment were lower than 1. [62] determined the AI and TI values in European catfish to be 0.36±0.05 and 0.41±0.04, respectively, and the authors in [65] reported AI and TI values of 0.43-0.46 and 0.32-0.36, respectively, in Prussian carp during different seasons.
Another index of nutritional quality is the H/h ratio. The ratio of hypocholesterolemic fatty acids to hypercholesterolemic fatty acids was found to be 8.11±0.340 in PG and 16.4 ± 2.139 in CG. According to [40,77], higher levels of H/h are more acceptable. The H/h ratios observed in this experiment were higher than those reported in other experiments due to the much lower content of SFA in the analyzed muscle tissue of European catfish. The H/h ratios were higher than those measured in [78], which examined the fat composition of Carasius gibelio in different seasons and determined the H/h ratio to range from 2.59±0.01 to 2.30±0.01. [79] stated that an ideal ratio is approximately 2. The H/h ratio in fatty tissue is strongly influenced by oleic acid (C18:1). In this experiment, the content of oleic acid was found to be high in both groups.
Because the value of this index depends on the content of DHA and EPA in the fish fat, these results were higher in the control group, which contained higher content of n-3 fatty acids than that observed in the probiotic group (10.55±0.345 and 7.68±0.180, respectively). A number of authors reported an FLQ similar to that found in the probiotic group in this experiment, but the FLQ of the control group in our experiment was twice as high [62] In [78], the FLQ of Carasius gibelio in different seasons fluctuated between 11.69±0.13 and 14.17±0.05. As stated in [69, 80-82], the fatty acid composition can change depending on the species, age, type of feeding, and feed composition [83,84].
Conclusion
Commercial Smart Fishery probiotics can be successfully used to increase the growth performance of European catfish. In this study, growth performance increased due to an increase in the speed of digestion and was found to be influenced by probiotic activity. These probiotic characteristics help aquatic animals improve their feed assimilation efficiency and increase their growth, in addition to conferring immunity. In this way, a shorter time period will be required to rear the European catfish to its sale weight. Based on a comparison of the essential n-6 and n-3 fatty acid content and the ratios and lipid indices of these fatty acids, better results were obtained in fish rearing without probiotics. However, the use of probiotics in growing water did not significantly impair the fatty acid composition of European catfish meat and could be used as an additive in a healthy human diet.
Institutional Review Board Statement
All experimental procedures were conducted in conformity with institutional guidelines for the care and use of laboratory animals in Vytautas Magnus University and conformed to the Republic of Lithuania law of on Welfare and Protection of animals (2012 m. October 3 d. No. XI-2271.Vilnius) and the European Council Directive 86/609/EEC of 24 November 1986 on the approximation of laws, regulations and administrative provisions of the Member States regarding the protection of animals used for experimental and other scientific purposes.
Informed Consent Statement
Not applicable.
Data Availability Statement
The data that support the findings of this study are available on request from the corresponding author, G. Z.
Acknowledgments
The authors thank the Fishery Service for the opportunity to conduct research with European catfish, Baltic Probiotics Ltd. for providing probiotics, and Vytautas Magnus University‘s Aquaculture Centre for providing the required equipment.
Conflicts of Interest
The authors declare no conflict of interest.
References
- Copp GH, Robert Britton J, Cucherousset J, García-Berthou E, Kirk R, et al.(2009) Voracious invader or benign feline? A review of the environmental biology of European Catfish Silurus glanis in its native and introduced ranges. Fish and Fisheries 10: 252-282.
- Eurofish International Organisation. Market Prospects for Aquaculture Species (2017)
- Mazurkiewicz J, Przyby? A, Golski J (2008) Evaluation of selected feeds differing in dietary lipids levels in feeding juveniles of wels catfish, Silurus glanis Acta ichthyologica et piscatorial 38: 91-96.
- Jahangiri L, Esteban AM (2018) Administration of Probiotics in the Water in Finfish Aquaculture Systems. Fishes 3: 1-13.
- Hai NV (2015) The use of probiotics in aquaculture. Journal of Applied Microbiology 119: 917-935.
- Zorriehzahra MJ, Delshad ST, Adel M, Tiwari R, Karthik K, et al. (2016) Probiotics as beneficial microbes in aquaculture: An update on their multiple modes of action: A review. Veterinary Quarterly 36: 228-241.
- Irianto A, Austin B (2002) Use of probiotics to control furunculosis in rainbow trout, Oncorhynchus mykiss (Walbaum). Journal of Fish Diseases 25: 1-10.
- Huang X, Zhou H, Zhang H (2006) The effect of Sargassum fusiforme polysaccharide extracts on vibriosis resistance and immune activity of the shrimp, Fenneropenaeus chinensis. Fish Shellfish Immunology 20: 750-757.
- Hai NV (2015) Research findings from the use of probiotics in tilapia aquaculture: A review. Fish & Shellfish Immunology 45: 592-597.
- Newaj-Fyzul A, Al-Harbi AH, Austin B (2014) Review: Developments in the use of probiotics for disease control in aquaculture. Aquaculture 43: 1-11.
- Zorriehzahra MJ, Delshad ST, Adel M, Tiwari R, Karthik K, et al. (2016) Probiotics as beneficial microbes in aquaculture: An update on their multiple modes of action: A review. Journal Veterinary Quarterly 36: 228-241.
- Huynh TG, Shiu YL, Nguyen TP, Truong QP, et al. (2017) Current applications, selection, and possible mechanisms of actions of synbiotics in improving the growth and health status in aquaculture: A review. Fish Shellfish Immunology 64: 367-382.
- Banerjee G, Ray AK (2017) The advancement of probiotics research and its application in fish farming industries. Research in Veterinaty Science 115: 66-77.
- Olgunoglu IA (2017) Review on omega-3 (n-3) fatty acids in fish and seafood. Journal of Biology. Agriculture and Healtheare 7: 37-45.
- Simopoulos AP (2002) The importance of the ratio of omega-6/omega-3 essential fatty acids. Biomed Pharmacother 56: 365.
- DeFilippis AP, Sperling SL (2006) Understanding omega-3‘s. Atlanta. Am Heart J 151: 564-570.
- Abedi E, Sahari MA (2017) Long-chain polyunsaturated fatty acids sources and evaluation of their nutritional and functional properties. Food Science and Nutrition 2: 443-463.
- Simopoulos A (2016) An increase in the omega-6 and omega-3 fatty acids ratio increases the risk of obesity. Nutrients 8: 128.
- O?uz T, Gökçe MA (2017) Fatty Acid. Chapter 8: Fatty Acids in Fish. Published by INTECH 143-159.
- Lewellyn MS, Boutin S, Hoseinifar SH, Derome N (2014) Teleost microbiomes: The state of the art in their characterization, manipulation and importance in aquaculture and fisheries. Front Microbiol 5:207.
- Popovic TN, Strunjak-Perovic I, Sauerborn-Klobucar R, Barisic J, Jadan M, et al. (2017) The effects of diet supplemented with Lactobacillus rhamnosuson tissue parameters of rainbow trout, Oncorhynchus mykiss (Walbaum). Aquac Res 48: 2388-2401.
- Butt RL, Volkoff H (2019) Gut Microbiota and Energy Homeostasis in Fish. Front Endocrinol 10: 9.
- Ahmadifar E, Sadegh HT, Dawood AOM, Dadar M (2019) The effects of dietary Pediococcus pentosaceus on growth performance, hemato-immunological parameters and digestive enzyme activities of common carp (Cyprinus carpio). Aquaculture 516: 734656.
- Plante S, Pernet F, Hache R, Ritchie R, Ji B, et al. (2007) Ontogenetic variations in lipid class and fatty acid composition of haddock larvae Melanogrammus aeglefinusin relation to changes in diet and microbial environment. Journal of Aquaculture 263: 107-121.
- Biswas M, Islam MS, Das P, Das PR, Akter M (2018) Comparative study on proximate composition and amino acids of probiotics treated and nontreated cage reared monosex tilapia Oreochromis niloticusin Dekar haor, Sunamganj district, Bangladesh. Int J Fish Aquat Stud 6: 431-435.
- Milián-Sorribes MC, Martínez-Llorens S, Cruz-Castellón C, Jover-Cerdá M, Tomás-Vidal A (2020) Effect of fish oil replacement and probiotic addition on growth, body composition and histological parameters of yellowtail (Seriola dumerili). Aquaculture Nutrition 27: 3-16.
- Van Doan H, Hoseinifar SH, Ringø E, Esteban MA, Dadar M, et al. (2020) Host-associated probiotics, a key factor in sustainable aquaculture. Reviews in Fisheries Science & Aquaculture 28: 16-42.
- Caipang CMA, Suharman I, Avillanosa AL, Bargoyo VT (2020) Host-derived Probiotics for Finfish Aquaculture. The 8th International and National Seminar on Fisheries and Marine Science 430: 012026.
- Langlois L, Akhtar N, Tam KC, Dixon B, Reid G (2021) Fishing for the right probiotic: Host–microbe interactions at the interface of effective aquaculture strategies. FEMS Microbiology Reviews fuab 3: 1-19.
- Ringø E (2020) Probiotics in shellfish aquaculture. Aquaculture and Fisheries 5: 1-27.
- Ringø E, Van Doan H, Lee SH, Soltani M, Hoseinifar SH, et al. (2020) Probiotics, lactic acid bacteria and bacilli: Interesting supplementation for aquaculture. Journal of Applied Microbiology 129: 116-136.
- Cámara-Ruiz M, Balebona MC, Moriñigo MÁ, Esteban MÁ (2020) Probiotic Shewanella putrefaciens (SpPdp11) as a Fish Health Modulator: A Review. Microorganisms 8: 1990.
- Salam MA, Islam MdA, Paul SI, Rahman MdM, Rahman ML, et al. (2021) Gut probiotic bacteria of Barbonymus gonionotus improve growth, hematological parameters and reproductive performances of the host. Scientific Reports 11: 10692.
- Kaktcham PM, Temgoua JB, Zambou FN, Diaz-Ruiz G, Wacher C, et al. (2018) In Vitro Evaluation of the Probiotic and Safety Properties of Bacteriocinogenic and Non-Bacteriocinogenic Lactic Acid Bacteria from the Intestines of Nile Tilapia and Common Carp for Their Use as Probiotics in Aquaculture. Probiotics & Antimicro Prot 10: 98-
- Feng J, Chang X, Zhang Y, Zhang XY, Nie G (2019) Effects of Lactococcus lactis from Cyprinus carpio as probiotics on growth performance, innate immune response and disease resistance against Aeromonas hydrophila. Fish Shellfish Immunol 93: 73-81.
- Hamm R (1972) Kolloidchemie des Fleisches (ed. P. Parey). rlag Berlin
- https://www.scirp.org/(S(351jmbntvnsjt1aadkposzje))/reference/ReferencesPapers.aspx?ReferenceID=1687699
- Ulbricht T, Southgate D (1991) Coronary heart disease: Seven dietary factors. The Lancet 338: 985-992.
- Senso L, Suárez MD, Ruiz-Cara T, García-Gallego M (2007) On the possible effects of harvesting season and chilled storage on the fatty acid profile of the fillet of farmed gilthead sea bream (Sparus aurata). Food Chem 101: 298-307.
- Santos-Silva J, Bessa RJB, Santos-Silva F (2002) Effect of genotype, feeding system and slaughter weight on the quality of light lambs: II. Fatty acid composition of meat. Livestock Production Science 77: 187-194.
- Reda RM, Selim KM (2015) Evaluation of Bacillus amyloliquefaciens on the growth performance, intestinal morphology, hematology and body composition of Nile tilapia, Oreochromis niloticus. Aquac Int 23: 203-217.
- Zhang HP, Dong WL, Chen L, Wang YM, Muhammad IJA, et al. (2020) Effects of dietary Lactobacillus plantarum C20015 on growth, immunity, and disease resistance in koi carp. Aquac Int 28: 1797-1809.
- Zheng X, Duan Y, Dong H, Zhang J (2018) Effects of Dietary Lactobacillus plantarumon Growth Performance, Digestive Enzymes and Gut Morphology of Litopenaeus vannamei. Probiotics Antimicrob Proteins 10: 504-510.
- Sivakumar N, Sundararaman M, Selvakumar G (2020) Probiotic effect of Lactobacillus acidophilus against vibriosis in juvenile shrimp (Penaeus monodon). African J of Biotech 11: 5811-15818.
- Nguyen TTG, Nguyen TC, Leelakriangsak M, Pham TT, Pham QH, et al. (2018) Promotion of Lactobacillus plantarum on growth and resistance against acute hepatopancreatic necrosis disease pathogens in white-leg shrimp (Litopenaeus vannamei). The Thai Journal of Veterinary Medicine 48: 19-28.
- Lin HL, Shiu YL, Chiu CS, Huang SL, Liu CH (2017) Screening probiotic candidates for a mixture of probiotics to enhance the growth performance, immunity, and disease resistance of Asian seabass, Lates calcarifer (Bloch), against Aeromonas hydrophila. Fish Shellfish Immunol 60: 474-482.
- Xia Y, Lu M, Chen G, Cao J, Gao F (2018) Effects of dietary Lactobacillus rhamnosus JCM1136 and Lactococcus lactis subsp. lactis JCM5805 on the growth, intestinal microbiota, morphology, immune response and disease resistance of juvenile Nile tilapia, Oreochromis niloticus). Fish Shellfish Immunol 76: 368-379.
- Putra AN, Tirtayasa A, Jakarta JR (2019) The Application of Probiotic to Increase Growth, Body Composition, and Feed Efficiency on Catfish (Clarias ) Advances in Biological Sciences Research, Volume 9, Joint proceedings of the 2nd and the 3rd International Conference on Food Security Innovation (ICFSI 2018-2019).
- Hoseinifar SH, Sun YZ, Wang A, Zhou Z (2018) Probiotics as Means of Diseases Control in Aquaculture, a Review of Current Knowledge and Future Perspectives. Front Microbiol 9: 2429.
- Simo´NR, Docando F, Nuñez-Ortiz N, Tafalla C, D´?az-Rosales P (2021) Mechanisms Used by Probiotics to Confer Pathogen Resistance to Teleost Fish. Front Immunol 12: 653025.
- Yang X, He Y, Lin S, Dong X, Yang Q (2021) Saccharomyces cerevisiae extracts improved the effects of a low fishmeal, complex plant protein diet in the orange-spotted grouper, Epinephelus coioides. Aquaculture reports 19 (100574).
- Rahman SA, Huah TS, Hassan O, Daud NM (1995) Fatty acid composition of some Malaysian freshwater fish. Food Chemistry 54: 45-49.
- Pyz-Lukasik R, Paszkiewicz W (2018) Species variations in the proximate composition, amino acid profile, and protein quality of the muscle tissue of Grass carp, Bighead carp, Siberian sturgeon, and Wels catfish. J of Food Quality 18: 1-8.
- Ljubojevi? D, Cirkovi? M, Dordevi? V, Puva?a N, Trbovi? D (2013) Fat quality of marketable fresh water fish species in the Republic of Serbia,” Czech Journal of Food Sciences 31: 445-450.
- Jankowska B, Zak?? Z, ?mijewski T (2004) Impact of diet on the fatty acids profile of European Catfish (Silurus glanis L.). Archive of Polish Fishery 12: 99-110.
- Bogut I, Has-Schön E, ?a?i? M, Milakovi? Z, Novoseli? D, et al. (2002) Linolenic acid supplementation in the diet of European catfish (Silurus glanis): Effect on groth and fatty acid composition. J of Applied Ichthyology 18: 1-6.
- Mahan LK, Escott-Stump S (2008) Escott-Stump, S. Krause's food, nutrition, & diet therapy. 12rd ed. St. Louis, Mo.: Saunders/Elsevier.
- Baesi F, Aberoumand A, Nejas Z, Javaheri Baboli M (2017) Effect of commercial probiotic Lactobacillus on fatty acids profile and nutritional value of Cyprinus carpio in Iran. Carpatian J of Food Science and Tech.
- Özogul Y, Özogul F, Alagoz S (2007) Fatty acid profiles and fat contents of commercially important seawater and freshwater fish species of Turkey: A comparative study. Food Chemistry 103: 217-223.
- Stancheva M, Merdzhanova A, Dobreva D, Makedonski L (2014) Common carp (Cyprinus Caprio) and European catfish (Silurus glanis) from the Danube River as Sources of fat soluble vitamins and fatty acids. Czech J of Food Sci 32: 16-24.
- Saliu F, Leoni B, Pergola RD (2017) Lipid classes and fatty acids composition of the roe of wild Silurus glanis from subalpine freshwater. Food Chemistry 232: 163-168.
- Pyz-Lukasik R, Kowalczyk-Pecka D (2017) Fatty acid profile of fat Grass carp, Bighead carp, Siberian Sturgeon, and Wels catfish. Journal of Food Quality 1: 1-6.
- Steffens W (1997) Effects of variation in essential fatty acids on nutritive value of freshwater fish for humans. Aquaculture Amsterdam 151: 97-119.
- Cengiz ?pek E, Ünlü E, Bashan M, Satar A, Uysal E (2012) Effects of Seasonal Variations on the Fatty Acid Composition of Total Lipid Phospholipid and Triacylglicerol in the Dorsal Muscle of Mesopotamian Catfish Silurus triostegusHeckel 1843 in Tigris River Turkey. Turkish Journal of Fisheries and Aquatic Science 12: 33-39.
- Vargas R, Bessonart M (2005) Lipid body composition of Black catfish, Rhamdia quelen Siluriformes Heptapteridae of two populations adapted to different environmental conditions. B Inst Pesca São Paulo 33: 105-111.
- ?uczy?ska J, Paszczyk B, ?uczy?ski JM (2014) Fatty acid profiles in marine and freshwater fish from fish markets in NorthEastern Poland. Archives of Polish Fisheries 22: 181-188.
- Ka?ar S, Ba?han M, Oymak SA (2016) Effect of seasonal variation on lipid and fatty acid profile in muscle tissue of male and female Siluryus triostegus. Journal of Food Science and Technology 53: 2913-2922.
- ?uczy?ska J, To?ska E, Krejszeff S, ?arski D (2016) Comparison of fatty acids in the Muscles and Liver of pond-cultured and wild Perch Perca fluviatilis L in Poland. Turkish Journal of Aquatic Science 16: 19-27.
- Jabeen F, Chaudhry AS (2011) Chemical composition and fatty acid profiles of three freshwater fish species. Food chemistry 125: 991-996.
- Zhang Z, Liu L, Xie C, Li D, Xu J (2014) Lipid contents, fatty acid profiles and nutritional quality of nine wild caught freshwater fish species of the Yangtze basin, China. Journal of Food and Nutrition Research 2: 388-394.
- Piggott GM, Tucker BW (1990) Seafood Effects of Technology on Nutrition. Marcel Dekker Inc New York 221-228.
- Kinsella JE (1988) Fish and seafood Nutritional implication and quality issues. Food Technology Magazine 15: 146-150.
- Garaffo MA, Vassallo-Agius R, Nengas Y, Lembo E, Rando R, et al. (2011) Fatty Acids Profile, Atherogenic IA and Thrombogenic IT Health Lipid Indices, of Raw Roe of Blue Fin Tuna Thunnus thynnus L and Their Salted Product Bottarga. Food and Nutrition Sciences 2: 736-743.
- Turan H, Sonmez G, Kaya Y (2007) Fatty acid profile and proximate composition of the thornback ray Raja clavata L 1758 from the Sinop coast in the Black Sea. Journal of Fisheries Sciences 2: 97-103.
- Testi S, Bonaldo A, Gatta PP, Badiani A (2006) Nutritional traits of dorsal and ventral fillets from three farmed fish species. Food Chemistry 98: 104-111.
- Dagtekin BBG, Misir GB, Kutlu S, Bastruk O (2018) Comparison of biochemical fatty acids and lipid quality indexes of Prussian carp Carasius gibelio caught from lake Cildir on different seasons. Mediterranean Fisheries and Aquaculkture Research 1: 2-14.
- Bentes J, Miguel MG, Monteiro I, Costa M, Figueired AC, et al. (2009) Antioxidant activities of the essential oils and extracts of Portuguese Thymbra capitata and Thymus mastichina. Italian Journal of Food Science 21: 183-195.
- Bayir A, Sirkecioglu AN, Aras NM, Aksakal E, Haliloglu HI, et al. (2010) Fatty acid of neutral and phospholipids of three endangered trout Salmo trutta caspius Kessler Salmo trutta labrax Pallas and Salmo trutta macrostigma Dumeril. Food Chemistry 119: 1050-1056.
- Kayhan H, Ba?han M, Ka?ar S (2015) Seasonal variations in the fatty acid composition of phospholipid and triacylglycerol of brown trout. European Journal Lipid Science and Technology 117: 738-744.
- Ka?ar S, Ba?han M (2015) Seasonal variations on the fatty acid composition of phospholipid and triacylglycerol in gonad and liver of mastacembelus simack. Journal of the American Oil Chemists Society 92: 1313-1320.
- Cavalcantea RB, Tellib GS, Tachibanac L, de Carla Diasc D, Oshirob E, et al. (2020) Probiotics, Prebiotics and Synbiotics for Nile tilapia: Growth performance and protection against Aeromonas hydrophila Aquaculture Reports 17: 100343.
- Florou-Paneri P, Christaki E, Bonos E (2013) Lactic acid bacteria as source of functional ingredients. Lactic Acid Bacteria-R & D for Food, Health and Livestock Purposes. Intech Open.
- Gobi N, Malaikozhundan B, Sekar V, Shanthi S, Vaseeharan B, et al. (2016) GFP tagged Vibrio parahaemolyticus Dahv2 infection and the protective effects of probiotic Bacillus licheniformis Dahb1 on the growth, immune and antioxidant responses in Pangasius hypophthalmus. Fish Shellfish Immun 52: 230-238.
- Johnston G (2008) Arctic Charr Aquaculture. John Wiley and Sons Ltd. USA 288.
Citation: Zibiene G, (2023) Do Commercial Probiotics Influence The Fatty Acid Composition And Lipid Indices Of European Catfish (Silurus Glanis L.) Grown In a Recirculating Aquaculture System?. J Aquac Fisheries 7: 55.
Copyright: © 2023 Grazina Zibiene, et al. This is an open-access article distributed under the terms of the Creative Commons Attribution License, which permits unrestricted use, distribution, and reproduction in any medium, provided the original author and source are credited.