Effect of Konjac Glucomannan (KGM) Addition on the Sensory Characteristics, the Cooking Properties and the Glycemic Index of Special Fresh Pasta
*Corresponding Author(s):
Diana De SantisDibaf, Department For Innovation In Biological, Agro-Food And Forest Systems, University Of Tuscia, Via San Camillo De Lellis Snc, Viterbo, Italy
Tel:+39 3892356517,
Email:desdiana@unitus.it
Abstract
The challenge of this study was the partial replacement of durum wheat flour or durum wheat semolina with Konjac glucomannan (KGM) in the egg or egg white pasta, to reduce the glycemic index and characterize the sensory aspects and the cooking properties of the new products.
KGM is a highly viscous dietary fiber soluble in water with a high capacity to retain water. Therefore, if ingested, it delays the absorption of nutrients, increasing the viscosity of the gastrointestinal content, with a decrease in the glycemic index.
Samples of fresh pasta from whole egg or egg white, products with wheat flour or durum wheat semolina supplemented with 5% KGM, were evaluated for their cooking properties, sensory characteristics, glycemic index, and consumer preference.
The results show that the sample produced with durum wheat semolina, KGM, and eggs is more pleasant for the consumer, depending on an optimal value of firmness and low adhesivity.
All samples integrated with KGM reduce (≥34%) the glycemic index, even if those produced with durum wheat semolina seem to be more effective.
Keywords
Cooking properties; Fresh pasta; Glycemic index; Konjac glucomannan; Sensory analysis
INTRODUCTION
Italy produces 3,408 tons of pasta and is the country with the highest per capita consumption (25.3kg per capita), also every year around the world approximately 14.3 million tons of pasta are produced [1]. Pasta is a cereal derived staple food and, according to moisture content, 12.5% at most or 24% at least, it is classified as ‘dry’ and ‘fresh’, respectively (DPR n°187/2001).
Pasta has a primary role in human nutrition, thanks to its complex carbohydrate profile and unique nutritional features, in that the starch is slowly digested and absorbed in the small intestine with health benefits for consumers [2]. Numerous studies have analyzed the possibility of adding functional ingredients into pasta to improve its nutritional properties [3,4]. The World Health Organization (WHO) and Food and Drug Administration (FDA) consider pasta a good vehicle for the addition of different nutrients to diet, since proteins, dietary fiber, vitamins and minerals can be added [5]. Dietary Fibers (DF) with their physiological functions play an important role in decreasing the glycemic index [6-8].
Food products with a high Glycemic Index (GI) rapidly increase blood glucose levels, resulting in an enhancement in insulin demand compared to low GI foods. This index is measured following a standardized method and endorsed in 1997 by the FAO of the UN and the WHO [9]. A classification system differentiated the GI as low (<55), medium (55-69) or high (≥70) [10,11]. Glycemic index which classifies the foods according to their blood glucose raising potential is an important tool in meal planning for diabetic patients. In the treatment of diabetes of considerable interest is the Konjac Glucomannan (KGM) which reduces the glycemic index when administered before or during meals, pre-solubilized in the liquid or pre-mixed with food, at doses of 4-5g, approximately a teaspoon [12]. KGM is a water-soluble polysaccharide extracted from the root tuber of Amorphophallus konjac plant of the Araceae family [13]. KGM is a linear poly-saccharide composed of blocks of β-D-(1→4)-linked mannose and glucose residues in a ratio of 1.6:1, with O-acetate every 9-19 sugar units [14,15] and it is one of the most viscous dietary fibers known because of its extraordinarily high water-holding capacity [16,17]. In oriental cuisine, the flour obtained from the corm of this species is used to prepare noodles, tofu and snacks. In traditional Chinese medicine, it is often used for detoxification and tumor suppression [18].
KGM gelation performance is one of its most important features and allows extensive applications of KGM gel in foods, chemicals and pharmaceuticals [19]. KGM is considered an excellent food ingredient because it is a polysaccharide which, in contact with water, swells without breaking down into simple sugars, thus increasing its volume to form a stable gelatinous mass. In some studies, the effect of the addition of KGM on cooking and sensory properties of noodles, produced with low-protein wheat flour was analyzed [20-22].
Several recent studies have focused on pasta enriched with vegetables, chickpea flour, defatted soy flour, inulin and dietary fibers [3,8,23-25]. In a recent work [26], was also noted that the dough frozen with 2.5% konjac glucomannan manifested the highest capacity to bind water by stabilizing the structures of gluten proteins.
However, to date, there is no literature dealing with the physical and sensory characteristics of fresh pasta enriched with glucomannan. Therefore, this study aims to focus on the sensorial properties and the glycemic index of fresh pasta enriched with konjac glucomannan, which we believe is a product suitable for consumers with nutritional specific needs. To achieve the goal the sensory properties of the final product must be acceptable to consumers.
MATERIALS AND METHODS
Ingredients and pasta preparation
Type 00 soft wheat flour, organic durum wheat semolina (Barilla G. & R. Fratelli, Parma, Italy), liquid Pasteurized Shelled Whole Eggs (PWE) and Pasteurized Egg White (PGE) (Le Naturelle, Euronovo, Ravenna, Italy) were purchased at a local market; Konjac glucomannan pure flour (Pure konjac packaged in Modified Atmosphere Packaging without preservatives and dyes) was supplied by Ecoclass, Trieste (Italy). Pasta formulations are reported in table 1.
|
Ingredients |
Formulations |
|||||||
|
F2 |
F3 |
S2 |
S3 |
AS2 |
AS3 |
AF2 |
AF3 |
|
|
Type 00 soft wheat flour (g) |
200 |
200 |
- |
- |
- |
- |
200 |
200 |
|
Durum wheat semolina (g) |
- |
- |
200 |
200 |
200 |
200 |
- |
- |
|
Whole egg (PWE) (g) |
100 |
100 |
100 |
100 |
- |
- |
- |
- |
|
Egg white (PGE) (g) |
- |
- |
- |
- |
100 |
100 |
100 |
100 |
|
Konjac glucomannan flour (g) |
- |
10 |
- |
10 |
- |
10 |
- |
10 |
Table 1: Formulations of pasta samples.
The different types of dough were prepared in the laboratory using a kneader. The ingredients were weighed and placed in the kneader for 2 minutes at a speed of about 300rpm. The dough was put in a resealable plastic bag, and let it rest at room temperature for at least 30 minutes. Then the blob of pasta was passed through a pasta machine until the dough sheet reached the standard thickness of about 1.5mm. On a lightly floured surface, the final dough sheet was cut to produce “Fettuccine”, fresh pasta samples, about 1cm wide and 10 cm long.
Moisture and ash
Pasta samples were prepared to determine the moisture and ash content, according to AOAC 2000 methods.
Cooking properties
Optimal Cooking Time (OCT) is the time required to complete starch gelatinization and for each pasta formulation was identified according to the AACC method 66-50 [27].
25 ± 0.1g of Fettuccine samples, were put into a 500mL beaker containing 300mL of boiling distilled water. After 4 minutes of cooking at regular intervals of 30 seconds a part of each sample was divided into two parts and the disappearance of the core (whitish portion) is evaluated. The optimal cooking point coincided with the disappearance of the central white portion of non-gelatinized starch.
Cooking Loss. Cooking water collected from each sample was evaporated until constant weight in an air oven at 105C. The residue was weighted and reported as percentage of original spaghetti sample according to approved methods 16-50 cooking loss [28].
Cooked pasta samples were analyzed to determine the swelling index (SI, g water/g dry pasta) [23] and water absorption index (WAI: Weight of cooked pasta-weight of raw pasta/weight of raw g/100g) according to the method used by Foschia et al. [8], 13g of fettuccine were cut into 5cm long pieces and cooked until their optimal cooking time in 200mL of boiling distilled water. Subsequently, they were drained and rinsed with another 50ml of distilled water at room temperature for 1 minute, dried and weighed.
Glycemic index analysis
The Glycemic Index (GI) of the samples was determined according to the methodology described by Goni et al. [10].
Digestion of starch and evaluation of the Glycemic Index (GI) were determined in vitro according to the method described by Goni et al. [10]. In short, the digestion procedure involved a sample of cooked fresh pasta (100mg) in 10ml of 0.01M HCl-KCl buffer pH 1.5 with 200μL of pepsin (Sigma P7000) under constant stirring for 1 hour at 40°C in a shaking water bath. At the end of the incubation time, the volume was adjusted to 20ml with tris-maleate buffer (pH 6.9), then 5ml of a tris-maleate solution (pH 6.9) containing 48 IU of α-amylase per gram of sample (Sigma A6255). The samples were incubated at 37°C in a shaking water bath. Aliquots of 1ml each were taken at 0 (before adding the enzyme), 20, 40, 60, 90, 120 and 180min and incubated at 100°C for 5 minutes to inactivate the enzyme. Each sample was cooled at the end of the incubation period. After centrifugation (10,000g at 4°C) 500μL of each supernatant was brought to a volume of 2 ml with sodium acetate buffer (pH 4.75). Then, 60μL of amyloglucosidase, (Sigma A7095) was added and incubated at 60°C for 45 minutes with constant stirring. Subsequently, the released glucose was determined using a commercial kit (D-Glucose Assay Procedure, K-GLUC 10/15, Megazyme). The quantity of digested starch was expressed as a percentage of the total hydrolyzed starch at 0, 20, 40, 60, 90, 120 and 180min. The Hydrolysis Index (HI) for each sample was calculated as the ratio between the AHC of each sample and the AHC of white bread, used as a reference. Finally, the GI was calculated according to equation: GI=39.71+0.549 HI where GI=Glycemic Index (%); and HI=Hydrolysis Index (%) [29].
Sensory evaluation
Sensory analysis was conducted by a sensory trained panel consisted of twelve judges (eight women and four men) aged between 25 and 55, specialized in descriptive analysis.
Before the tests, three preliminary sessions of 1 hour each were conducted to train the judges to the correct identification of the descriptive attributes of the pasta samples and the evaluation according to the intensity scale, using the reference standards [30] (Table2).
|
Descriptors |
Definition/Description |
Scala Anchors (0-9) |
|
Appearance |
||
|
Color (CO) |
Intensity of the characteristic color of fresh pasta |
0=Pantone Winter White11-0507TPX 9=Pantone Lemon Drop 12-0736TPX |
|
Firmness (FI) |
The force required to bite completely through sample using the front teeth. |
0=over-boiled pasta (boiled for 15 min) 9=under-boiled pasta (boiled for 4 min) |
|
Elasticity (EL) |
Resistance and resilience to deformation with the molars |
0=over-boiled pasta (boiled for 15 min) 9=boiled pasta (spaghetti ?1.6mm) for 3 min cooled in tap water, after being soaked in water for over 4 hr |
|
Roughness (RG) |
Texture property that describes the impression of rough pasta surface, perceived by manipulating a strand of pasta in the mouth before chewing. |
0=smooth 9=rough and coarse |
|
Cohesiveness (CH) |
Force necessary to bite down. |
2=ordinary pasta boiled for recommended time 9=fresh pasta made of durum semolinaboiled for 3.5 min |
|
Adhesiveness (AD) |
Adhering to the molars during mastication |
0=ordinary pasta boiled for recommended time (e.g. spaghetti ? 1.6mm recommended cooking time 7 min) 9=spaghetti ?1.6mm recommended cooking time 7 min, boiled for 15 min |
|
Speckles (SP) |
Amount of dark or different colored dots |
0=null 9=strong |
|
Rigidity (RI) |
Difficulty to roll up with a fork |
0=null 9=strong |
|
Smell |
||
|
Egg odor (EG) |
Olfactive impression associated with egg |
0= null 9=strong |
|
Egg white odor (EW) |
Olfactive impression associated with white egg |
0= null 9=strong |
|
Cooked odor (TH) |
Olfactive impression associated with temperature treatment perceived via orthonasal |
0= null 9=strong |
Table 2: Fresh cooked pasta sensorial attributes definition for the training of the assessors.
The tests were conducted on about 10grams of fresh cooked pasta, cut into strips of 5 cm in length, for each formulation, placed in white plates and in random order, labeled with three-digit numerical codes, in two different sessions. The panelists performed the analysis in a sensory evaluation laboratory that conforms to the international standards [31] and had no specific information about the experimental design. The cooked pasta samples were presented to the sensory panel immediately after cooling to room temperature with distilled water, and all the evaluators were provided with mineral water to rinse the mouth between the tests. 8 pasta samples were tested, 4 at a time, first those obtained with the egg and then those prepared with egg white, using the profile sheet (Figure 1).
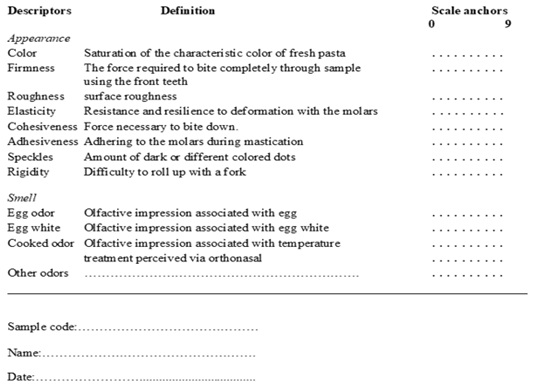
Figure 1: Profile sheet for cooked fresh pasta.
3 strips of each sample encoded with a 3-digit number were randomly distributed to the judges in 18cm diameter paper biodegradable and compostable plates.
The judges were asked to evaluate from 0 to 9, (where 0 corresponded to the absence of perception and 9 to the maximum intensity), the attributes concerning the appearance: Color (CO), Firmness (FI), Elasticity (EL), Roughness (RG), Cohesiveness (CH), Adhesiveness (AD), Speckles (SP), Rigidity (RI) and the smell: Egg odor (EG), Egg white (EW), Cooked odor (TH), other odors), reported on the sheet of the sensory profile of fresh pasta (Figure 1).
Consumer test
Sensory preference test was conducted on cooked pasta samples by 68 untrained judges, pasta’s consumers, 28 males and 40 females aged between 30 and 55y old (mean+/-SD=40,72+/-8,02). Assessors tested 3 strips of each type, four at a time, 15 min apart between the two sessions.
The visual acceptability (appearance) and the overall acceptability (smell, taste and consistency) were evaluated using a 9-point hedonic scale (1=dislike extremely and 9=like extremely).
All tests were conducted into the Tuscia University sensory laboratory.
Statistical analysis
All results are presented as mean±SD. One-way Analysis of Variance (ANOVA) was performed on the data, to verify the differences between the pasta samples, for each variable, and the means were compared using Fisher's Less Significant Differences (LSD) at P<0.05.
Principal Component Analysis (PCA) was used to analyze sensory data and to study the importance of discriminating attributes the pasta samples. PCA was performed and figures were drawn using Unscrambler ® Camo Software AS v.9.7 (Oslo, Norway).
RESULTS AND DISCUSSION
Chemical composition
The fresh pasta samples studied showed a similar amount of water content, between 30.51% (S3) and 32.79% (F2) and ashes between 0.58% (AS2) and 1.00% (S3). Although the difference between the samples is very small, it still appears that the addition of glucomannan leads to a slight increase in ash in all fresh pasta samples, but no in moisture as shown in table 3. As it might be seen, the ash content is always higher in samples containing durum wheat compared to those produced with wheat flour.
|
Sample |
Moisture (%) |
Ash (%) |
|
F2 |
33.50±79 c |
0.73±0.04b |
|
F3 |
31.04±0.78 a |
0.84±0.04c |
|
S2 |
31.75±0.51 ab |
0.95±0.05d |
|
S3 |
30.50±0.84 a |
1.05±0.06e |
|
AS2 |
32.08±0.13b |
0.78±0.04b |
|
AS3 |
31.42±1.08a |
0.96±0.02d |
|
AF2 |
32.79±0.49c |
0.60±0.01a |
|
AF3 |
32.27±0.66bc |
0.76±0.05b |
Table 3: Moisture and ash analysis of different formulations fresh pasta.
Note: Values followed by a different letter are significantly different (P<0.05).
Results are means of two determinations±standard deviation.
Cooking properties of pasta samples
The results are summarized in table 4. The Optimal Cooking Time (OCT) of pasta samples, varied from 4.64 to 6.24 minutes and it showed a slight increase related to the use of semolina durum wheat compared to wheat flour in the dough (Table 5 and 6).
|
Sample |
OCT (min) |
WAI |
SI |
|
F2 |
5.41±0.23b |
84.62±1.62 a |
1.80±0.22a |
|
F3 |
5.21±0.44ab |
103.85±0.84b |
1.95±0.15b |
|
S2 |
6.24±0.33c |
92.31±1.75a |
1.83±0.20a |
|
S3 |
6.22±0.25c |
107.69±0.96b |
2.01±0.10b |
|
AS2 |
6.03±0.11c |
107.69±0.87b |
2.05±0.11b |
|
AS3 |
5.81±0.23bc |
123.08±1.97c |
2.23±0.08c |
|
AF2 |
5.25±0.34ab |
100.03±1.95b |
1.99±0.07b |
|
AF3 |
4.64±0.38a |
115.38±2.88c |
2.17±0.08c |
Table 4: Cooking properties of samples pasta.
Note: Values followed by a different letter are significantly different (P<0.05).
Results are means of two determinations±standard deviation.
|
|
Samples |
|||||||
|
F2 |
F3 |
S2 |
S3 |
AS2 |
AS3 |
AF2 |
AF3 |
|
|
Glycemic Index |
82.9a |
54.3b |
78.5a |
50.4b |
78.3a |
50.2b |
82.5a |
54.2b |
|
% Reduction |
34.50 |
35.80 |
35.89 |
34.30 |
||||
Table 5: Glycemic index (%) of fresh pasta different formulations.
Note: Values followed by a different letter are significantly different (P<0.05).
|
PC1(59%) |
PC2(22%) |
|
|
FI |
0.305 |
0.675 |
|
EL |
-0.507 |
0.469 |
|
AD |
-0.498 |
-0.470 |
|
TH |
0.630 |
-0.309 |
|
SI |
-0.077 |
0.093 |
Table 6: Factor loadings for each principal component.
The water absorption index (WAI) ranged from 84.62% to 123.08%. Data show that adding KGM to fresh pasta leads to an increase in WAI from 14.30% to around 23% and higher Swelling Index values (SI), with increments ranging from a minimum of 8.70% (AS3) to a maximum of 9.95% (S3).
This result can be explained by the fact that the hydroxy group of the molecular structure of the hydrocolloid favors the interaction with water, during the cooking of the pasta, through the hydrogen bond, as hypothesized by many authors [20,32]. The greater ability to absorb and bind water during cooking seems to be related to the content of KGM in the pasta, as similarly observed by clearly and Brennan [23], for the integration of Barley Β-Glucan (BBG) and by Guarda et al. [24], for various hydrocolloids.
Glycemic Index
According to other works [32], that have studied suitable matrices, as a possible integration to improve the nutritional aspect of pasta, KGM also provides excellent results. In fact, the glycemic index of the KGM paste ranged from a minimum of 50.02 (+/-3.5) in the AS3 sample, to a maximum of 54.2 (+/-2.8) for F3, while the control ranged from a minimum of 78.3 (+/-4.2) up to a maximum of 82.9 (+/-3.8), respectively for AS2 and F2. As expected, the minimum values were recorded for pasta made with egg whites and Semolina (AS), while the highest values were for the types of pasta with egg and wheat Flour (F).
Overall, the KGM integration to pasta allowed a reduction in the glycemic index, from a minimum of 34.3% (F3) to a maximum of 35.89% (AS3).
Sensory profile
Concerning the sensory analysis of integrated KGM pasta samples, the main discriminating descriptors were identified through the PCA processing of the data matrix.
The PCA analysis was carried out only on the swelling index and significant sensory descriptors by ANOVA (P<0.05), on the matrix with a size of 8 samples and 5 sensory attributes. To avoid an excessive discriminating influence, the attributes egg and egg white were discarded, in addition to those not significant (P<0.05), such as roughness, cohesiveness, rigidity and speckles.
The first two Principal Components (PC) explained respectively about 59% and 22% of the total variance, with calculated eigenvalues equal to 1.77 and 0.33.
The score-loading bi-plot (Figure 2) showed good separation between different pasta samples according to the ingredients used (egg and egg white), which strongly condition the textural sensory attributes of our samples.
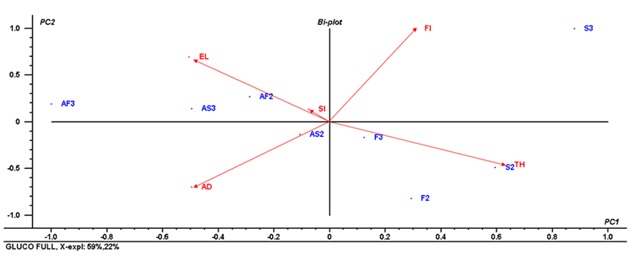
Figure 2: Score-loading bi-plot for pasta samples.
The sample, which mainly differs from the others, is the sample S3, which has low Adhesion Values (AD) and high Firmness (FI), based on the first component, a good Elasticity (EL) and a low Cooked Odor (TH), according to the second component. These characteristics could be linked to the improvement of the structural properties with the strengthening of the gluten network to make the microstructure more compact and continuous in the pasta integrated with KGM as highlighted by Zhou et al. [21]. These features are also those that best explain consumer preferences, as shown in the table 7.
|
Appearance Preference |
Overall Preference |
|||
|
F2 |
4.78 |
b |
5.00 |
c |
|
F3 |
5.24 |
c |
5.96 |
d |
|
S2 |
5.72 |
c |
5.96 |
d |
|
S3 |
7.00 |
d |
6.13 |
e |
|
AS2 |
4.68 |
b |
4.33 |
b |
|
AS3 |
5.12 |
c |
4.82 |
c |
|
AF2 |
3.88 |
a |
3.75 |
a |
|
AF3 |
3.92 |
a |
4.28 |
b |
Table 7: Mean acceptability values appearance and overall preference test.
Note: Values are expressed in means (n=68).
Means in the same columns with different letters are significantly different (P≤0.05, LSD test).
Consumer evaluation
The consumer evaluation of the pasta samples is shown in table 7. As regards the appearance of cooked pasta, the samples that have received the most consensus are those prepared with durum wheat semolina and whole egg. The same result was recorded for global preference.
Probably the use of egg white and flour leads to a loss of consistency not appreciated by the consumer. According to the results obtained by other authors [21], the integration of KGM into fresh pasta significantly increases the overall preference of the consumer, perhaps due to an increase of pasta firmness. The sample with the highest preference value is S3, produced with durum wheat semolina and egg, integrated with KGM and the lowest preference was attributed to the AF2 sample with flour and egg white without KGM (Table7).
The sensorial profile data (Figure 2), described by the panel, can help to explain this result, as mentioned above, in fact, the AF2 sample has high adhesion values and low firmness, characteristics no appreciated by pasta consumers
CONCLUSION
KGM is a dietary fiber capable of representing an excellent partial substitute for flour or semolina in the preparation of fresh pasta, capable of providing a significant nutritional advantage.
The high viscosity of the KGM fiber, introduced with food, delays the absorption of nutrients, increasing the viscosity of the gastrointestinal content due to the increased bond with water. This property allows reducing the glycemic index value, without changing the acceptability of the integrated KGM paste.
In this study, the sensory and cooking properties of different types of fresh pasta were studied, with a whole egg or with egg white and flour or semolina. The results clearly showed how the integration with KGM with fresh pasta can represent an excellent choice to improve the nutritional properties of the pasta with a good response in the acceptability of the product for consumption, appreciated through a consumer test.The sensory characteristics of all the integrated KGM experimental samples showed an increase in firmness and elasticity and in Water Absorption Capacity (WAI) and total Swelling Index (SI) during cooking, with a reduction in the glycemic index greater than 34% in all theses.
From the results of the survey conducted on the samples, it appears that the most different sample from the others is S3, produced with durum wheat semolina and whole eggs. This product also corresponds to the pasta most appreciated by consumers compared to the conventional and experimental samples of this study.
REFERENCES
- IPO (2014) The world pasta industry status report. International Pasta Organization, Rome, Italy.
- Malcolmson LJ (2003) Pasta and macaroni-dietary importance. Encyclopedia of Food Sciences and Nutrition, Academic Press. Pg no: 4378-4380.
- Bashir K, Aeri DV, Masoodi L (2012) Physio- chemical and sensory characteristics of pasta fortified with chickpea flour and defatted soy flour. IOSR-JESTFT 1: 34-39.
- Li M, Zhu KX, Guo XN, Brijs K, Zhou HM (2014) Natural additives in wheat-based pasta and noodle products: Opportunities for enhanced nutritional and functional properties. Compr Rev Food Sci F 13: 347-357.
- Lorusso A, Vernia M, Montemurro M, Coda R, Gobbetti M, et al. (2017) Use of fermented quinoa flour for pasta making and evaluation of the technological and nutritional features. LWT 78: 215-221.
- Brennan CS, Tudorica CM (2008) Evaluation of potential mechanisms by which dietary fibre additions reduce the predicted glycemic index of fresh pastas. Int J Food Sci Tech 43: 2151-2162.
- Dhingra D, Michael M, Rajput H, Patil RT (2012) Dietary fibre in foods: A review. J Food Sci Tech 49: 255-266.
- Foschia M, Peressini D, Sensidoni A, Brennan MA, Brennan CS (2015) How combinations of dietary fibres can affect physicochemical characteristics of pasta. LWT-Food Sci Technol 61: 41-46.
- ISO 26642 (2010) Food products - Determination of the Glycaemic Index (GI) and recommendation for food classification. ISO, Switzerland.
- Goni A, Garcia-Alonso A, Saura-Calixto F (1997) A starch hydrolysis procedure to estimate glycemic index. Nutr Res 17: 427-437.
- Scazzina F, Siebenhandl-Ehn S, Pellegrini N (2013) The effect of dietary fibre on reducing the glycaemic index of bread. Br J Nutr 109: 1163-1174.
- Shah BR, Li B, Wang B, Liu S, Li Y, et al. (2015) Health benefits of konjac glucomannan with special focus on diabetes. Bioact Carbohydr Dietary Fibre 5: 179-187.
- Khanna S, Tester RF (2006) Influence of purified konjac glucomannan on the gelatinisation and retrogradation properties of maize and potato starches. Food Hydrocoll 20: 567-576.
- Katsuraya K, Okuyama K, Hatanaka K, Oshima R, Sato T, et al. (2003) Constitution of konjac glucomannan: Chemical analysis and 13 C NMR spectroscopy. Carbohydr Polym 53: 183-189.
- Behera SS, Ray RC (2017) Nutritional and potential health benefits of konjac glucomannan, a promising polysaccharide of elephant foot yam, Amorphophallus konjac Koch: A review. Food Rev Int 33: 22-43.
- Chua M, Baldwin TC, Hocking TJ, Chan K (2010) Traditional uses and potential health benefits of Amorphophallus konjac Koch ex N.E. Br. J Ethnopharmacol 128: 268-278.
- Cui T, Liu R, Wu T, Sui W, Zhang M (2019) Influence of konjac glucomannan and frozen storage on rheological and tensile properties of frozen dough. Polymers 11: 794.
- Melinda C, Timothy CB, Trevor JH, Kelvin C (2010) Traditional uses and potential health benefits of Amorphophallus konjac Koch ex N.E.Br. J Ethnopharmacol 128: 268-278.
- Yang D, Yuan Y, Wang L, Wang X, Mu R, et al. (2017) A Review on konjac glucomannan gels: Microstructure and application. Int J Mol Sci 18.
- Zhao D, Zhou Y, Liu H, Liang J, Cheng Y, et al. (2017) Effects of dough mixing time before adding konjac glucomannan on the quality of noodles. J Food Sci Technol 54: 3837-3846.
- Zhou Y, Cao H, Hou M, Nirasawa S, Tatsumi E, et al. (2013) Effect of konjac glucomannan on physical and sensory properties of noodles made from low-protein wheat flour. Food Res Int 51: 879-885.
- Zhu F (2018) Modifications of konjac glucomannan for diverse applications. Food Chem 256: 419-426.
- Cleary L, Brennan C (2006) The influence of a (1-3) (1-4)-β-D-glucan rich fraction from barley on the physico-chemical properties and in vitro reducing sugars release of durum wheat pasta. Int J Food Sci Tech 41: 910-918.
- Guarda A, Rosell CM, Benedicto C, Galotto MJ (2004) Different hydrocolloids as bread improves an antistailing agents. Food Hydrocolloids 18: 241-247.
- Rakhesh N, Fellows CM, Sissons M (2014) Evaluation of the technological and sensory properties of durum wheat spaghetti enriched with different dietary fibres. J Sci Food Agr 95: 2-11.
- Cui T, Liu R, Wu T, Sui W, Zhang M (2019) Influence of konjac glucomannan and frozen storage on rheological and tensile properties of frozen dough. Polymers 11: 794.
- AACC International (2000) Approved methods of analysis In: Paul MN (11st edn). American Association of Cereal Chemists International, Washington, DC, USA.
- AOAC (2000) Approved methods of the AOAC. Association of Official Analytical Chemists, William Horwitz Editor, USA.
- MIPAAF (2001) Dereto del Presidente della Repubblica 9 febbraio 2001, n. 187, "Regolamento per la revisione della normativa sulla produzione e commercializzazione di sfarinati e paste alimentari, a norma dell'articolo 50 della legge 22 febbraio 1994, n. 146". Ministero delle politiche agricole alimentari e forestali, Roma, Italy.
- Irie K, Maeda T, Kazami Y, Yoshida M, Hayakawa F (2018) Establishment of a sensory lexicon for dried long pasta. J Sens Stud 33: 12438.
- UNI ISO 8589 (1990) Sensory analysis - General guidance for the design of test rooms. UNI ISO 8589, SAI Global Limited, Australia.
- Turco I, Bacchetti T, Bender C, Zimmermann B, Oboh G, et al. (2016) Polyphenol content and glycemic load of pasta enriched with Faba bean flour. Funct Food Health Dis 6: 291-305.
Citation: Santis DD, Frangipane MT (2020) Effect of Konjac Glucomannan (KGM) Addition on the Sensory Characteristics, the Cooking Properties and the Glycemic Index of Special Fresh Pasta. J food Sci Nutr 6: 053.
Copyright: © 2020 Diana De Santis, et al. This is an open-access article distributed under the terms of the Creative Commons Attribution License, which permits unrestricted use, distribution, and reproduction in any medium, provided the original author and source are credited.