Effects of Photoperiod Regimes on Growth Performance of Heterobranchus bidorsalis (Geoffrey St. Hilaire, 1809) fingerlings under Laboratory Conditions
*Corresponding Author(s):
Samuel PODepartment Of Animal Biology, Federal University Of Technology, Minna, Nigeria
Email:ajakopatrick@yahoo.com
Abstract
Environmental factors are known to influence growth and survival of aquatic organisms. Varying intensities of light can be of great advantage to catfishes. This research investigated the effects of photoperiod regimes on growth performance of Heterobranchus bidorsalis fingerings under controlled environment. A total of ninety (90) samples of the fish were acclimated for a period of 14 days during which they were fed to satiation twice daily. The experimental set-up consists of three treatments 3 replicates in each case. Treatment 1 is the control; 12 hours light and 12 hours dark, treatments 2 and 3 were subjected to 6 hours light and 24 hours total darkness, respectively with each tank stocked with 9 fish samples. The aquarium tanks were routinely placed in a simulated dark room and subsequently natural light in accordance to the duration of exposure desired for a period of 12 weeks. The physico-chemical parameters of the test media were taken according to standard methods. The growth parameters (lengths and weight) of the fish were taken on a weekly basis and the varying morphological pigments were noted at the end of the experiment. The weight gain and specific growth rate were also calculated. The resulting data were subjected to one way analysis of variance. From the results: The highest growth performance of the fish was recorded in T3, followed by T1 while lowest growth performance was recorded in T2. Better feeding efficiency was also influenced by photoperiods as highest feeding rate was recorded in T3. Changes in body pigmentation was more prominent in T3 as H.bidorsalis fingerlings exposed to this regime became black and darker in appearance in comparison to T1 samples which were lighter in complexion. Consequently, it is believed that subjecting H.bidorsalis fingerlings to 00L: 24D photoperiod regime by fish farmers can lead to improved farm yield and profits to the farmers.
Keywords
Growth parameters; Heterobranchus bidorsalis; Photoperiod regimes; Pigmentation; Specific growth rate; Weight gain
Introduction
Fish farming has become a worldwide practice over the years that involve growing and cultivation of different species of fish (and other aquatic animals) for various purposes such as, domestic and commercial consumption, ornamental and for advanced research. It is known that fish supplies over 50% of the total animal protein consumed in developing countries and less so in developed countries [1]. Fish is also an important and the cheapest source of animal protein and account for about 37% of Nigeria’s total protein requirement [2].
Heterobranchus bidorsalis belongs to the Clariidae family of bony fish (Osteichthyes) which are economically important food fish in Nigeria and in many other parts of the world [3]. The genus, consists of four known species which are: H.bidorsalis, H.longifilis, H.isopterous and H.boulengeri. H.bidorsalis is one of the commercially important species of fish for rapid aquaculture expansion in Nigeria and elsewhere in the developing world, due to its fast growth rate, high feed conversion ratio and utilization, high resistance to stress and disease, desirable as food, readily accepts artificial diets, and feeds over a wide range of diets; it is omnivorous and possesses accessory breathing organs which enable them to tolerate adverse aquatic conditions where other cultivable fish species cannot survive [4,5].
Spectral composition is a main characteristic of light. In water, light rays of different wavelength pass to different depths depending on light absorption and diffusion as well as availability of admixtures and small organisms in the water body. Most fish species have well developed colour, sights and are therefore very sensitive to coloured light. For instance, the growth rate of silver carp larvae (Hypopthalmichthys molitrix Val.) and young carp (Cyprinus carpio L.) increased with green light [6]. Photoperiod is one of the exogenous factors that can directly influence the growth of fish through changes in endocrine functioning and hormone secretions (such as melatonin and thyroxin); it regulates the daily endogenous rhythm in fish and also affects growth, locomotion activity, metabolism rates, body pigmentation, sexual maturation and reproduction [7-9]. In nature, light intensity and background color can affect feed detection and feeding success of cultured fish, thus influencing fish growth and mortality. In general highest growth rate of fish larvae are achieved when light conditions and background color optimize the contrast between the feed and the background [10-12]. Varying photoperiods have been used to increase the growth of different stages of fish species, reduce sexual maturation and vary the time of spawning [13]. One of the simple, low-cost techniques that can be used to obtain faster growth during the intense production of H.bidorsalis juveniles is photoperiod manipulation. Although diurnal and seasonal light cycles, as well as changes in day length produce a predictable variation in the environment of organisms, photoperiodism is associated with biological rhythms [14] and circadian rhythms usually have period lengths that are remarkably temperature sensitive. Photoperiod manipulation can be used to regulate physiological functions such as growth, survival, gonadal maturation, reproduction [15] and metabolism in fish.
Very few studies have addressed the effects of different photoperiods on the mortality, growth, feeding rate and welfare of tropical African fish species, especially highly cultured species such as the African H.bidorsalis. This study therefore, attempted to extend the bounds of knowledge on the effects of varying photoperiod regime on morphological and physiological conditions offingerlings of H.bidorsalis in terms of growth, survival and body colouration; and how these can be harnessed in aquaculture for improved fish production.
Materials And Methods
Sample collections, acclimation and experimental Set-up
Samples of H.bidorsalis fingerlings were transported from a private hatcheries farm, Ibadan, Oyo State to the Laboratory in an open ventilated 25 litres aquarium container filled with water. The juveniles were allowed to acclimatize for two weeks so as to allow them recover from all form of stress, adapt to their new environment and ensure that there is no infection from the source [16]. During the period of acclimatization, the fishes were fed with commercial diet (Coppens) to satiation, morning and evening [17]. The experiment was carried out in the Laboratory of the Department of Animal Biology, Bosso campus, Federal University of Technology, Minna, Niger State, Nigeria. Minna is located between latitude 9’ 31 and 0 North and Longitude 6 31 and 6’ 45 East of the equator. The experiment consists of three treatments and triplicated in each case. Treatment 1 is the control 12 hours light and 12 hours dark, treatments 2 and 3 were exposed to 6hours light and 24 hours total darkness, respectively. The aquarium tanks were routinely placed in a simulated dark room and subsequently natural light in accordance to the duration of exposure desired. Nine plastic indoor aquaria tanks with 20 litres capacity (50×30×30cm3) were filled with water up to 20 litres level. Each tank was stocked with 9 fingerlings of H.bidorsalis.
The physico-chemical parameters of the tanks were monitored weekly between the hours of 8:00 am and 10.00 am. Water medium was changed twice in a week. Left over feed and faecal samples in all the tanks was siphoned immediately after feeding. The experiment was run for a period of twelve weeks. The following physico-chemical parameters were measured routinely using automated multi-parameter instruments; Water temperature (T°C), Dissolved Oxygen (mg/L) with Hanna instrument (model JPB-607), pH and Electrical Conductivity (µS/cm) with Hanna meter-H19813 according to standard methods [18].
Growth Parameters
Standard length and total length: At the end of every week, 4 fishes were randomly selected from each experimental tank with a piece of fine mesh net, gently placed on paper towels in order to absorb most of the adhering water and individual fish was measured with a transparent ruler in centimetres. The standard length was measured from the head to the point of beginning of tail extension (caudal lobe) of the fish while the total length was taken from the head to the end of the tail of the fish. Minimal handling was ensured to reduce stress.
Weight: The weight of the fish was determined every week by taking the individual weight of the 4 randomly sampled H.bidorsalis juvenile from each tank. This was determined by using a sensitive Tripple bean balance (model 700) graduated in grams.
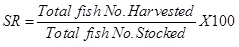
Survival rate: The survival rate of the fish was determined at the end of the experiments follow:
 Weight gain (%): The fish Weight Gain (WG) was calculated as the difference between the final weight of the fish at the end of the experiment and the initial weight gain in gramsthus:

Specific Growth Rate (SGR): The Specific Growth Rate (SGR) was calculated using the formula
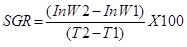
Where; W1 = Initial weight, W2 = Final weight, T1 - T2 = Number of days.
Daily Growth Rate (DGR): Daily Growth Rate was calculated using the formula:
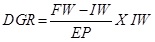 Where; FW = Final weight, IW = Initial weight, EP = Experimental period.
Data analysis
Data obtained from this experiment were subjected to one-way Analysis of Variance (ANOVA). Duncan’s Multiple Range Test (DMRT) was used to determine the difference between the means (P<0.05) where significant.
Results and Discussion
Results
Mean weight of H.bidorsalis fingerlings subjected to varying photoperiod regimes: The mean weight of H.bidorsalis fingerlings exposed to different photoperiodic regimes in treatments 1 and 3 showed increase in weight from week 1 - 12. The result showed that T3 mean values were significantly higher (at P ≤ 0.05) in the majority of the weeks of subjecting H.bidorsalis fingerlings to different photoperiodic regimes (Table 1).
|
Treatments |
|||
|
Weeks |
T1 |
T2 |
T3 |
|
1 |
0.9200 ± 0.019a |
0.9575 ± 0.019a |
0.9867 ± 0.011a |
|
2 |
1.7617 ± 0.230b |
1.495 ± 0.185a |
1.9367 ± 0.274c |
|
3 |
2.2040 ± 0.354e |
1.438 ± 0.223f |
2.3008 ± 0.432d |
|
4 |
2.7875 ± 0.486h |
1.7675 ± 0.317i |
3.6808 ± 0.619g |
|
5 |
3.1158 ± 0.657k |
1.8292 ± 0.389l |
4.4158 ± 0.955j |
|
6 |
7.9080 ± 0.565m |
1.4392 ± 0.347o |
4.0067 ± 0.888n |
|
7 |
3.5542 ± 0.703q |
1.7400 ± 0.441r |
4.4617 ± 0.689p |
|
8 |
4.3067 ± 0.849t |
2.1033 ± 0.544u |
5.7633 ± 0.841s |
|
9 |
7.5008 ± 1.622w |
4.8100 ± 2.554x |
11.5240 ± 2.9660v |
|
10 |
8.2625 ± 1.713z |
5.3329 ± 2.659a |
12.8718 ± 3.231y |
|
11 |
8.9242 ± 1.811c |
5.8586 ± 2.769d |
14.2309 ± 3.501b |
|
12 |
4.3067 ± 0.843f |
2.1033 ± 0.554g |
5.7633 ± 0.861e |
Table 1: Mean weight values of H.bidorsalis subjected to varying photoperiod regimes for a period of 12 weeks.
Mean values with the different alphabet as superscript across the rows are significantly different at P ≤ 0.05.
Total and standard lengths of H.bidorsalis fingerlings subjected to varying photoperiod regimes
The mean total and standard lengths of H.bidorsalis fingerlings exposed to different photoperiodic regimes from treatments 1 to 3 showed steady increase in total and standard lengths from weeks 1 - 12. The result showed that the total length of samples of T3 mean values were significantly higher (at P≤0.05) throughout the weeks of subjecting H.bidorsalis fingerlings to different photoperiodic regimes from weeks. T2 mean values were relatively lower than other treatments. Likewise, the standard lengths of the samples of T3 mean values were also significantly higher than other treatments especially as from weeks 3-12. (Tables 2 & 3).
|
Treatments |
|||
|
Weeks |
T1 |
T2 |
T3 |
|
1 |
5.5917 ± 0.202a |
5.5917 ± 0.114a |
5.8500 ± 0.197b |
|
2 |
6.4250 ± 0.236d |
5.925 ± 0.202e |
6.6083 ± 0.249c |
|
3 |
6.7583 ± 0.367g |
5.9667 ± 0.278h |
6.9917 ± 0.390f |
|
4 |
7.1750 ± 0.475j |
6.0833 ± 0.375k |
8.1417 ± 0.438i |
|
5 |
7.7000 ± 0.546m |
6.3917 ± 0.399n |
8.6500 ± 0.576l |
|
6 |
8.8583 ± 0.499p |
6.8417 ± 0.484q |
9.6833 ± 0.670o |
|
7 |
9.4250 ± 0.719s |
7.1667 ± 0.563t |
10.7083 ± 0.714r |
|
8 |
9.9917 ± 0.676v |
7.5250 ± 0.643w |
11.8000 ± 0.829u |
|
9 |
10.2000 ± 0.719y |
8.7000 ± 1.331z |
11.7000 ± 0.829x |
|
10 |
10.7667 ± 0.799b |
9.1571 ± 1.462c |
12.8273 ± 1.162a |
|
11 |
11.3333 ± 0.867e |
9.6143 ± 1.597f |
13.9455 ± 1.336d |
|
12 |
7.7100 ± 0.545i |
8.8530 ± 0.499h |
11.8300 ± 0.829g |
Table 2: Mean Total length values of H.bidorsalis subjected to varying photoperiod regimes for a period of 12 weeks.
Mean values with the different alphabet as superscript across the rows are significantly different at P ≤ 0.05.
|
Treatments |
|||
|
Weeks |
T1 |
T2 |
T3 |
|
1 |
4.7583 ± 0.172b |
4.7583 ± 0.101b |
5.0500 ± 0.171a |
|
2 |
5.5833 ± 0.209c |
4.9750 ± 0.186d |
5.5917 ± 0.228c |
|
3 |
5.8167 ± 0.315f |
5.0750 ± 0.247g |
6.0083 ± 0.347e |
|
4 |
6.1750 ± 0.413i |
5.1667 ± 0.356j |
7.0167 ± 0.384h |
|
5 |
6.6583 ± 0.482l |
5.4750 ± 0.359m |
7.4333 ± 0.499k |
|
6 |
7.3917 ± 0.481o |
5.7500 ± 0.440p |
8.4000 ± 0.592n |
|
7 |
8.0500 ± 0.569r |
6.0750 ± 0.523s |
9.4583 ± 0.653q |
|
8 |
8.6167 ± 0.656u |
6.3833 ± 0.618v |
10.5167 ± 0.776t |
|
9 |
8.7167 ± 0.624x |
7.4857 ± 1.151y |
11.1455 ± 0.998w |
|
10 |
9.2833 ± 0.697a |
7.8429 ± 1.302b |
11.1455 ± 0.998z |
|
11 |
9.8500 ± 0.776d |
8.3429 ± 1.435e |
12.2636 ± 1.524c |
|
12 |
7.6167 ± 0.856h |
8.3833 ± 0.878g |
10.5167 ± 0.976f |
Table 3: Mean Standard length values of H.bidorsalis subjected to varying photoperiod regimes for a period of 12 weeks.
Mean values with the different alphabet as superscript across the rows are significantly different at P ≤ 0.05.
The feeding rate of H.bidorsalis fingerlings subjected to varying photoperiod regimes
The mean feeding rates of H.bidorsalis fingerlings subjected to different photoperiodic regimes indicated that there were significant differences in T3 (in comparison to other treatments) from weeks 3-12. There were also steady increases in the feeding rates in all treatments from weeks 1-12 (Table 4).
|
Treatments |
|||
|
Weeks |
T1 |
T2 |
T3 |
|
1 |
0.6529 ± 0.031a |
0.6514 ± 0.031a |
0.6800 ± 0.037a |
|
2 |
0.7557 ± 0.092b |
0.7557 ± 0.092b |
0.7286 ± 0.059c |
|
3 |
0.7343 ± 0.079e |
0.7343 ± 0.079e |
0.7986 ± 0.092d |
|
4 |
0.6200 ± 0.048h |
0.6914 ± 0.032g |
0.8229 ± 0.029f |
|
5 |
0.8671 ± 0.070j |
0.7500 ± 0.048k |
0.9300 ± 0.046i |
|
6 |
1.1700 ± 0.018m |
0.9600 ± 0.011n |
1.1986 ± 0.018l |
|
7 |
1.4814 ± 0.099p |
1.1129 ± 0.033q |
1.5714 ± 0.112o |
|
8 |
2.6114 ± 0.161s |
1.4200 ± 0.104t |
2.7043 ± 0.841r |
|
9 |
3.1614 ± 0.019u |
1.2029 ± 0.068x |
2.7043 ± 0.841v |
|
10 |
2.8186 ± 0.069z |
1.2071 ± 2.658a |
2.9129 ± 0.052y |
|
11 |
2.8900 ± 0.596c |
1.2514 ± 0.083d |
3.0086 ± 0.024b |
|
12 |
2.6114 ± 0.151f |
1.4200 ± 0.105g |
2.7043 ± 0.831e |
Table 4: Feeding rates of H.bidorsalis subjected to varying photoperiod regimes for a period of 12 weeks
Mean values with the different alphabet as superscript across the rows are significantly different at P ≤ 0.01.
Weight derivatives of H.bidorsalis fingerlings subjected to varying photoperiod regimes.
The weight derivatives and growth performance indices such as weight gain, daily growth rates and specific growth rates of H.bidorsalis fingerlings subjected to different photoperiodic regimes showed that there were significance differences in growth responses of T3 samples from weeks 1 - 12. (Table 5).
|
Treatments |
|||
|
Parameters |
T1 |
T2 |
T3 |
|
Initial Mean Weight (g) |
0.92 ± 0.01903c |
0.9575 ± 0.0192b |
0.9867 ± 0.0113a |
|
Final Mean Weight (g) |
4.3067 ± 0.84342e |
2.1033 ± 0.5537f |
5.7633 ± 0.86089d |
|
Mean Weight gain (g) |
3.3867 ± 0.82439b |
1.1458 ± 0.82439c |
4.7766 ± 0.84959a |
|
Daily Growth Rate (%) |
5.1962 ± 0.39e |
1.6231 ± 0.11f |
6.372 ± 0.45d |
|
Specific Growth Rate (%/day) |
48.38 ± 11.777h |
16.37 ± 11.777i |
68.24 ± 12.137g |
Table 5: Weight derivatives of H.bidorsalis fingerlings subjected to different photoperiod regimes for a period of 12 weeks.
Values with the different superscript are significantly different from each other across the rows (P ≤ 0.01). T1 represents (12L:12D), T2 represents (6L:18D) and T3 represents (00L:24D).
Water quality parameters of H.bidorsalis fingerlings subjected to varying photoperiod regimes.
The mean water quality parameters of H.bidorsalis fingerlings exposed to different photoperiodic levels fromT1 to T3 displayed slight variations in water quality parameters from weeks 1 - 12 (Table 6).
|
Treatments |
|||
|
Parameters |
T1 |
T2 |
T3 |
|
Temp (°C) |
26.8333 ± 0.26916b |
27.2667 ± 0.15635a |
26.9333 ± 0.07601b |
|
DO (mg/L) |
4.8 ± 0.86718e |
3.9167 ± 0.41426g |
4.1333 ± 0.38268f |
|
pH |
9.5167 ± 0.01667h |
9.4167 ± 0.01667i |
9.4167 ± 0.01667i |
|
EC (µS/cm) |
55.8333 ± 2.613k |
55.667n ± 2.72845l |
56.5 ± 2.55j |
Table 6: Physico-chemical parameters of the test media for H.bidorsalis subjected to different photoperiod regimes for a period of 12 weeks.
Values with the different superscript are significantly different from each other across the rows (P ≤ 0.01). T1 represents (12L:12D), T2 represents (6L:18D) and T3 represents (00L:24D).
Body pigmentation of H.bidorsalis fingerlings subjected to varying photoperiod regimes
At the end of the experimental period, H.bidorsalis fingerlings subjected to different photoperiod regimes showed distinct body pigmentations. Samples in T1 showed a lighter appearance, T2 had the normal dark colouration on the dorsal part while those in T3 were darker and black in appearance.
Discussion
The results of the study indicated that H.bidorsalis fingerlings respond differently to varying photoperiod regimes. The highest mean weight was recorded in T3 (5.7633 ± 0.8609g). There was significant difference in the mean weight, total length and feeding rates of H.bidorsalis fingerlings exposed to different photoperiod regimes with the fastest growth rate, weight gain, feeding rate and total length recorded in T3, followed by T1 as control with lowest response recorded in T2. The rapid growth response recorded in treatment T3 could be attributed to better feed conversion efficiency as well as reduction or absence of stress and aggression with reduced swimming activities of H.bidorsalis fingerlings as energy that could have been expended in these activities are now used for growth. This is also probably because the specie of interest is predominantly nocturnal. Similar findings were by Appelbaum and Kamler [19], on physiological responses of Clarias gariepinus to total darkness photoperiod regime. Adewolu [16], also reported growth increase in C.gariepinus under total darkness and attributed his result to high feeding activity in the dark for the high growth rate.
The growth performance indices indicated that the highest mean growth performance was obtained in photoperiod regime T3, followed by regime T1, while regime T2 had the least growth performance. The high specific growth rate under total darkness was probably as a result of the complete feeding and utilization of the feed in the dark, more so because these fishes are nocturnal feeders as earlier adduced. Colour variations were observed by direct visual observations among the fish in the three treatment tanks. H.bidorsalisin T1 had a lighter appearance; fish from T2 had the normal dark colouration on the dorsal part, while fish in group T3 were darker and black in appearance. The absence of light was probably responsible for the very dark colouration observed in the fish reared under total darkness (00L: 24D). Similar morphological pigmentation differences were reported by Mashood et al. [20], when they observed that fish cultured in total darkness 00L: 24D had darker skin colouration than those in 12D:12L. This could be due to physiological response of the fish in the dark in increasing the simulation and production of melatonin [21]. Fish species that are reared under continuous darkness or light usually become adapted to the prevailing environmental conditions especially photoperiods; thus, they live with them. In cod, Gadus morhua the mean weight of juveniles reared under continuous light was 13% greater than those kept under a natural photoperiod for 120 days [22]. Photoperiod controls growth through its influence on endogenous rhythms and circulating levels of growth hormone [23]. Previous studies performed on the effect of photoperiod on growth performance of C.gariepinus concluded that growth can be affected by day length with fish performing better under short-day photoperiods [16]. The constant change between day and night affected the physiology, feeding efficiency, and metabolism of the fish. Metabolic activities consume energy that would have been converted to body weight had it been that the fish were not engaged in high energy demanding activities.
Physicochemical parameters such as water temperature, pH, dissolved oxygen, electrical conductivity determined throughout the rearing period were more or less normal in any tropical environment. Conductivity range (56.5±2.55278 - 55.8333±2.613) is below the conductivity value of 140 - 160 µS/cm reported by Ovie and Madu [24], when he reared H.longifilis fry in different stocking densities at temperature range between 28.8°C to 28.9°C for 41 days. Cultured water pH was slightly. The DO values obtained in this research are within the normal range for survival of cat fishes. For instance, the optimal dissolved oxygen concentration for growth of eggs and juveniles of African catfish (C.gariepinus) is 9 mg/L, while adults would survive in water of at least 3mg/L dissolved oxygen [25]. Also, the ranges of values obtained are within the range for optimal fish production [26].
Conclusion and Recommendations
The result of the study recorded highest growth performances in T3 (00L:24D) photoperiod regime, followed by (12L:12D) regime while lowest growth performances were recorded in T2 (6L:18D) photoperiod regime.
Changes in body pigmentation was more prominent in (00L:24D) photoperiod regime as H.bidorsalis fingerlings exposed to this regime becomes black and darker in appearance.
The reduction of direct influx of light in fish culture could be an invaluable asset in improving growth performance of cat fishes in fish farming.
References
- Ayoola OA, Fredrick CA (2010) Effects of the Shape of Culture Tanks on Production of The African Catfish Clarias gariepinus Journal of Agriculture and Social Research 12: 11-18.
- Federal Department of Fisheries (2002) Fisheries statistics of Nigeria. Federal Department of Fisheries, Abuja, Nigeria.
- Owodeinde FG, Fakoya KA, Anetekhai MA (2012) Growth performance of hybrid catfish Clarias gariepinus (x) Heterobranchus bidorsalis in Earthen ponds. Asian Journal of Biological Sciences 5: 192-200.
- Agbebi OT, Olufeagba SO, Mbagwu IG, Ozoje MO, Aremu A (2009) Morphological characteristics and body indices of Heterobranchus bidorsalis from three geographical locations in Nigeria. Journal of Fisheries International 4: 68-72.
- Owodeinde FG, Ndimele PE (2011) Survival, growth and feed utilization of two Clariid catfish (Clarias gariepinus, Burchell 1822 and Heterobranchus bidorsalis, Geoffroy, 1809) and their reciprocal hybrids. Journal of Applied lcthyology 27: 1249-1253.
- Ruchin AB (2004) Influence of colored light on growth rate of juveniles of fish. Fish physiology and Biochemistry 30: 175-178.
- Tripple EA, Neil SRE (2002) Effects of photoperiod and light intensity on growth and activity of juvenile haddock (Melanogrammus aeglefinus). Aquaculture 217: 633-645.
- Biswas AK, Endo M, Tekeuchi T (2002) Effects of different photoperiod cycles on metabolic rate and energy loss of both fed and unfed young tilapia Oreochromis niloticus: part I. Fisheries Science 68: 465- 477.
- Biswas AK, Morita T, Yoshizaki A, Maita M, Tekeuchi T (2005) Control of reproduction in Nile tilapia, Oreochromis niloticusn (L.) by photoperiod manipulation. Aquaculture 234: 229-239.
- Henne JP, Watanabe WO (2003) Effects of light intensity and salinity on growth, survival and whole-body osmolarity of larval southern flounder Paralichtys letostigma. Journal world Aquaculture Sacrifice 34: 450-465.
- Jentoft S, Oxnevade S, Aastvict AH, Anderson O (2006) Effects of tank wall color and up-welling water flow no growth and survival of Eurasian perch larvae (Perca fluvaiatlis). Journal World Aquaculture Society 37: 313-317.
- Strand A, Magnhagen C, Alanara A (2007) Effects of repeated disturbance of feed intake growth rate and energy expenditures of juvenile perch, Perca fluviatilis. Aquaculture 265: 163-168.
- Stevenson P (2007) Closed waters: The welfare of farmed atlantic salmon, rainbow trout, atlantic cod and atlantic halibut. WSPA, Godalming, England, UK.
- Helfrich-Förster C (2003) The neuroarchitecture of the circadian clock in the brain of Drosophila melanogaster. Microsc Res Tech 62: 94-102.
- Björnsson BT, Hemre GI, Bjørnevik M, Hansen T (2000) Photoperiod regulation of plasma growth hormone levels during induced smoltification of underyearling Atlantic salmon. Gen Comp Endocrinology 119: 17-25.
- Adewolu MA, Ogunsanmi AO, Yunusa A (2008) Studies on growth performance and feed utilization of two clariid catfish and their hybrid reared under different culture systems. European Journal of Scientific Research 23: 252-260.
- Han D, Xie S, Lei W, Zhu X, Yank Y (2005). Effect of light intensity on growth, survival and skin color of Juvenile Chinese longsnout catfish (Leiocassis longirostris Gunther). Aquaculture 248: 299-306.
- Eaton AD (2005) Standard methods for the examination of water and wastewater (21st edn). American Public health Association, American Water Works Association, and Water Environmental Federation. Washington, DC, USA. Pg no: 7-15.
- Appelbaum S, Kamler E (2000) Survival, growth, metabolism and behaviour of Clarias gariepinus (Burchell 1822) early stages under different light conditions. Aquacultural Engineering 22: 269-287.
- Mashood K, Mustapha BU, Okafor KS, Olaoti O, Oyelelakin K (2012) Effects of three different photoperiods on the growth and body coloration of juvenile African catfish, Clarias gariepinus (Burchell). Architecture in polyculture of fish 20: 55-59.
- Hisar SA, Kirin B, Bektas S, AHinkaynak K, Hisar O, et al. (2005) Effect of photoperiod on plasma thyroxine hormone level of mirror carp (Cyprinus carpio) raised at a low water temperature in a controlled environment. Iso Journal of Aquaculture Bamidgeh 57: 19-24.
- Nagasawa K, Giannetto A, Fernandes JMO (2012) Photoperiod influences growth and mll (Mixed-Lineage Leukaemia) expression in Atlantic Cod. Plos ONE 7: 36908.
- Simensen LM, Jonassen TM, Imsland AK, Stefansson SO (2000) Photoperiod regulation of growth of juvenile Atlantic halibut (Hippoglossus hippoglossus ). Aquaculture 190: 119-128.
- Ovie SO, Madu A (2008) Growth and survival of Heterobranchus longifilis fry in different stocking densities. The Zoologist 6: 21-26.
- FAO (2013) Improving pond water quality. FAO, Rome, Italy.
- Boyd CE, Lickotoper FI (2014) Water quality in pond for aquaculture. Alabama Agriculture Experimenta station, Auburn University Alabama, Alabama. Pg no: 30.
Citation: Samuel PO, Nuraini U, Ayanwale AV, Muhammed AZ, Mgbemena SA, et al. (2021) Effects of Photoperiod Regimes on Growth Performance of Heterobranchus bidorsalis (Geoffrey St. Hilaire, 1809) fingerlings under Laboratory Conditions. J Aquac Fisheries 5: 037.
Copyright: © 2021 Samuel PO, et al. This is an open-access article distributed under the terms of the Creative Commons Attribution License, which permits unrestricted use, distribution, and reproduction in any medium, provided the original author and source are credited.