Evaluating the Temperature of Incoming Raw Milk at a Dairy Processing Plant
*Corresponding Author(s):
Niamh BurkeDairy Processing Technology Centre (DPTC), University Of Limerick, Limerick, V94 T9PX, Ireland
Tel:+353 61234171,
Email:Niamh.Burke@ul.ie
Abstract
Ensuring stringent temperature control parameters and efficient cooling mechanisms are maintained at a dairy plant are critical to downstream processing capabilities and product quality. This study examined the temperature of incoming raw milk across three production months (June, July, August 2018), to capture peak season processing at one dairy manufacturing plant. A total of n=4,236 data points across three milk intake bays were analysed.Across the study area, the average temperature of incoming milk was 6.18°C (1.54 Standard Deviation (SD)). After the initial cooling step in the dairy facility, the average temperature of stored raw milk was 4.74°C (0.77 SD), with an average cooling performance of -1.44°C (SD 1.34). This research highlights for the first time, the analysis of a narrow but important quality step in a milk processing plant, namely the critical criteria of temperature monitoring and flow rate management at a dairy processing facility.
Keywords
Cold-chain; Dairy; Quality; Processing; Temperature
Introduction
Temperature management of the raw milk supply chain is a key performance indicator at dairy processing plants. European Union legislation [1], allows a milk processing plant to collect milk on farm up to 10°C and it requires milk to be cooled and stored to a temperature of no more than 6°C until further processing. Milk is virtually sterile once synthesised in the mammary gland of a healthy cow and sterility is diminished once the animal has been milked. Daily milk collection is not sustainable for large dairy plants and as the temperature of milk leaving the udder at 35°C is highly favourable for bacterial growth [2], cooling and maintaining the temperature of raw milk thereafter is essential in avoiding an increase in microbial load.
After raw bulk milk arrives at a manufacturing plant it must undergo a suite of legislative and quality tests [3] before it is pumped through Plate Heat Exchange (PHE) units and stored in silos until further processing. A composite sample from each lorry compartment is tested for Somatic Cell Counts (SCC), Total Bacterial Counts (TBC), acidity and antibiotics [4]. SCC levels in milk are correlated with herd health and can rise with temperature increases. Uncontrolled SCC levels in milk can considerably reduce protein and fat recovery and ultimately reduce yields, particularly in cheese production [5]. It is estimated that Gram-negative microflora accounts for more than 90% of the total psychrotrophic raw milk microflora [6]. Thermophylic bacteria can also be detrimental to the production of dairy products [7,8] claimed temperature plays an important role in the formation of biofilm, a microbial population that adheres to a solid surface. Biofilm build up can be difficult to eliminate even with stringent cleaning in place programs [9]. If bacterial growth is not arrested early on in the production chain, it may result in special-cause variation in a manufacturing process and final product quality will be compromised.
Time/temperature storage parameters for intake silos have significant importance on the raw milk cold supply chain. A review of the literature demonstrated that the optimum temperature of stored raw milk is 4°C [10-12]. A higher temperature of the incoming raw milk supply greatly reduces storage time of the product and puts pressure on production schedules. However, milk reception facilities oftentimes fall foul of a balance between raw milk supply and downstream production demands [13] and time/temperature parameters can be overlooked. O’Connell et al., [14] concluded there was no increase in total bacterial counts in raw bulk milk stored for up to 96 hours at 2°C and 4°C, however for milk stored at 6°C significant bacterial growth was observed after 48 hours of storage. Design and optimisation of cooling equipment at milk reception facilities is also essential for temperature management. Ensuring regular maintenance of temperature sensors will allow for enhanced regulation of flow rates through PHE, while efficient cooling systems can be influenced by milk volumes and the temperature of the coolant being used [15]. Therefore, optimising milk intake activities and adhering to strict time/temperature storage parameters will maintain processing capabilities and uphold raw milk quality on site.
To uphold product quality and optimise processing capabilities, it is imperative that best practice guidelines for temperature management of raw milk at dairy manufacturing plants are followed. To our knowledge, there is minimal research focusing on the management of raw milk at dairy plants. The approach of this study was to evaluate incoming raw milk temperatures and logistical functions at one dairy manufacturing plant across three production months during high season processing times.
Materials and Methods
Site study description
The temperatures of incoming raw bulk milk were analysed across a three-month period (June, July, August 2018) at a large dairy manufacturing plant. The milk reception area consists of three reception bays where 39 milk lorries pump milk to one of two raw milk storage silos. Milk is cooled via Plate Heat Exchangers (PHE) as it is pumped from a lorry to a raw milk-holding silo. Every minute, as pumping takes place, a manufacturing execution system (MES) automatically records the temperature of milk flow with inline sensors located before and after the PHE. The company processes over 300million litres of milk annually in accordance with EU legislation [1] protocols and manufactures a range of food ingredients including fats and powders. Company-identifiable information was removed to preserve confidentiality.
Data analysis
Prior to analysis, data cleaning was implemented to detect and correct corrupt records. Of the total data set, 105 outliers and 7 corrupt data points were removed; therefore, 4,236 data points were assessed. Data were extracted from a Laboratory Information Management System (LIMS) utilised by the plant, and amalgamated in a Microsoft Office Excel® spreadsheet for three production months (June, July, and August 2018). Data were categorised based on truck identification number, intake bay number, sample number, date, time, temperature of milk before pumping, temperature of milk after pumping, and milk pumping duration. All data were stored on a password-protected computer and any identifying information was removed in order to preserve confidentiality.
Statistical analysis
All data were analysed using the statistical analysis software package IBM SPSS Statistics 26 and Microsoft Excel 2016®. Statistical significance was set at the 95% confidence level (p<0.05) by convention.
Pareto analysis
The data are presented in Pareto charts, which are widely used in quality control settings to identify critical factors leading to failure or defects in a process [16].
Data were scored in a standard scale and arranged in descending order. The percentage of each item in relationship to the total measurement of all items was calculated. Once it is assured that the combined percentages equal 100%, a bar graph with elements for each individual item was created. Superimposed on this bar graph is a line graph that represents the cumulative percentage. Noting the highest score and working through the items to the 20 per cent point in the line graph, the changes represented in this area of the graph will have the biggest benefit. Conversely, the items with the lowest scores (as we get closer to 100% in the line graph) will have the least amount of benefit [17].
Results
Milk pumping duration
There were 4,236temperature data points across the three-month period (n = 4,236). The first parameter to be analysed was the pumping time of each load of raw bulk milk delivered to the plant. On assessment of pump time duration, 50.49% (n = 2,139) lorry loads took an average of 30 to 40 minutes to offload milk to raw holding silos. A further 30.15% (n = 1,277) loads took between 20 to 30 minutes to offload milk. While 10.34% (n = 438) loads took between 10 to 20 minutes to pump milk (Figure 1). In all 91% (n = 3,854) of pumping times were under 40 minutes, with 3.6% less than 10 minutes.
 Figure 1: Pumping time duration of milk loads across all three bays.
Milk intake bay usage and cooling efficiency
Following an analysis of pumping time distribution, each milk intake bay was investigated for frequency of use by every lorry driver and the average cooling performance of the Plate Heat Exchangers (PHE). Bay two displayed the highest usage frequency among drivers (36.3%, n = 1,538), while bay one displayed the lowest (28.3%, n = 1,200). There were very little differences in usage (6-8%) across the three bays. In terms of cooling performance, bay three displayed significantly lower cooling efficiency (avg. ΔTemp = -0.93°C), in comparison with the other two bays (Table 1). Minor improvements could be achieved across the usage of the milk intake bays by continuous monitoring and trending of the cooling performances of the PHE. In terms of the milk intake flow rate, bay one displayed the greatest flow rate (46,743 L/h) in comparison with the other two bays. Bay three displayed the lowest flow rate (43,733 L/h) (Table 2). All intake bay stations were substantially lower than their optimal intake capacity, with Bay 1 at 66.8%; Bay 2 at 66%; Bay 3 at 62.5%, averaging 65%.
|
BAY NUMBER |
Cooling Temp |
Count |
Frequency % |
AVG Temp IN |
AVG |
|
Bay 1 |
-1.75 |
1,200 |
28.3% |
6.54 |
4.78 |
|
Bay 2 |
-1.63 |
1,538 |
36.3% |
6.29 |
4.65 |
|
Bay 3 |
-0.93 |
1,498 |
35.4% |
5.72 |
4.79 |
Table 1: Usage Frequency and Cooling Performance of Intake Bays.
*Temp = Temperature *AVG = Average
|
Milk Intake Bays |
All |
Bay 1 |
Bay 2 |
Bay 3 |
|
Theoretical Capacity (L/h) |
70,000 |
70,000 |
70,000 |
70,000 |
|
Average Flow Rate (L/h) |
45,659 |
46,743 |
46,209 |
43,733 |
|
Standard Error |
954.0 |
1839.5 |
1431.6 |
1733.7 |
Table 2: Average Flow Rate of Intake Bays.
*L/h = litres per hour
Temperature analysis
Temperatures across all intake bays
The mean temperatures of all bulk raw milk loads across all intake bays were analysed (n = 4,236). Across the site the average temperature of incoming milk was 6.18°C (SD 1.54) while after cooling, the average temperature was 4.74°C (SD 0.77), with an average cooling performance of -1.44°C (SD 1.34). The maximum temperature of incoming raw bulk milk for the three months assessed was 17.17°C, while the minimum temperature of incoming raw bulk milk was 2.71°C (Table 3).
|
Parameter |
Maximum Temperature In °C |
Maximum Temperature Out °C |
Average Temperature In °C |
Average Temperature Out °C |
Average Cooling °C |
Minimum Temperature In °C |
Minimum Temperature Out °C |
|
MEAN |
10.35 |
7.92 |
6.18 |
4.74 |
-1.44 |
4.37 |
3.79 |
|
ST.DEV. |
2.84 |
3.08 |
1.54 |
0.77 |
1.34 |
1.45 |
0.74 |
|
MAX |
17.17 |
17.19 |
17.17 |
17.19 |
7.98 |
8.11 |
4.67 |
|
MIN |
4.88 |
4.47 |
2.71 |
3.21 |
-8.60 |
2.71 |
0.00 |
Table 3: Average temperatures across all intake bays.
*St. Dev = Standard deviation; Max = Maximum; Min = Minimum
Average temperatures of milk received across all three bays
Analysis of the data shows 1.58% (n = 67) milk intake loads demonstrated a temperature greater than 10°C (Figure 2 outlined in black bar), while 60.22% of milk intake loads (n = 2,551) were between 5°C and 7°C (Figure 2 outlined in clear bars). Although raw milk on farms should be stored at 6oC, if not collected daily, EU legislation (EU 2004) allows milk to be at 10oC on delivery to the milk processing plant. Nevertheless, the temperatures need to be monitored more closely and interventions undertaken to lower the temperature presenting at milk intake.
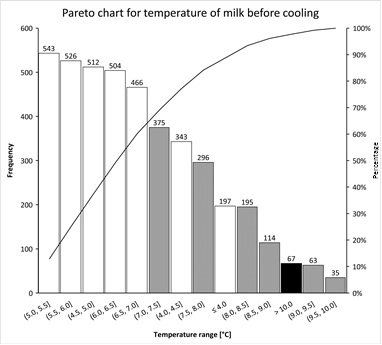 Figure 2: Average temperatures of milk received across all three bays.
Temperature of milk after cooling
Figure 3 shows 23 loads of milk exhibited a temperature greater than 10°C after cooling, while 49% of loads were chilled to between 4.5°C and 5°C (n = 2,086). Furthermore, analysis of the data shows 9.82% of milk intake loads were heated rather than cooled after pumping, i.e., 416 loads were heated by up to 1°C increments (Figure 4). While 31 loads were heated by more than 1°C increments (Figure 4).
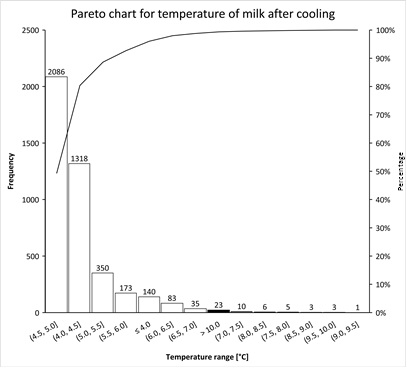 Figure 3: Average temperature of milk after cooling across all three bays.
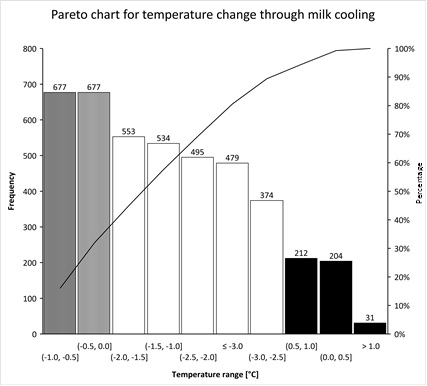 Figure 4: Average cooling capacity temperatures across all three bays.
Outside air temperatures
Finally, all temperature data were compared with local air temperatures recorded by a weather observing station located near the dairy plant (Met Éireann 2020), to determine whether statistical significance existed between the temperatures of milk and outside air temperatures for the period analysed. The findings showed that there were significant positive correlations between the temperatures of loads in, the temperatures of loads after cooling and the temperatures of outside air (Þ +0.299 and +0.036 respectively).
Discussion
The objective of this research was to evaluate the temperature of incoming raw bulk milk loads at one large dairy manufacturing site. Data were collected and collated for a three month peak season period (June, July and August 2018). Temperature records for 4,236 data points, across three milk intake bays were analysed. The aim was to trend temperature information and provides recommendations for optimisation at the milk intake step.
The effects of raw milk quality on processing capabilities and finished product quality have been widely researched [18-20]. The bacterial load prior to pasteurisation for example, affects the efficacy of pasteurisation [21]. With the temperature of raw milk being one of the biggest influencing factors on product quality [14], little research has focused on the impacts and benefits of temperature control of raw milk once it has reached the dairy processing plant. Legislative requirements are in place to regulate the collection and handling of raw milk from farm level to the processing plant. Therefore, it is in the interest of the processor to uphold the quality of raw milk once collected at the farm. Oftentimes however, particularly during peak season, temperature control may be diminished. Uncontrolled temperature variation , combined with inefficient CIP’s (cleaning in place programs) and non-optimal hygienic design of equipment, can lead to a larger energy demand including heat and water, required to sufficiently clean processing equipment and uphold the quality of product [22,23].
The first factor assessed was the pumping time per each load of milk. Pumping time of each lorry is an important parameter to the milk processor [13]. Results showed 50% of tanker loads took between 30 to 40 minutes to empty (Figure 1). While n=153 or just 3.6% of pumping events were less than 10 minutes and 10% (n = 438) under 20 minutes, demonstrating that significant improvements in collection schedules and time management can be achieved. A study carried out in Sri Lanka concluded that the time taken for the transportation and pumping of chilled milk from farm to processing plant was the biggest influencing factor in bacterial density of raw milk [21]. At the peak, route planning is particularly important. Not just in terms of maximising temperature control, but to allow for optimised processing schedules and to alleviate pumping bay congestion [13].
In terms of usage frequency of each intake bay, bay 2 displayed the highest rate of use (36%) while bay 1 displayed the lowest (28%) (Table 1). All pumps connect to one manifold, diverting through the same cooling system. Prolonged uneven usage of pumps puts pressure on equipment leading to faster depreciation. Interestingly, bay one displayed the greatest flow rate (Table 2) and cooling performance (Table 1) in comparison with the other two. Diverting higher temperature milk through bay one will evidently cool it more efficiently. The flow rates of each intake bay were also measured. Bay one displayed the greatest flow rate (46,743 L/h) in comparison with the other two bays. Bay three displayed the lowest flow rate (43,733 L/h) (Table 2). The flow rate of all intake bay stations were substantially lower than their optimal intake capacity (70,000 L/h), operating at 65% capability. With regards to temperature fluctuations, the flow rate decreases and product viscosity deviates as the temperature increases [24]. Furthermore, as viscosity changes the maximum concentration in downstream processes, including evaporation and drying, can become constrained [25].
The final parameter assessed was the temperature of incoming raw bulk milk across the three intake bays. Mean temperatures for the site upon intake and mean temperatures after pumping were also analysed. The average temperature of milk received across the site for the three months analysed was 6.18°C (SD1.54), while the average temperature for milk after being passed through the Plate Heat Exchangers (PHE) was 4.74°C (SD 0.77). The maximum temperature recorded for the three-month period was 17.17°C (Table 3). A total of 1.6% loads in were warmer than 10°C however, the majority of loads received were between 5°C and 7°C (Figure 2). Legislation states that once milk is received it must be cooled to and stored at 6°C or below until further processing. With an average site chilling performance of -1.44°C (SD 1.34), it is essential that stringent temperature parameters at intake are followed. Where chilling capacity is inefficient, milk must be processed as quickly as possible to uphold its quality. Milk processing plants capability to cool incoming raw milk is crucial to upholding quality. The most significant outcome of this investigation was the fact that some loads of milk (10.55%) had a greater temperature after being pumped through the PHE. There were 416 loads heated to less than 1°C increments while 31 loads were heated by >1°C increments (Figure 4). Of these loads, only 0.54% data points show a temperature >10°C, however it was recommended to the processing plant to carry out a full investigation on their pumps and PHE at each intake bay.
In addition to their required legislative monitoring of temperatures at holding silos, this study highlights the need for milk processors to monitor in real time, the incoming temperatures of raw bulk milk, as well as trending temperatures of PHE chilling performance.It also emphasises the importance of optimising chilling performance on site that will evidently improve milk handling, processing capabilities and finished product quality. Finally, this research underlines the importance of temperature management parameters and optimised equipment capabilities and the influence they can have on product quality.
Conclusion
This study quantitatively assessed the incoming raw milk temperatures and cooling performance across three milk intake bays at one dairy manufacturing site for a three-month period (June, July, August 2018). The outcomes of this study provided the dairy manufacturer with the capability to reassess their pumping schedules with regards to usage frequency on individual pumps to optimise both flow and chilling performance. This research should encourage any dairy manufacturer to investigate their onsite chilling performance and pumping frequencies at all intake bays.
Acknowledgements
This work was supported by the Irish State through funding from the Dairy Processing Technology Centre’s program - Grant Number TC/2014/0016. We wish to thank Donal O’Brien for his input in data gathering.
References
- EU (2004) EC 853/2004 EU Council Regulation (EEC) of 29 April 2004 Laying Down Specific Hygiene Rules for Food of Animal Origin, Official Journal of the European Union (No 853/2004).
- Machado SG, Baglinière F, Marchand S, Van Coillie E, Vanetti MC, et al. (2017) The biodiversity of the microbiota producing heat-resistant enzymes responsible for spoilage in processed bovine milk and dairy products. Front Microbiol 8: 302.
- Burke N, Zacharski KA, Southern M, Hogan P, Ryan MP, et al. (2018) The dairy industry: process, monitoring, standards, and quality. IntechOpen.
- Burke N, Zacharski K, Adley CC, Southern M (2020) A comparison of analytical test methods in dairy processing. Food Control 121: 107637
- Geary U, Lopez-Villalobos N, O’Brien B, Garrick DJ, Shalloo L (2013) Meta-analysis to investigate relationships between somatic cell count and raw milk composition, cheddar cheese processing characteristics and cheese composition. Irish Journal of Agricultural and Food Research 52: 119-133.
- Melini F, Melini V, Luziatelli F, Ruzzi M (2017) Raw and heat-treated milk: From public health risks to nutritional quality. Beverages 3: 54.
- Hill B, Smythe B, Lindsay D, Shepherd J (2012) Microbiology of raw milk in New Zealand. Int J Food Microbiol 157: 305-308.
- Marchand S, De Block J, De Jonghe V, Coorevits A, Heyndrickx M, et al. (2012) Biofilm formation in milk production and processing environments; influence on milk quality and safety. Comprehensive Reviews in Food Science and Food Safety 11: 133-147.
- Ostrov I, Paz T, Shemesh M (2019) Robust biofilm-forming Bacillus isolates from the dairy environment demonstrate an enhanced resistance to cleaning-in-place procedures. Foods 8: 134.
- Gillis W, Cartledge M, Rodriguez I, Suarez E (1985) Effect of raw milk quality on ultra-high temperature processed milk. J Dairy Sci 68: 2875-2879.
- O’Brien B (2016) Milk Quality Bacterial Contamination, Teagasc, chapter 32, pg no’s: 191-193.
- Paludetti LF, Kelly AL, O’Brien B, Jordan K, Gleeson D (2018) The effect of different precooling rates and cold storage on milk microbiological quality and composition. J Dairy Sci 101: 1921-1929.
- Eccher C, Geraghty J (2020) Incorporating sustainable criteria in a dynamic multi-objective recommendation planning tool for a continuous manufacturing process: A dairy case study. Journal of Manufacturing Systems 55: 159-170.
- O’Connell A, Ruegg P, Jordan K, O’Brien B, Gleeson D (2016) The effect of storage temperature and duration on the microbial quality of bulk tank milk. J Dairy Sci 99: 3367-3374.
- Zacharski KA, Burke N, Adley CC, Hogan P, Ryan A, et al. (2021) Milk reception in a time-efficient manner: a case from the dairy processing plant. Food Control: 107939.
- Wilkinson L (2006) Revising the Pareto chart. The American Statistician 60: 332-334.
- Cervone HF (2009) Applied digital library project management: using Pareto analysis to determine task importance rankings. OCLC Systems & Services 25: 76-81.
- Barbano D, Ma Y, Santos M (2006) Influence of raw milk quality on fluid milk shelf life. J Dairy Sci 89: E15-E19.
- De Silva S, Kanugala K, Weerakkody N (2016) Microbiological quality of raw milk and effect on quality by implementing good management practices. Procedia Food Science 6: 92-96.
- Murphy SC, Martin NH, Barbano DM, Wiedmann M (2016) Influence of raw milk quality on processed dairy products: How do raw milk quality test results relate to product quality and yield? J Dairy Sci 99: 10128-10149.
- Weerasinghe W, Hettiarachi S, Jayarathne M (2017) Factors affecting the quality of raw milk: effect of time taken for transportation and practices at field level in small farms in Sri Lanka. Research and Reviews: Journal of Food and Dairy Technology 5: 9-15.
- Moerman F, Rizoulières P, Majoor FA (2014) 10 - Cleaning in place (CIP) in food processing, in Lelieveld HLM, Holah JT and Napper D (eds), Hygiene in Food Processing (2nd Edn) Woodhead Publishing, pg no’s: 305-383.
- Fan M, Phinney DM, Heldman DR (2018) The impact of clean-in-place parameters on rinse water effectiveness and efficiency. Journal of Food Engineering 222: 276-283.
- Schlesser J, Stroup W, McKinstry J (1994) Volumetric flow rate comparisons for water and product on pasteurization systems. J Dairy Sci 77: 950-957.
- Morison KR, Phelan JP, Bloore CG (2013) Viscosity and non-Newtonian behaviour of concentrated milk and cream. International Journal of Food Properties 16: 882-894.
Citation: Burke N, Zacharski K, Adley CC, Southern M (2021) Evaluating the Temperature of Incoming Raw Milk at a Dairy Processing Plant. J Dairy Res Tech 3: 024.
Copyright: © 2021 Niamh Burke, et al. This is an open-access article distributed under the terms of the Creative Commons Attribution License, which permits unrestricted use, distribution, and reproduction in any medium, provided the original author and source are credited.