Feasibility of Manufacturing a Variety of Soft Cheeses from Milk Separated According to its On-Line Measure of Curd Firmness from Large Sized Commercial Dairy Farms
*Corresponding Author(s):
Gabriel LeitnerNational Mastitis Reference Center, Kimron Veterinary Institute, Israel
Email:leitnerg1@gmail.com
Abstract
The feasibility of on-line separation of high-clotting milk or low-clotting milk collected from large sized dairy herds was tested for yield by producing a variety of cheeses. Milk was collected by a large dairy plant and Cottage cheese (5% fat) or soft Israeli cheeses with various percent fats: 5% or 16% were produced. High significant differences (P<0.001) were found for fat, protein and curd firmness at 60 min in all the high-clotting milk and low significant differences (P<0.001) in the low-clotting milk for the same level of milk constituents. Significant differences were found between the different milk separation in the levels of protein, curd firmness at 60 min with or without added Ca, weight of curd and in the calculated protein efficiency. The results of this study indicated an increase in extra protein efficiency (yield) in the different cheeses produced, i.e., 5% Cottage cheese +11%, 5% soft cheese +14% and for 16% soft cheese +7.1%.
Keywords
Milk quality; Milk clotting parameters; Online measurement; Soft cheese yield
INTRODUCTION
The modern dairy industry produces a variety of products including drinking milk, fermented products and a large variety of cheeses. Thus, animal breed, nutrition and management do not focus on production of specific or product-designated milk, but rather on maximizing milk volume to maximize revenue in respect to existing payment schemes. The major responsible factors that affect low quality of cheese-milk is associated with tramammary infection with different bacteria species, post intramammary infection, days in milk, stage of lactation, i.e., late or early lactation and estrus [1-3]. However, other factors such as non coagulating milk were also associated with low quality milk for cheese making. It was reported that about 8% and 13% of Finnish Ayrshire cows produced non coagulating milk owing to various genetic traits [4,5]. Moreover, studies showed that about 8-9% of milk samples that did not coagulate and that 17-20% of the milk coagulated poorly due to κ-casein and β-lactoglobulin genotypes [6] and that 2% of Danish Holstein and 16% of Swedish Red cows were classified as producing non coagulating milk, which was due to various genotypes [7].
In recent years our team has introduced and presented experimental results on the potential on-line segregation of milk for cheese manufacturing according to its coagulation properties without any addition or alteration of the milk [8,9]. In a later publication, we have discussed the options of making cheese from milk separated in different ratios [10] and recently, we further presented the higher cheese yields obtained from separated milk and discussed the validation of van Slyke's yield equation for calculating cheese yield by the dairy industry [11].The main results have shown that the level of milk constituents changes throughout the milking session along with the milk's coagulation properties. Installing the on-line milk channeling system (Afimilk MCS, Afimilk, Afikim, Israel) enabled separation of milk according to its measured coagulation properties (Afi-CF) and made it possible to divert high-clotting milk into a designated tank and thus to increase cheese yield [10,11]. The Afmilk MCS system is installed in every stall in the milking parlor and segregates every 200 mL pull into high- or low-clotting milk with the cutoff level being decided according to the volume and products to be later produced by the dairy. The system relies on a set of two reception raw milk tanks that are fed by two separated milk lines [8,9]. Despite the need for higher volumes of water and additional labor to handle, clean and haul the milk of the AfiMilk MCS system, economical calculations performed, show a major saving in the total energy consumption owing to higher cheese yield [12].
The current work presents data that show the feasibility of manufacturing a variety of cheeses on a large scale from milk segregated for increased cheese yield. Since the process and yield data are the propriety of the dairy (which was not released to us), only the result of the skimmed milk cheese prepared according to the dairy manufacturing protocol and the protein efficiency for Cottage cheese (5%) or an Israeli variety of soft cheese with 5% or 16% percent fat are presented, in addition to results of cheese made from the same milk on a laboratory scale.
MATERIALS AND METHODS
Farms and milk collection
Study layout
Experiment 1
|
Target |
Separation (%) |
Batch |
Milk |
Fat |
Protein |
% Casein |
Lac. |
SCC |
RCT |
CF60 |
|
|
|
Calc. |
Actually |
(min) |
(V) |
|||||||
|
NSM |
100 |
100 |
686 |
22180±257 |
37.3±0.07B |
33.4±0.03B |
75±0.00 |
50.1±0.03 |
255±2.1 |
21.24±0.06 |
8.99±0.02 B |
|
HCM |
20 |
23±0.01 |
12 |
3996±441 |
51.0±0.33Aa |
35.10±0.08A |
75±0.00 |
50.1±0.09 |
296±21.8 |
20.72±0.29 |
15.54±0.06 Aa |
|
30 |
32±0.01 |
79 |
6928±234 |
49.2±0.26Aab |
35.16±0.09A |
74 |
50.04 |
262±6.3 |
20.70±0.16 |
10.49±0.10Ab |
|
|
40 |
40±0.00 |
254 |
9015±165 |
4 8.1±0. 13 Ab |
35.37±0.05A |
75±0.00 |
49.9±0.0 4 |
2 51± 3.3 |
21.17±0.08 |
10.91±0.5Ab |
|
|
50 |
49±0.00 |
211 |
10887±210 |
45.7±0. 15Ac |
34.73±0.06 A |
74±0.00 |
50.5±0.07 |
249±5.4 |
19.78±0.11 |
10.94±0.07Ab |
|
|
60 |
57±0.00 |
18 |
11323±340 |
44.7±0.4Ac |
35.31±0.18A |
74±0.00 |
50.8±0.17 |
212±12.0 |
20.34±0.11 |
10.72±0.26Ab |
|
|
LCM |
40 |
43±0.01 |
18 |
8492±210 |
28.4 ±0. 24Cc |
32.74±0.1C |
74±0.00 |
50.8±0.17 |
215±13.8 |
21.52±0.29 |
7.63±0.3C |
|
50 |
51±0.01 |
211 |
11324 |
28.4 |
32.23±0.05C |
74±0.00 |
50.64±0.07 |
239±4.3 |
20.97±0.12 |
7.82±0.06C |
|
|
60 |
60±0.00 |
254 |
13606±262 |
30 . 3 ±0. 11 Cb |
32.37±0.04C |
75±0.00 |
50.23±0.04 |
229± 3.3 |
22.19±0.10 |
7. 95±0.04 |
|
|
70 |
68±0.00 |
79 |
15290±600 |
31.4±0.18Cab |
32.23±0.07C |
74±0.00 |
50.48±0.08 |
244±3.7 |
21.41±0.18 |
7.90±0.07C |
|
|
80 |
77±0.01 |
12 |
15131±1194 |
31.4±0.21Cab |
32.06±0.07C |
74±0.00 |
50.74±0.06 |
238±10.5 |
20.71±0.42 |
7. 97±0.16C |
|
|
P [F] |
|
|
|
|
<0.0001 |
<0.0001 |
NS |
NS |
NS |
NS |
<0.0001 |
Parameters within column with no common superscript differ significantly.
Capital letters (A,B,C) are significant from NSM (P<0.001). Lower case letters (a,b.c) are significant among HCM or among LCM levels of separated milk (P<0.001).
Experiments 2 & 3
Cheese making at the laboratory (Laboratory cheese)
STATISTICAL ANALYSIS
A univariate model was designed with a logistic model statement using the MIXED procedure of SAS [14], with result outcome as the dependent variable. Three experiments were conducted. The first experiment was analyzed in four steps:
a) The independent variable MROUND levels of percent separation (20,30,40,50,60) was analyzed using data from HCM group (n=574) of milk type with the general form: dependent variable (fat, protein, lactose, SCC (x103, % casein (percent casein from protein), RCT, CF60)=Mround + error.
b) The independent variable Mround levels of percent separation (40,50,60,70&80) was analyzed using data from LCM group (n=574) of milk type with the same model as above.
c) The entire data set (n=686 + 574 +574) was analyzed for differences between milk type groups in all variables using the model described above. Two models were conducted: the 1st analyzed the differences for all variables using data from HCM and NSM group milk type and the 2nd analyzed the differences for all variables using data from LCM and NSM group milk type.
A second experiment analyzed the pasteurized skimmed milk prepared by the dairy for Cottage cheese (5%), in two steps:
A) The independent variable of percent on-line separation (30,40,50) was analyzed using data from HCM group milk type (n=120), with the general form: dependent variable of milk (fat, protein, lactose, SCC (x103), % casein, RCT, RCT+Ca, CF60, CF60+Ca, curd at 1h and curd at 24h (% moisture, dry matter (g)) or protein efficiency=levels of percent separation (30,40,50) + error.
B) The entire data set (n=208) was analyzed for differences between HCM and NSM, separately for 2013 and 2014, for all variables described in step A by using the model described in the first experiment.
The third experiment analyzed the pasteurized skimmed milk prepared by the dairy for each type of soft cheese with various percent fat; i.e., 5% or 16%. The dependent variable in pasteurized milk (fat, protein, lactose, SCC (x103), % casein, RCT, RCT+Ca, CF60, CF60+Ca, curd at 1h and curd at 24h (% moisture, dry matter (g)) and protein efficiency were analyzed for differences between HCM of percent separation(40) (5% fat, n=24; 16% fat, n=32) and NSM (5% fat, n=19; 16% fat, n=28) using the model described in the first experiment. Other parameters in the study such as farm and amount of milk in batch were found with no significant effect and thus removed from the final model. Results are presented as LSmeans + SEM. Protein efficiency was calculated as: (0.83 x % protein in milk)/(1-% dry matter)/100).
RESULTS
Experiment 1
|
|
|
NSM |
HCM |
||||
|
|
|
2013 |
2014 |
2013 |
2014 |
||
|
HCM target |
|
|
|
(30%) |
(40%) |
(50%) |
(50%) |
|
Batch (n) |
|
51 |
51 |
16 |
19 |
17 |
68 |
|
Pasteurized skim milk |
Fat (g/L) |
0.46±0.04 |
0.46±0.02 |
0.50±0.01 |
0.50±0.01 |
0.36±0.07 |
0.87±0.05 |
|
Protein (g/L) |
34.08±0.06B |
33.83±0.15D |
35.78±0.09A |
35.69±0.09A |
35.94±0.10A |
35.25±0.07C |
|
|
% casein |
76.5±0.06 |
75.7±0.12 |
76.0±0.04 |
76.9±0.14 |
76.4±0.09 |
76.0±0.07 |
|
|
Lactose (g/L) |
52.06±0.10 |
51.79±0.23 |
52.23±0.11 |
51.58±0.21 |
53.01±0.13 |
52.16±0.09 |
|
|
SCC (×103) |
119±2.1 |
122±5.4 |
98±12.0 |
121±7.5 |
118±6.4 |
12 6 ± 3.4 |
|
|
RCT (min) |
19.2±0.58 |
22.6±0.56 |
19.6±0.40 |
19.6±1.19 |
19.5±0.42 |
22.7±0.37 |
|
|
RCT+Ca (min) |
15.6±0.39 |
17.7±0.22 |
14.3±0.18 |
16.7±0.51 |
14.3±0.24 |
17.8±0.22 |
|
|
CF60 (V) |
5.73±0.14 |
5.50±0.17 |
5.79±0.18 |
6.31±0.31 |
6.08±0.16 |
5.78±0.12 |
|
|
CF60+Ca (V) |
5.94±0.07B |
6.18±0.16D |
6.53±0.15A |
6.50±0.19A |
6.87±0.02A |
6.48±0.22C |
|
|
Laboratory cheese |
1 h (g) |
113.35±0.98B |
117.57±0.92D |
119.58±1.06A |
1 19 . 02 ± 1 .81A |
121.41±2.08A |
124.13±0.98C |
|
24 h (g) |
105.75±0.71B |
110.49±0.59D |
110.62±1.21A |
110.74±1.52A |
113.84±0.99A |
116.66±0.97C |
|
|
Moisture (%) |
30.6±0.02 |
29.3±0.05 |
31.1±0.04 |
31.1±0.04 |
30.1±0.04 |
29.6±0.02 |
|
|
Dry matter (g) |
31.76±0.10 |
32.21±0.09 |
33.29±0.28A |
33.21±0.69A |
33.05±0.15A |
33.51±0.12C |
|
|
Protein efficiency |
4.10±0.00B |
3.99±0.00D |
4.29±0.00A+4.6% |
4.31±0.00A+5.1% |
4.27±0.00A +4.1% |
4.20±0.03C+5.2% |
|
|
Cottage cheese (5%) |
Delta protein efficiency |
Reference |
Reference |
+9.5% |
+12.5% |
+12.8.5% |
+9.3% |
Parameters within column with no common superscript differ significantly.
Capital letter (A, B 2013) and (C, D 2014) of HCM differ significantly (P<0.001) from NSM; Protein efficiency = (0.83*% protein in milk)/(1-% dry)/100.
|
Soft cheese |
|
5% fat |
16% fat |
||
|
|
|
NSM |
HCM (40%) |
NSM |
HCM (40%) |
|
Batch (n) |
|
19 |
24 |
28 |
32 |
|
Pasteurized |
Fat in (g/L) |
7.62±0.19 |
8.40±0.28 |
24.00±0.17 |
25.42±0.27 |
|
Protein (g/L) |
34.11±0.09B |
36.18±0.29A |
33.43±0.11D |
35.51±0.12C |
|
|
% casein |
75.9±0.10 |
75.9±0.10 |
74.6±0.14 |
74.8±0.14 |
|
|
Lactose (g/L) |
51.23±0.15 |
51.67±0.41 |
50.18±0.12 |
50.22±0.14 |
|
|
SCC (1000) |
77±6.2 |
79±3.6 |
71±1.9 |
84±4.5 |
|
|
RCT (min) |
24.8±0.44 |
23.5±0.47 |
24.2±0.45 |
24.0±0.37 |
|
|
RCT + Ca (min) |
17.7±0.21 |
17.1±0.32 |
17.3±0.20 |
17.3±0.15 |
|
|
CF60 (V) |
5.54±0.12B |
6.46±0.11A |
6.50±0.16D |
7.52±0.15C |
|
|
CF60 + Ca (V) |
7.63±0.08B |
8.64±0.08A |
8.79±0.11D |
10.26±0.13C |
|
|
Laboratory cheese
|
1 h (g) |
107.20±0.82B |
115.51±1.02A |
137.39±1.09D |
143.56± 1 .98C |
|
24 h (g) |
103.38±0.60B |
111.22±0.97A |
125.72±0.68D |
136.30±1.06C |
|
|
Moisture (%) |
37.6±0.03 |
36.5±0.04 |
42.8±0.02 |
41.8±0.06 |
|
|
Dry (g) |
37.51±0.20B |
40.17±0.36A |
53.02±0.29D |
56.04±0.40C |
|
|
Protein efficiency |
4.54±0.00B |
4.76±0.05A+4.9% |
4.86±0.00D |
5.10±0.00C+4.9% |
|
|
Soft cheese |
Delta protein efficiency |
Reference |
+14.1% |
Reference |
+7.1% |
Parameters within column with no common superscript differ significantly.
Capital letter (A, B 2013) and (C, D 2014) are significantly different (P<0.001) from NSM Protein efficiency = (0.83 x % protein in milk)/(1-% dry matter in cheese)/100.
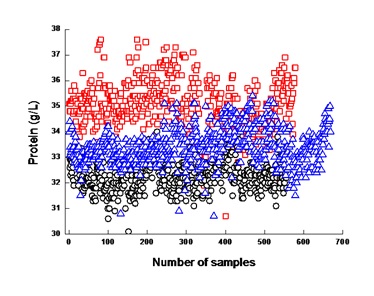 Figure 1: Distribution of the protein of the collected bulk milk according to Non-Separated Milk (NSM - Δ) and separated high- (HCM - ?) and low-clotting milk (LCM - O).
Experiment 2
Experiment 3
DISCUSSION
Raw milk is produced to fit average production schemes rather than to maximize a specific product, since milk is used for a variety of products with different protocols of industrial manufacturing. For example, high level of protein in drinking milk is redundant vs. low level of protein in milk for cheese making, which leads to low cheese yield. In modern intensive dairy farms, milk is produced economically when genetics and management maximize milk yield and sold milk volume. Nevertheless, genetic variability among cows, time in lactation, time of milking and milk flow during milking have a great influence on milk constituents. By installing the AfiMilk MCS system that enables separating milk according to its coagulation properties, it was possible to divert part of the milk into a designated tank and thus to increase cheese yield [10,11]. In the first experiment, the AfiMilk MCS system performed at a high efficacy in separating the milk to the pre-decided cutoff level. Unlike earlier results [11] no significant differences in all the parameters tested were found in HCM or LCM milk according to the separation level, except for CF60 in HCM20, which was significantly higher than other HCM levels. The difference was probably related to the number of AfiMilk MCS units, the environment and management differences among farms and time of milk collection during the two years. On the other hand, fat, protein and CF60 in all the HCM target tanks were significantly higher (P<0.001) than in NSM and in all the LCM target tanks these same parameters were significantly lower (P<0.001) than NSM. Other parameters such as % casein, lactose and SCC did not differ significantly from NSM, indicating that the separation is directly related to fat and protein levels but not to the milk quality, which is related to non- and low-clotting milk etc. [4-7]. Percent casein is the calculation of casein from total protein; therefore, higher protein with similar % casein means higher casein in HCM. Thus, as shown and discussed earlier [11], it is possible to increase dairy cheese production yield by utilizing the same animals and volume of milk for higher profitability. It could be visualized that by using milk channeling systems in large dairy herds for producing HCM and obtaining increased cheese yield per vat volume could result in reducing the number of cows in the herds for producing the same tonnage of cheese.
Many of hard and soft cheeses are prepared from pasteurized milk after skimming the milk to a desired degree of fat to protein ratio. Moreover, in many products, powdered milk or ultrafiltration retentatesare added in order to increase protein content, which results in added costs of concentration and drying [15,16]. Implementation of advanced technological systems, such as the AfiMilk MCS in milking parlors, modifies not only the on-farm management but mostly the procedures practiced by the cheese making plant. Using targeted HCM enables the dairy factory that produces traditional cheeses to skip the standardization of the production formula and only to reduce the fat level in the cheese milk. These modifications broad about ~44% saving of energy usage and ~69% of the carbon dioxide emissions [12].
Due to the limitations of dairy intellectual property, the results of Cottage cheese (5%) (2nd experiment) or soft cheeses with various percent fat: 5% or 16% (3rd experiment) are those to the laboratory tests, including laboratory cheese (48 h) produced from milk prepared by the dairy. The extra protein efficiency calculated by the dairy for the final products is also presented. In the second and third experiments, protein, CF60 and the weight of curd were significantly higher in all the HCM milk preparations for the three chesses. As a result, the calculation of the protein efficiency in the laboratory tests (+5%) as well as in the extra protein efficiency of the dairy final product was significantly higher (+7-12%). These results indicate that the potential benefit of the separated milk is manifested in a verity of products with different milk separation levels as was shown by Todde et al. [12].
CONCLUSION
The AfiMilk MCS system opens new avenues for cheese production plants. Despite the need of installing a second parallel milk line and an additional reception tank, the increased cost of milk hauling and milking parlor cleaning costs diminish when compared to the additional income from the increased cheese yield. As was summarized in regard to the whole scheme: “The implementation of PLF (Precision Livestock Farming) technologies increased energy requirement and carbon dioxide emissions in dairy farms and in the collection of milk, however, the large amount of energy saved in the cheese factory and the increase in cheese production yield make these technologies respectful to the natural resources and to the environment, avoiding about 2.65 MJ of primary energy for every 100 kg of processed milk” [12]. The essence of segregating milk on-line according to its composition and properties opens a new era of transition to dairy farms that produce high value-added product made of the same raw milk, while are also promising in the possibility of reducing the number of animals grown for the same cheese tonnage production.
REFERENCES
- Leitner G, Krifucks O, Merin U, Lavi Y, Silanikove N (2006) Interactions between bacteria type, proteolysis of casein and physico-chemical properties of bovine milk. Int Dairy J 16: 648-654.
- Leitner G, Merin U, Silanikove N (2011) Effects of glandular bacterial infection and stage of lactation on milk clotting parameters: Comparison among cows, goats and sheep. Int Dairy J 21: 279-285.
- Merin U, Fleminger G, Komanovsky J, Silanikove N, Bernstein S, et al. (2008) Subclinical udder infection with Streptococcus dysgalactiae impairs milk coagulation properties: The emerging role of proteose peptones. Dairy Sci Technol 88: 407-419.
- Ikonen T, Ahlfors K, Kempe R, Ojala M, Ruottinen O (1999) Genetic parameters for the milk coagulation properties and prevalence of noncoagulating milk in Finnish dairy cows. J Dairy Sci 82: 205-214.
- Ikonen T, Morri S, Tyrisevä AM, Ruottinen O, Ojala M (2004) Genetic and phenotypic correlations between milk coagulation properties, milk production traits, somatic cell count, casein content, and pH of milk. J Dairy Sci 87: 458-467.
- Kubarsepp I, Henno M, Viinalass H, Sabre D (2005) Effect of κ-casein and β-lactoglobulin genotypes on the milk rennet coagulation properties. Agron Res 3: 55-64.
- Poulsen NA, Bertelsen HP, Jensen HB, Gustavsson F, Glantz M, et al. (2013) The occurrence of noncoagulating milk and the association of bovine milk coagulation properties with genetic variants of the caseins in 3 Scandinavian dairy breeds. J Dairy Sci 96: 4830-4842.
- Leitner G, Lavi Y, Merin U, Lemberskiy-Kuzin L, Katz G (2011) Online evaluation of milk quality according to coagulation properties for its optimal distribution for industrial applications. J Dairy Sci 94: 2923-2932.
- Leitner G, Merin U, Lemberskiy-Kuzin L, Bezman D, Katz G (2012) Real-time visual/near-infrared analysis of milk-clotting parameters for industrial applications. Animal 6: 1170-1177.
- Leitner G, Merin U, Jacoby S, Bezman D, Lemberskiy-Kuzin L, et al. (2013) Real-time evaluation of milk quality as reflected by clotting parameters of individual cow's milk during the milking session, between day-to-day and during lactation. Animal 7: 1551-1558.
- Katz G, Merin U, Bezman D, Lavie S, Lemberskiy-Kuzin L, et al. (2016) Real-time evaluation of individual cow milk for higher cheese-milk quality with increased cheese yield. J Dairy Sci 99: 4178-4187.
- Todde G, Caria M, Gambella F, Pazzona A (2017) Energy and carbon impact of precision livestock farming technologies implementation in the milk chain: From dairy farm to cheese factory. Agriculture 7: 1-11.
- Marshall RT (1992) Standard Methods for the Examination of Dairy Products. 16th edn. American Public Health Association, Washington, USA.
- SAS Institute (2008) SAS/STAT® 9.1 User’s Guide. SAS publishing, Cary, North Carolina, USA.
- Cheryan M (1998) Ultrafiltration and Microfiltration Handbook. CRC Press, Pg no: 552.
- Beckman SL, Barbano DM (2013) Effect of microfiltration concentration factor on serum protein removal from skim milk using spiral-wound polymeric membranes. J Dairy Sci 96: 6199-6212.
Citation: Lemberskiy-Kuzin L, Bezman D, Katz Gil, Merin U, Leitner G (2019) Feasibility of Manufacturing a Variety of Soft Cheeses from Milk Separated According to its On-Line Measure of Curd Firmness from Large Sized Commercial Dairy Farms. J Dairy Res Tech 2: 005.
Copyright: © 2019 Liubov Lemberskiy-Kuzin, et al. This is an open-access article distributed under the terms of the Creative Commons Attribution License, which permits unrestricted use, distribution, and reproduction in any medium, provided the original author and source are credited.