Flavonoid-Rich Secondary Metabolites in Naturally Grown Green Tea are Correlated with a Higher Shift of the Consumers' Excise Level
*Corresponding Author(s):
Masatoshi FunabashiSony Computer Science Laboratories, Inc., 3-14-13 Higashi-Gotanda, Shinagawa-Ku, Tokyo, Japan
Tel:+81 354484380,
Email:masa_funabashi@csl.sony.co.jp
Abstract
Culture condition of crops affects the metabolites of products and consequently, consumers' metabolism. We investigate the metabolic difference of conventional and naturally grown coarse green tea (Bancha) in correspondence to physical activity that was induced among consumers. As a result, only naturally grown Bancha tea was observed to significantly increase the consumers’ locomotive energy expenditure with a counter decrease in household activities, resulting in a higher shift of exercise level. The conventional product showed the opposite tendency but was not statistically significant. In terms of metabolite categories that distinguished between the culture conditions, conventional tea was observed to express higher primary metabolites such as amino acid, while naturally grown tea contained a superior dose of secondary metabolites, especially flavonoid. No significant correlation could be found on caffeine and catechin contents with respect to physical activity responses. The occurrence of intrinsic compounds in each culture condition was weaker than the quantitative features of common compounds in explaining the difference. Statistically significant invariant features of culture conditions were found both in 1. expression patterns and 2. intensity of distinctive common compounds considerably overlapping with drug categories. These effects on human physical activities could be interpreted as 1. combined and 2. dose effect of environmentally responsive phytochemicals, respectively, ranging widely over basic metabolic pathways and secondary metabolite biosynthesis.
Keywords
Conventional and naturally grown culture condition; Flavonoid; Coarse green tea (Bancha); Metabolome analysis; Physical activity; Secondary metabolite; Sustainable diet
CHEMICAL COMPOUNDS STUDIED IN THIS ARTICLE
Caffeine, (+)-Catechin, (-)-Epicatechin, (-)-Epigallocatechin gallate, (-)-Gallocatechin gallate, (-)-Gallocatechin, (-)-Epigallocatechin, (-)-Epicatechin gallate, (-)-Epigallocatechin 3-(3''-O-methyl) gallate, flavonoid (PubChem CID: 2519, 9064, 72276, 65064, 199472, 9882981, 72277, 107905, 12097240 )
INTRODUCTION
Nutriology and food science have been developed in the study of deficiency. Early studies on malnutrition and deficiency diseases have led to the identification of major dietary constituents essential for maintaining the basic functioning of our metabolism [1]. Primary metabolites such as proteins, carbohydrates, lipids, vitamins and minerals were studied individually and in combinations, in order to reveal an optimum dose for health between deficiency and excess [2].
On the other hand, deficiency studies contain a fundamental limit in treating recently prevailing non-communicable diseases and those preventions [3,4]. Risk factors of chronic diseases stem widely not only from major components composition of foods but also those micronutrients, life patterns, physical inactivity, etc. Component-wise approach from nutrition has led to determine antioxidants that work against oxidative damage to cells and tissues, which presumably contribute to primary and secondary prevention of chronic diseases. However, recent large-scale clinical trials with antioxidant supplements concluded that there is no such evidence of prevention but rather a risk of mortality, especially in well-nourished population [5,6]. The complex pathogeneses of non-communicable diseases seem to require dietary intake of antioxidants with whole foods, not as supplements in pills or tablets [7,8]. High-risk populations of non-communicable diseases socially overlap with malnutrition, which also calls for food-system based approach for the amelioration [9].
Social-ecological environment, dietary pattern, metabolic state and lifestyle including exercise, are mutually interacting and form a global burden of non-communicable diseases. The food-system approach can involve relevant factors more comprehensively than the nutrition-based approach, especially in terms of micronutrients such as phytochemicals [10] and other significant factors such as the maintenance of gut microbiota. These long-term health protective factors also largely depend on the quality of surrounding ecosystems, especially biodiversity [11,12]. In contrast to the element-deficient type of disorders, chronic diseases correspond to system-dysfunction type, which requires an extensive food-system approach open to the interactive complexity of metabolism and ecosystem [13].
In defining a sustainable diet in terms of human and environmental health, the nutrition value and ecological impact should be linked with food-system approaches [14,15]. Crop culture condition is a decisive factor that impacts local biodiversity and affects the nutrient profile of crops. With this respect, our previous studies mainly focused on the difference of metabolite between conventional and naturally grown vegetables and other wild products, with the use of global database and field experiment [14,16]. Statistical invariant features of major components that distinguished culture conditions of products were discovered, between physiologically optimized monoculture and naturally grown mixed polyculture (or wild environment). Results on secondary metabolites such as phytochemicals also showed a partial increase in the natural environment [17,18].
In this article, we further extend the statistical invariance analysis to empirically measure metabolite of coarse green tea (Bancha) with different culture conditions, and relate the difference with the effect on physical activity of consumers and consequent energy expenditure that are part of risk factors of non-communicable diseases in short-term measurement [17,18]. Tea products are known to influence consumers’ metabolic state through the combined effect of various phytochemicals, such as caffeine, catechins and other flavonoids and widely consumed as a part of various food systems [7,19-23].
We seek statistically invariant features that distinguish between culture conditions [14], in water-soluble metabolite of Bancha tea with the use of metabolome analysis. We also investigate the physical activity of the Bancha tea consumers using portable activity meters to test the increase of energy expenditure for each culture condition. We then analyze and discuss which aspect of metabolic difference could find interpretation in a physiologically consistent way with the result of physical activity change.
RESULTS
Experiment A of human physical activity measurement
Valid data were obtained from 16 Japanese female adult subjects between 10 Feb - 22 Mar 2015. The IPG and CPG comprise 7 and 9 subjects, respectively. The subjects were distributed on age: 43.31±5.643, height: 158.4±4.541 cm and weight: 49.19±5.491 kg. The weekly regular life pattern assumption was only satisfied in IPG: Weekly means of estimated total calories of CPG population significantly fluctuated within 2 weeks of the control phase, showing more than 70% of p-value are biased under 20% significance with paired t-test on individual means. CPG was therefore omitted from further analysis. IPG population showed a stable weekly life pattern during the control phase without exceeding a 5% significance threshold. It also signifies that the residual effect of Syneco 2014 on physical activity, if there exists any, is not significant in a weekly scale.
In order to renormalize individual differences, we divided household, locomotive and total calories by the mean values of the intervention phase for each subject. We applied Box-Cox transformation (R software, version 3.1.2, “car” library) for the subsequent application of the t-test.
Table 1 shows the results of the difference between the renormalized household, locomotive and those total energy expenditure of IPG. Among household, locomotive and total calories consumption, only locomotive calories of intervention phase were 5% significantly higher than that of the control phase in IPG (p=0.0429, one-sided paired t-test on individual means). Household calories tended to decrease (p=0.0723) during the intervention, which sums up to an insignificant increase in total calories of physical activity (p=0.2769).
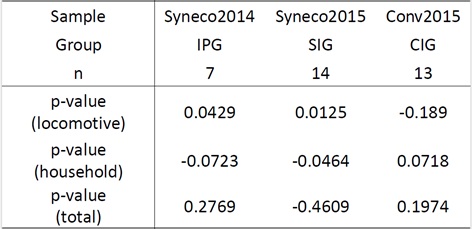
Table 1: Results of human physical activity measurement in response to green course tea (Bancha) intake. Sample name and experiment group, subjects number n and p-value of one-sided paired t-test of locomotive, household, and total (household and locomotive) calorie consumption between intervention phase (I) and control phase (C) are listed. Positive and negative signs of p-values represent magnitude relation of mean energy expenditure between experimental phases, I>C and I<C, respectively. Daily data are available in the supplementary data 1.
Experiment B of human physical activity measurement
Valid data were obtained from 27 Japanese female adult subjects between 17 Jan - 1 Apr 2016. The CIG and SIG comprise 13 and 14 subjects, respectively. The subjects were distributed on age: 45.778±6.86, height: 157.91±3.92 cm and weight: 51.159±6.82 kg. C1 and C2 means of estimated total energy expenditure did not differ significantly in both CIG and SIG (p=0.438 and 0.581, respectively, with two-sided paired t-test on individual means), assuring the following analysis under regular life pattern assumption.
Table 1 shows the results of the estimated household, locomotive and those total energy expenditure of CIG and SIG. We analyzed the difference between the intervention and control phases with renormalized daily mean calorie consumption, with respect to the mean values of the control C1 phase for each subject. Box-Cox transformation was applied for t-test, in the same manner as in experiment A. 5% significant increase of locomotive activity was observed for SIG (p=0.0464, one-sided paired t-test on individual means), while that of CIG decreased with p=0.1890. In contrast, household activity significantly decreased in SIG (p=0.0125) and tended to increase in CIG (p=0.0718), resulting in an insignificant change in total activities.
In total, the in natura samples Syneco 2014 and 2015 showed 5-1% significant increases in estimated locomotive energy expenditure at the group population level compared to the control periods, associated with a counter decrease of household activities of 7-5% significance, respectively. These changes can be summarized as a compositional shift of activity from household to locomotive activity, toward higher exercise level [18]. This tendency was inversed with the in cultura sample Conv 2015 but remained above 5% significance.
Intrinsic and common compounds between samples in Bancha metabolome analysis
For three samples, Syneco 2014, Syneco 2015 and Conv 2015, in total 1044 MS peaks were detected to which 633 chemical formulae were assigned. Intrinsic component peaks were discovered for each sample, 183 for Syneco 2014, 151 for Syneco 2015 and 157 for Conv 2015. Common compound peaks were classified as 215 between Syneco 2014 and Syneco 2015, 219 between Syneco 2014 and Conv 2015, 212 between Syneco 2015 and Conv 2015 and 166 for all three samples. The three samples were distinct in terms of component diversity, which gave clear separation in 2-dimensional principal components analysis (results not shown).
Category-wise correlation analysis T1 of Bancha metabolome
Tables 2 and 3 show the results of the qualitative correlation test T1. In total, six categories from the KEGG PATHWAY database and 20 categories from the KEGG BRITE database were detected that distinguished between the in natura and in cultura samples. These categories mainly range over pathways of metabolism and synthesis of secondary metabolite (Table 2) and contain a wide range of drug compounds expressed as phytochemicals (Table 3).
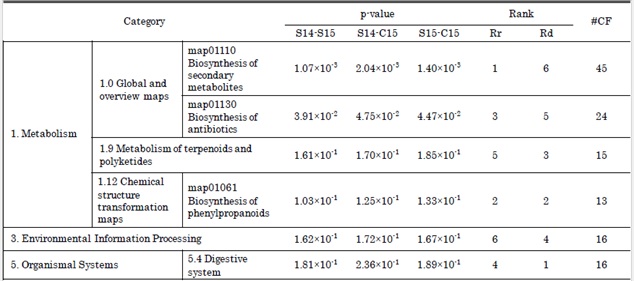
Table 2: Results of qualitative correlation test T1 with the categorization of chemical formulae based on KEGG PATHWAY database. Categories that distinguished between in natura/cultura samples are listed. The name and hierarchy of categories as well as the classification of chemical formulae follow the notation of KEGG. S14, C15, S15 represents the samples Syneco 2014, Conv 2015 and Syneco 2015, respectively (same in Tables 3-5). Category-wise p-values between the samples are listed with its ranks by mean difference and by mean ratio , associated with the number of different chemical formulae #CF matched in each category. Supplementary material 3 shows graphical representation of this table.
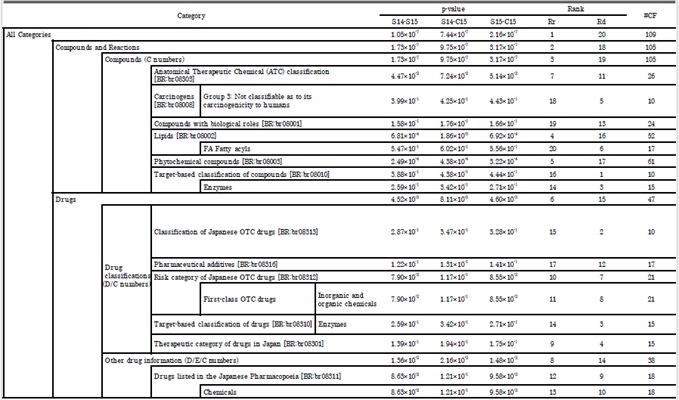
Table 3: Results of qualitative correlation test T1 with the categorization of chemical formulae based on KEGG BRITE database. Notations follow those of Table 2. Supplementary material 4 shows graphical representation of this table.
Category-wise correlation analysis T2 of Bancha metabolome
Tables 4 and 5 show the results of the quantitative correlation test T2. In total, 24 categories from the KEGG PATHWAY database and 27 categories from the KEGG BRITE database were detected that distinguished between in natura and in cultura samples. These categories mainly overlap with pathways of basic metabolism, biosynthesis of secondary metabolite and also include pathways involved in cancers and diseases (Table 4). In terms of physiological function, drug compounds are dominant over a wide range of the BRITE hierarchy (Table 5).
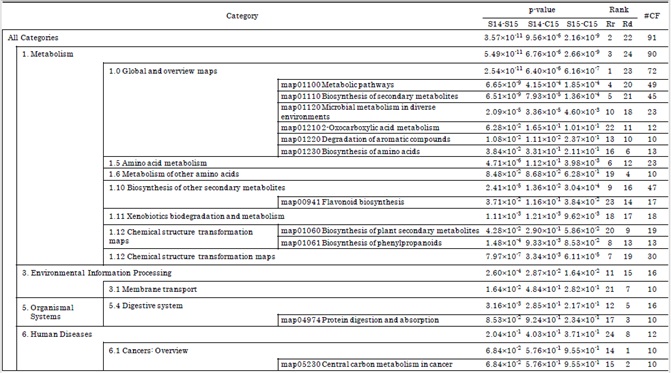
Table 4: Results of quantitative correlation test T2 with the categorization of chemical formulae based on KEGG PATHWAY database. Notations follow those of table 2. Supplementary material 5 shows graphical representation of this table.
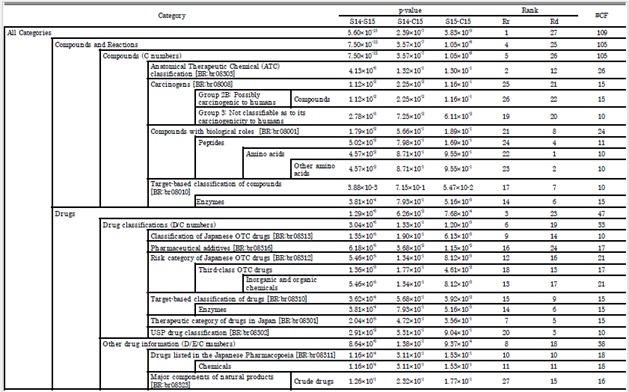
Table 5: Results of quantitative correlation test T2 with the categorization of chemical formulae based on KEGG BRITE database. Notations follow those of table 2. Supplementary material 6 shows graphical representation of this table.
In comparing the results of T1 and T2, the quantitative correlations detected a larger number of categories and compounds for the separation between the in natura and in cultura samples than qualitative ones. This means the correlational pattern within each category is more significant than the occurrence of intrinsic components in distinguishing between in natura/cultura samples. In natura samples were distinct from in cultura one with respect to the expression pattern of metabolite, more than the expression of particular compounds.
DISCUSSION
The possible link between metabolite category-wise correlation and locomotive activity increase
Distinctive features between in natura/cultura Bancha tea samples were detected both in consumers’ physical activity and category-wise metabolite expression patterns. These two, however, cannot be linked a priori since the former represents the net physical effect expressed as energy expenditure, while the latter only indicates a possible list of known physiological pathways and functions of estimated metabolites. It is still an independent question whether these features exert some significant effect in actual subjects' metabolism.
Meanwhile, seeking correspondence between these common distinctive features at different levels can lead to the construction of the working hypothesis that integrates the physiological process and net physical effect of in natura/cultura diets. In order to characterize which aspect of metabolome analysis could provide a causal explanation on physical activity change, we further examined the major classes of compounds that were reported to affect physical activity and its relevant features such as weight loss.
Analysis of caffeine, catechin and catechin gallate
Caffeine has been widely studied as the compound that reproducibly affects human physical activity through the activation of the sympathetic nerve, which leads to an increase of metabolic rate, energy expenditure and thermogenesis. Catechins are also important bioactive compounds in various tea products, which enhance and complement the functioning of caffeine, providing a significant increase in fat oxidization that could contribute to bodyweight control [20,21,24]. In order to examine the effect of caffeine and catechins as causal factors of the observed locomotive activity increase in in natura Bancha tea, we identified these compounds in the metabolome data with the use of authentic samples (see supplementary material 7). Purified standards of caffeine and catechins were analyzed with the same LC-MS method and matched with the data of Bancha tea samples.
The result is shown in figure 1(a). The amount of caffeine represented as the peak intensity of MS is larger in Conv 2015 than in Syneco 2014 and 2015. This means that the increase of locomotive activity in Syneco 2014 and 2015 cannot be simply explained by the amount of caffeine contained in the samples. Besides, the content of caffeine in green tea is generally below a significant dose (such as in coffee that could enhance human physical activity in a short time). The amount of catechins, on the other hand, shows different patterns among samples according to the difference of structural isomers and gallate. Although each compound possesses slightly different physiological functioning in metabolism, explicit peaks that distinctively separate between in natura/cultura samples could not be observed. The differences remain within the same order of intensity. In total, the increase of locomotive activity could not be explained by the amount and combination of caffeine and catechins, known as principal enhancers of energy expenditure in tea metabolite.
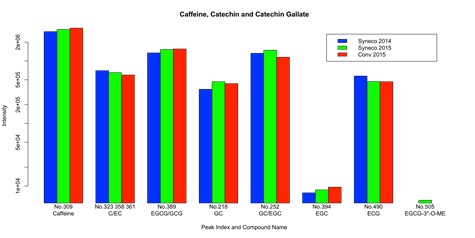
Figure 1(a): Content of caffeine, catechin and catechin gallate in Syneco 2014, Syneco 2015 and Conv 2015. The abbreviations of compound names represent C: (+)-Catechin, EC: (-)-Epicatechin, EGCG: (-)-Epigallocatechin gallate, GCG: (-)-Gallocatechin gallate, GC: (-)-Gallocatechin, EGC: (-)-Epigallocatechin, ECG: (-)-Epicatechin gallate, EGCG-3”-O-ME: (-)-Epigallocatechin 3-(3''-O-methyl) gallate, respectively. The compound peaks were identified with the use of authentic samples listed in supplementary material 7. Some of these peaks were overlapped and could not be separated due to the resolution of MS. “Intensity” and “No.” (ID number of peaks) are based on the raw LC-MS data available in the supplementary data 2.
Analysis of flavonoids
Catechins belong to a wider group of phytochemicals rich in tea product, flavonoids, which are known to affect energy expenditure such as thermogenesis and lipid metabolism in combination with caffeine, resulting in a positive effect on weight maintenance and change of energy metabolism [22,23,25,26]. In the quantitative correlation test T2, the category of flavonoid biosynthesis from the KEGG PATHWAY database is detected as a distinctive feature between the in natura/cultura samples in which 17 chemical formulae were classified (Table 4).
We referenced Flavonoid Viewer database [27], that registered 6850 entries of known flavonoid chemical formulae and accurate mass and matched with the metabolome database of Bancha samples. We further tried to identify the exact compound by referencing to the authentic samples (see supplementary material 7).
The results are shown in supplementary materials 8 and 9. In total, 37 peaks matched 33 authentic samples of flavonoid represented with 19 chemical formulae (the difference corresponds to the variation of structural isomers) and additional 36 peaks were judged to coincide with 24 known flavonoids in terms of estimated chemical formulae. More than a quarter of the estimated compounds in metabolite categories that distinguished between the in natura/cultura samples were matched as flavonoid, about 27%, 26%, 30% and 26% of compounds in tables 2-5, respectively.
Although the diversity of flavonoid was rich in these samples, the occurrence rate of intrinsic flavonoid peaks did not significantly differ between the in natura/cultura samples. Chi-squared test of goodness of fit between Conv 2015 and Syneco 2015 or 2014 remained above significant range.
In terms of expression ratio, the peak intensity of catechins dispersed among other flavonoids and these magnitude relations differed among Conv 2015, Syneco 2015 and 2014, which could not be determined as a distinguishing factor in flavonoid profile.
Meanwhile, the total expression of flavonoid tended to be higher in the in natura samples. Mean logarithmic intensity ratio of flavonoid peaks between in natura/cultura was greater than 0, reaching 0.5% significance level of one-sided t-test between Conv 2015 and mean of Syneco 2014 and 2015, as listed in supplementary materials 8 and 9. Total intensities of flavonoid peaks between samples were depicted in figure 1(b), which showed a larger concentration than caffeine alone but remained in the same order.
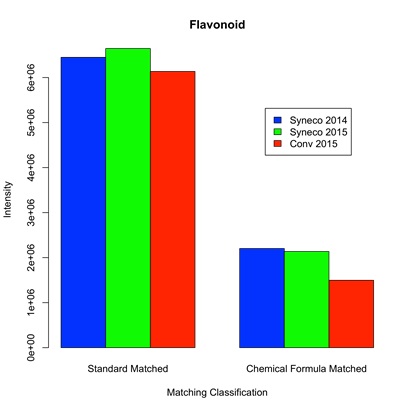
Figure 1(b): Total intensity of flavonoid compounds detected in Bancha tea samples. “Standard Matched” group represents the total intensity of flavonoid detected with authentic samples, as listed in supplementary material 8. While “Chemical Formula Matched” gather those of supplementary material 9. Intensity data are available in the supplementary data 2.
To the best of our knowledge, no report could be found on the significant effect on short-term energy expenditure by dietary intake of intrinsic flavonoid compounds found in the in natura samples (supplementary materials 8 and 9), especially when the content of associated caffeine is below the order of effective dose. Nevertheless, single flavonoid studies in vivo reported a short-term increase of improved metabolic and vascular function, greater endurance, in vitro muscle cell glucose uptake and improvement of mitochondrial function [28,29]. Flavan 3-ols that include catechins were studied with human cohorts and animal experiments in relation to energy expenditure [30]. Such evidence leads to a general assumption that combined effects of flavonoid could positively increase physical activity, albeit its composite mechanism and dose scale remain elusive.
In this study, the total intensity of in natura flavonoid expressions was estimated to be higher than the in cultura sample and make up more than a quarter of measured distinctive compounds. This result supports the hypothesis that in explaining the net physical activity change, the expression pattern and intensity of common compounds, especially flavonoid, could be more significant than the occurrence of intrinsic compounds itself. The only example of the in natura intrinsic compounds that could be consistent with exercise level increase is naringenin-7-O-glucoside (peak no. 460 in supplementary material 8), whose decomposition may generate naringenin known as in vitro AMPK-dependent enhancer of skeletal muscle activity [29].
Analysis of category-wise MS peak intensity
We further extended the analysis of intrinsic compounds diversity versus expression pattern and intensity of common compounds between the in natura/cultura samples, up to the comprehensive comparison of all distinctive metabolite categories. For each category that separated between the in natura/cultura samples, the logarithmic intensity ratio of each composing peak was calculated as log (Syneco 2014 & 2015 mean Intensity / Conv 2015 Intensity). Category-wise mean values of this quantity represent the relative ratio of expression that compares which of the in natura/cultura samples contains a superior concentration of compounds. This formula cancels out the dose order difference among components and introduces asymptotic normality to the resulting distribution that makes it accessible to the t-test. Percentages of the intrinsic compounds in each category were also counted for both in natura/cultura samples, to test the difference of those mean values statistically.
The results are shown in supplementary materials 10 and 11. The ratio of the intrinsic compounds between in natura/cultura samples did not differ significantly. In terms of the common compounds, the in natura samples expressed significantly higher concentration of drug compounds that coincided with biosynthetic pathways of secondary metabolite, especially those of flavonoid biosynthesis. The overall expression of distinctive compounds with respect to pathway categorization was higher with p=0.082 in the in natura samples (“All categories” in supplementary material 10). On the other hand, the in cultura sample was higher in amino acid and peptide contents, which were situated in the pathways of amino acid and protein digestion, also including cancer metabolism. In total, in cultura condition enhanced the expression of the primary metabolite, while in natura environment augmented secondary metabolite profile, along with distinctive patterns of expression.
The overall results indicated that the diversity of the intrinsic compounds could not be employed to explain the increase of exercise level with the in natura samples. Transversal analysis on the distinctive categories with respect to the correlation of expression patterns showed that the in natura and in cultura conditions significantly differed by the increased expression of secondary and primary metabolites, respectively.
Therefore, if there exists a physiological correspondence between the measured tea metabolite and consumers' physical activity, the remaining hypothesis could be reduced to the expression pattern and intensity of secondary metabolite with combined pharmacological functions.
Further consideration
Besides the physical activity, basal metabolic rate and thermic effect of food together form three principal components of energy expenditure in humans [31]. Especially higher exercise load is known to stimulate the thermic effect of food, which was not counted in total activity calories in this study [32]. The net energy expenditure of observed compositional shift from household to locomotive activity with the in natura samples should further incorporate such indirect effect as dietary-and activity-induced thermogenesis.
Although the change of basal metabolic rate was not measured in this study, dietary intake of flavonoids strongly suggested a positive effect on weight maintenance by ameliorating metabolic health other than physical activity [23,25,26]. Green tea is typically known to increase thermogenesis and fat oxidization through combined effect of caffeine and catechins, with which flavonoid are known to further facilitate energy metabolism as well as sports performance [22,33]. In accordance with these studies, the in natura samples showed increased expression of 90 compounds in basic metabolic pathways (p=0.082 with one-sided t-test in the category “1. Metabolism” in supplementary material 10, also see table 4 for the number of chemical formulae). Although the basic metabolic rate may differ among social profiles, little has been studied on the relation with the culture condition of food. Further analysis of basal metabolic rate and thermogenic effect may better characterize the difference of metabolic effects arising from in natura/cultura conditions.
Whether the expression pattern or intensity of distinctive compounds is another question to decipher the effect of in natura/cultura difference on physical activity. The former relates to the combined effect of phytochemicals whose distinctive features are ranked in tables 4 and 5, while the latter represents the dose effects whose differences are listed in supplementary materials 10 and 11.
For example, from the viewpoint of the KEGG PATHWAY database, compounds classified in "map00941 Flavonoid biosynthesis" is highly distinctive in terms of intensity (p=0.053 with one-sided t-test in supplementary material 10). At the same time, it contains only 17 chemical formulae and ranked 23rd with (Table 4). On the other hand, broader and complementary categories such as "1.10 Biosynthesis of other secondary metabolites", "1. Metabolism" and "map01110 Biosynthesis of secondary metabolites" also represent intensity-distinctive features and contain a larger number of chemicals and ranked at a higher place (p=0.004, 0.082, 0.104 with one-sided t-test in supplementary material 10, with 47, 90 and 45 chemical formulae and in Table 4, respectively). With respect to the KEGG BRITE database, these compounds are mostly overlapped with drug classifications. This implies that in interpreting the higher intensity of overall flavonoid in the in natura samples (Figure 1(b)), metabolic and physiological interpretation should take both combined and dose effects into account on a wider range of basic metabolic pathways and pharmacological functions than known flavonoid-relevant ones. In the food-system perspective, it should include those of indirect effects and digestion-absorption processes, such as gastrointestinal sensory nerve stimulation.
The discordance between the expression patterns and the intensity of in natura/cultura samples within distinctive categories may further shed light on the potential health effect of in natura Bancha tea. Green tea has been widely studied about its clinical and experimental effects on chronic diseases, such as cardiovascular and metabolic syndromes, along with those risk factors, typically obesity [25,26,33,34].These studies generally do not distinguish between tea culture conditions and principally rely on the conventional product in cultura. Major flavonoids are experimentally reported to lower body weight gain and ameliorate metabolic health independently from food regulation and physical activity [26,30], though the correspondence with the proposed multi-functional anti-obesity mechanism of green tea remains partial [23,33]. Suppose a higher profile of flavonoids in the in natura Bancha tea could result in better body weight maintenance and contribute to metabolic health other than the effect of exercise level increase. Then the analysis of combined and dose effects of distinctive compounds could be a comprehensive target to elucidate the systemic response of the metabolic state.
Additionally, cancer risk could be an important target in comparison to the in nautra/cultura conditions. Cancer metabolisms were classified as significant features that showed higher expression in the in cultura sample (supplementary material 10, "6.1 Cancers: Overview" and "map05230 Central carbon metabolism in cancer" showed a 5% significant increase on the in cultura sample with one-sided t-test). Since positive effects of green tea intake on DNA methylation status is clinically reported [35], the effect of in natura/cultura conditions on cancer metabolism could be a potential target to elucidate the diet-induced inhibitory mechanism of gastric cancer.
Clinical markers of those chronic diseases should further be studied with the distinction of in natura/cultura conditions, with an evaluation of combined and dose effects of distinctive metabolites. To tackle these questions, analysis of metabolome and consumers' energy expenditure is not sufficient. The current resolution of metabolomics is limited compared to the actual diversity of metabolite and its combined effect, both in spatial and temporal scales. We further need to measure the net metabolic response of consumers with the use of genomics in experimental conditions, as well as cohort analyses of clinical effect. Animal experiments could be useful in connecting the physical activity and tea metabolome with the measurement of DNA expression. Herbivory vertebrate Medaka fish (Oryzias latipes) could be an important experimental animal whose whole genome sequence is determined and behavior is used as biomarker [36]. In elucidating the combined and dose effect of flavonoid in tea extract, pathways of AMPK, SIRT1, PGC-α could be principal targets of investigation [28,30].
Connecting the ecological state of culture condition and health effect could be achievable with integrated biology, based on a food-system perspective that forms a central issue in defining and implementing sustainable diet [14,15].
MATERIALS AND METHODS
Coarse green tea (Bancha) samples preparation
All Bancha tea samples used in this study were produced by traditional tea farms at Watarai-Cho, Mie prefecture in Japan. Harvest and processing of Bancha tea leaves were homogenized with a conventional method: Second cropping (foliage lower than shoots) of the yearly first harvest during late Mai - early June 2014 and 2015, followed by standard processing of steaming, kneading, and drying in a local mechanized factory. Leaves from more than 7000? culture within 2km distance were blended for averaging plot-wise variation. It also allows comparing samples from different culture methods with a common geographical range.
Two culture conditions of tea were differentiated to examine the metabolomic difference of tea extract and its effect on human physical activity:
- Conventional monoculture condition following the standard protocol of Japan Agricultural Cooperatives Ise branch, with the routine application of inter-crop cultivation, synthetic and organic fertilizers, pesticides, fungicides and herbicides.
- Mixed polyculture condition without the application of tillage, fertilizer and chemicals, defined as synecoculture [16]. Intercropping with a variety of vegetables and fruit trees was introduced, along with the spontaneous generation of weeds [13].
The conventional condition is controlled in the physiological optimum range of production, while synecoculture is based on ecological optimum dominant in natural vegetation. These qualitatively different growing conditions are biologically termed as in cultura and in natura conditions of field culture, respectively, concerning the definition of sustainable diet [14].
Three samples of dried Bancha tea were produced, from the synecoculture fields in 2014 and 2015 and conventional tea culture in 2015. We hereafter call these samples as Syneco 2014, Syneco 2015, and Conv 2015, respectively.
Measurement of human physical activities
Triaxial accelerometer: Triaxial accelerometer Omron Active style Pro HJA-350IT [37], was used to measure human physical activities. The device was fixed to subjects’ waist and cumulative triaxial acceleration data were obtained with 1-min time interval. In order to avoid subjective bias, no information was shown on display during experiments.
Household and locomotive activities were distinguished according to a gravity-removal physical activity classification algorithm [18]. Physical activity intensities were expressed as Metabolic Equivalent (MET) with highly accurate validation for household and locomotive activities [17].
Data were extracted and analyzed with BI-LINK PROFESSIONAL EDITION Ver.1.0 [38], using subjects' parameters such as age, body height and weight, which derived estimation of calorie consumption with respect to individual base metabolism [31]. Household and locomotive calories were distinguished, which together combined as a total activity. In the case of METs less than one during 1hr, these were corrected to the mean basal metabolic rate 0.9 MET, according to a population analysis between 0.8-1.3 MET (data not shown).
During the following experiments A and B, only data of the days with more than 600min of the attached time were considered as valid measurements. Statistical analyses were performed for subjects with 4 or more valid days in each experimental phase to fulfill reliability condition [39].
Experiment A: We first tested with experiment A during Feb-Mar 2015 on the Japanese female adult population, whether drinking Syneco 2014 has significant effects on human physical activity. The experiment was divided into 2 phases, during these whole periods, the subjects attached the triaxial accelerometer whenever possible for the measurement of physical activity:
- Control phase: Subjects do not drink Syneco 2014 or other tea products from Synecoculture.
- Intervention phase: Subjects drink 3.0g of Syneco 2014 infused with 1l of boiled water per day.
These 2 phases were conducted based on the ordinary life pattern of the subjects, which was expected to be consistently reproducible on a weekly scale. Unusual traveling and diet during the experiment were avoided. Regular exercise activities were allowed and practiced in both phases.
The temporal order of the control and intervention phases was randomly assigned to each subject and formed two groups as follows:
- Control-Preceding Group (CPG): Two weeks of control phase precede one week of the intervention phase.
- Intervention-Preceding Group (IPG): One week of intervention phase precedes two weeks of control phase.
The length and order of these phases and groups were designed to test the regularity of life pattern and the amplitude and duration of the effect of Syneco 2014 on human physical activities.
Experiment B: Second experiment B was conducted during Feb-Mar 2016 on another Japanese female population with Syneco 2015 and Conv 2015. Three experimental phases are defined as follows:
- Control phase C1, C2: Subjects do not drink Bancha of any kind.
- Intervention phase IS: Subjects drink 3.0g of Syneco 2015 infused with 1l of boiled water per day.
- Intervention phase IC: Subjects drink 3.0g of Conv 2015 infused with 1l of boiled water per day.
The temporal order of the control and intervention phases was combined as follows into two groups, which were randomly assigned to each subject:
- Conventional Intervention Group (CIG): One week of control phase C1, followed by one week of intervention phase IC, followed by one week of control phase C2.
- Synecoculture Intervention Group (SIG): One week of control phase C1, followed by one week of intervention phase IS, followed by one week of control phase C2.
The distribution of tea samples was double-blinded. This experiment was designed to compare the effect of drinking Bancha on human physical activities between different culture conditions.
Metabolome analyses of Bancha tea
Metabolite Extraction: 3.0g of dried Bancha stuffed in teabag was boiled with 1l of ultrapure water (Milli-Q) at 90-93ºC for 10 min in a glass beaker and left at room temperature for 2hrs. Each set of 3 samples Syneco 2014, Syneco 2015 and Conv 2015 were extracted simultaneously. Three sets were used for the evaluation of extraction error (Evaluation of sampling and extraction error) and 1 set for metabolome analyses (Metabolome analyses, Evaluation of metabolome measurement error and Metabolome categorization).
Organic compounds were further extracted for the samples of metabolome analyses. Each 25ml sample was mixed with 75ml methanol and centrifuged with 10,000g, 10min, 4ºC. The supernatant was filtered with PTFE filter (Millipore, Cat.SLLGH04NK) and centrifuged through Monospin C18 spin columns with 5,000g, 2min, 4ºC, in order to remove insoluble matters and low polarity components. A mock sample of ultrapure water was prepared with the same procedure, which was used to evaluate and remove background noise contained in sample preparation and/or LC-MS analysis.
Evaluation of sampling and extraction error: Temporal variation of spectral absorption during the water extraction of 3 samples Syneco 2014, Syneco 2015 and Conv 2015 was measured using spectrophotometer HITACHI U-2010. For each sample, 150 of the extract was scanned over the 590-190nm range with 0.5nm interval and 400nm/min at each of 1, 2, 3, 4, 5, 6hr time-lapse from the start of extraction. These time scales are consistent with the experiments of human physical activity (Measurement of human physical activities). Three independent extractions were tested for each sample. Spectral absorption data were normalized by the maximum absorption intensity of all wavelength and samples to analyze the relative order of temporal variation.
After 2hrs of extraction, all samples showed steady spectral absorption patterns, which held the mean±standard deviation of specter-wise intensity difference within the order of 1/1,000 with respect to the maximum absorption intensity. Since UV spectral absorption refers to the amount of conjugated double bonds in organic compounds [40], its time variation gives a rate index of net temporal alteration of extracted components profile. Therefore, we expect that normalized extraction error that could be introduced in component-wise peaks remain within the order of 1/1,000, indicating 1/100 should be considered in discussing quantitative difference. The sampling difference also remained within the order of 1/1,000. These evaluations were used as a proxy of sampling and extraction error in the metabolome analyses (Evaluation of metabolome measurement error).
Metabolome analyses: LC-MS analysis was performed with a combination of Agilent 1200 series [41] and Thermo fisher scientific LTQ ORBITRAP XL [42]. The HPLC elution was monitored in the range of 190-950nm, followed by the MS/MS analysis of top 4ion intensity. The parameters of measurement are summarized in supplementary material 1.
After converting Xcalibur format raw data (obtained from LTQ ORBITRAP XL) to a text file with the use of Proteo Wizard [43], LC-MS data were analyzed using Power Get ver. 3.5.7 [44], with the following procedure to attribute MS peaks to chemical formula:
- Empirical detection of compound peaks, calculation of accurate mass, calculation of compound peak intensity.
- Differentiation of simultaneous elution peaks with respect to the profile of adduct ion peaks, ionization mode and natural 13C isotopic compound peaks.
- Matching between MS peaks and MS/MS data, calculation of 13C/12C isotope ratio with ion intensity in order to estimate C number in each compound and estimation of ionization mode.
- Aggregation and sorting of compound peaks with respect to the elution time, accurate mass and MS/MS patterns for all samples.
- Matching of calculated mean accurate mass with monoisotopic compounds in public database [45], with the use of MF Searcher [27] and derivation of corresponding chemical formula.
- Truncate the compound peaks with less than 2 times intensity of mock sample.
- The parameters of these analyses are summarized in supplementary material 2.
Evaluation of metabolome measurement error: Sorting of obtained compounds according to logarithmic intensity showed that the long-tail edge dropped at the order of 1/10,000 with respect to maximum intensity. This means that the peak detection is not valid below this threshold, and quantitative difference should be discussed only above the order of 1/1,000. Taken together with the extraction error (Evaluation of sampling and extraction error), quantitative comparison of obtained metabolite data should be performed with consideration of 1/100 error order with respect to maximum intensity peak.
Metabolome categorization: Obtained lists of chemical formula were referenced to KEGG (Kyoto Encyclopedia of Genes and Genomes) database [45], to annotate possible physiological functions. A program with python 2.7.6 [46], was used to mine the KEGG PATHWAY and BRITE database in order to categorize the compounds according to the functional classification of the databases. Each chemical formula was attributed to the hierarchical information of these databases including the possibility of structural isomer. This matching provided extensive interpretation of obtained metabolome data on known physiological structure and function.
Category-wise correlation analyses: A program with R 3.2.0 [47], was developed to perform correlation analyses of metabolome data. Metabolomes of 3 samples Syneco 2014, Syneco 2015 and Conv 2015 were analyzed for each attributed hierarchical category of KEGG PATHWAY and BRITE databases with the following 2 methods of correlation test:
T1: Category-wise test of non-correlations with binary occurrence data (Chi-squared test).
The intensity of each compound peak was transformed into binary data, occurrence or non-occurrence. Compounds with minimum intensity value were judged as non-occurrence, while other values above were classified as occurrence. The correlation degree of co-occurrence of the same compounds between the 3 samples in each KEGG category was measured using Kullbuck-Leibler divergence with respect to an independent distribution representing null hypothesis, which converges to Chi-squared test with degree of freedom 1 [48,49]. This test measures the degree of correlation interpreted as qualitative binary occurrence data without consideration on quantitative difference of intensity. For simplicity, we refer to this test as qualitative correlation test.
T2: Category-wise test of non-correlations with logarithmic intensity data.
Test of non-correlations on logarithmic intensity data between the 3 samples was performed using Pearson product-moment correlation coefficient for each KEGG category attributed to detected compounds. The logarithmic scale of intensity was taken to satisfy the normal distribution assumption of the test. This test was performed only if the intensity difference ranged over more than 1/100 of the maximum intensity, which corresponds to the order of measurement error (Evaluation of metabolome measurement error). For simplicity, we refer to this test as quantitative correlation test.
For all attributed KEGG PATHWAY and BRITE classification, categories that contained ten or more different chemical formulae were analyzed.
The results of T1 and T2 were analyzed with the distinction of in cultura sample Conv 2015 and in natura samples Syneco 2014 and 2015. KEGG categories that distinguish between in cultura and in natura conditions among the three samples were judged with the following condition using the p-values of these tests:
ps14 - s15 < ps14 - c15 and ps14 - s15 < ps15 - c15
Where ps14 - s15 represents the p-value between Syneco 2014 and Syneco 2015 of a given KEGG category, ps14 - c15 and ps15 - c15 are those between Syneco 2014, Conv 2015 and Syneco 2015, Conv 2015, respectively. This condition means that the in natura samples Syneco 2014 and Syneco 2015 are more positively correlated than with the in cultura sample Conv 2015 within a given KEGG category. Therefore, it represents more discrepancy between the in natura and in cultura samples than the variation inside of in natura condition.
The selected categories that distinguished between the in cultura and in natura samples were ranked in 2 different ways according to the p-values:

Where function returns the rank with respect to the magnitude of argument. All statistical analyses in this article were performed with the use of programming language R 3.2.0 [47], unless otherwise specified.
Data availability
Data of the consumers’ physical activity and metabolome analysis are available in supplementary data 1 and 2, respectively.
CONCLUSION
Naturally grown (in natura) coarse green tea (Bancha) consumption showed significant (p=0.0429 and 0.0125, n=7 and 14, experiment A and B, respectively) increase of locomotive motion and a relative decrease of household activity (p=0.0723 and 0.0464, respectively) in Japanese female subjects populations, implying a shift to higher exercise level. The conventional (in cultura) sample showed the opposite tendency but did not attain 5% significance. Total activity calories did not differ significantly in all populations.
Correlational analysis on Bancha tea metabolome revealed that in natura/cultura samples could be better distinguished with the correlation of expression patterns, rather than the profile of intrinsic compounds. The content of known bioactive compounds related to energy expenditure, such as caffeine and catechins, did not provide a causal explanation on the observed increase of locomotive motion.
Expression rate analysis of metabolome over the distinctive categories between the in natura/cultura samples showed that the intensity of compound peaks was higher in primary and secondary metabolites for in cultura and in natura samples, respectively. Especially the total expression of flavonoid contents was higher in the in natura samples that shared more than a quarter of distinctive compounds.
Taken together, statistically invariant distinctive features of Bancha tea metabolite between the in natura/cultura culture conditions could be characterized as the expression patterns and collective intensity of common compounds within distinctive categories of metabolites. These are in correlation with the compositional shift to higher exercise level of consumers' locomotive energy expenditure with the in natura samples. Distinctive expression patterns of compounds were distributed over a wide range of basic metabolic pathways, while intensity difference covered secondary metabolite biosynthesis and both considerably overlapped with drug components, which might express a whole-food effect on our metabolism that cannot be simply reduced to isolated components.
HIGHLIGHTS
- Naturally grown coarse green tea significantly increased consumers' exercise level.
- Conventional coarse green tea tended to lower consumers' exercise levels.
- Commonly detected compounds between natural and conventional culture conditions better distinguished those conditions than culture-specific compounds.
- Flavonoid expression patterns and intensity were a major difference between natural and conventional culture conditions.
- Distinctive compounds were mostly administered as a drug on basic and secondary metabolic pathways.
ACKNOWLEDGEMENT
Subjects for the measurement of human physical activities were recruited from Japan Anti-Aging Food Association. Activity meters were borrowed from Shigeho Tanaka at National Institute of Health and Nutrition, and Mirai Shirakawa kindly coordinated the distribution and recollection. Bancha samples were obtained from Sakura Shizenjyuku Inc. Metabolome was analyzed by Daisuke Nakajima at Kazusa DNA Research Institute. Tatsuya Kawaoka and Kazuhiro Takimoto contributed as research assistants.
CONTRIBUTION
Masatoshi Funabashi designed the experiment, conducted statistical analysis of the metabolome data and wrote the manuscript. Kousaku Ohta performed the evaluation of extraction error and statistical analysis of human physical activity.
COMPETING INTERESTS
The authors declare no conflict of interest.
FUNDING
This study was funded by Sony Computer Science Laboratories, Inc..
NO CLINICAL TRIAL
The Bancha tea samples are commercially available as ordinary food product from the producing farms. The subjects followed an ordinary dose of intake and carried the accelerometer in their daily life according to their own will to contribute to this study. The whole experiment does not use medicinal product and does not correspond to a clinical trial according to the research code of conduct and ethics of Sony Computer Science Laboratories, Inc.
REFERENCES
- Ross AC, Caballero B, Cousins RJ, Tucker KL, Ziegler TR (2012) Modern Nutrition in Health and Disease : Eleventh edition. Wolters Kluwer Health Adis (ESP).
- Beers MH, Berkow R (1999) The Merck Manual of Diagnosis and Therapy, Wiley, New Jersey, USA.
- WHO (2003) Diet, Nutrition and The Prevention of Chronic Disease. WHO, Geneva, Switzerland.
- Harvard School of Public Health (2011) The Global Burden of Non-communicable Diseases, A Report by the World Economic Forum and the Harvard School of Public Health.
- Bjelakovic G, Nikolova D,Gluud LL, Simonetti RG, Gluud C (2012) Antioxidant supplements for prevention of mortality in healthy participants and patients with various diseases. Cochrane Database Syst Rev14.
- Bjelakovic G, Nikolova D, Gluud C (2014) Antioxidant supplements and mortality. Curr Opin Clin Nutr Metab Care 17: 40-44.
- Rietveld A, Wiseman S (2003) Antioxidant effects of tea: Evidence from human clinical trials. J Nutr 133: 3285-3292.
- Liu RH (2003) Health benefits of fruit and vegetables are from additive and synergistic combinations of phytochemicals. Am J Clin Nutr 78: 517-520.
- FAO (2010) Biodiversity And Nutrition: A Common Path.
- Kant AK (2004) Dietary patterns and health outcomes. J Am Diet Assoc 104: 615-635.
- Smith MR, Singh GM, Mozaffarian D, Myers SS (2015) Effects of decreases of animal pollinators on human nutrition and global health: A modelling analysis. The Lancet 386: 1964-1972.
- Schnorr SL, Candela M, Rampelli S, Centanni M, Consolandi C, et al. (2014) Gut microbiome of the Hadza hunter-gatherers. Nat Commun 5: 3654.
- Funabashi M, Hanappe P, Isozaki T, Maes AM, Sasaki T, et al. (2015) Foundation of CS-DC e-laboratory: Open systems exploration for ecosystems leveraging. First Complex Systems Digital Campus World E-Conference 2015: 351-374.
- Funabashi M (2015) Food components as markers linking health and environment: Statistical invariance analysis of in natura diet. American Journal of Bioscience and Bioengineering 3: 183-196.
- Tilman D, Clark M (2014) Global diets link environmental sustainability and human health. Nature 515: 518-522.
- Funabashi M (2016) Synecological farming: Theoretical foundation on biodiversity responses of plant communities. Plant Biotechnol (Tokyo) 33: 213-234.
- Ohkawara K, Oshima Y, Hikihara Y, Ishikawa-Takata K, Tabata I, et al. (2011) Real-time estimation of daily physical activity intensity by a triaxial accelerometer and a gravity-removal classification algorithm. Br J Nutr 105: 1681-1691.
- Oshima Y, Kawaguchi K, Tanaka S, Ohkawara K, Hikihara Y, et al. (2010) Classifying household and locomotive activities using a triaxial accelerometer. Gait Posture 31: 370-374.
- Rumpler W, Seale J, Clevidence B, Judd J, Wiley E, et al. (2001) Oolong tea increases metabolic rate and fat oxidation in men. J Nutr 131: 2848-2852.
- Hursel R, Viechtbauer W, Dulloo AG, Tremblay A, Tappy L, et al. (2011) The effects of catechin rich teas and caffeine on energy expenditure and fat oxidation: A meta-analysis. Obes Rev 12: 573-581.
- Hursel R, Westerterp-Plantenga MS (2013) Catechin- and caffeine-rich teas for control of body weight in humans. Am J Clin Nutr 98: 1682-1693.
- Stohs SJ, Badmaev V (2016) A review of natural stimulant and non-stimulant thermogenic agents. Phytother Res 30: 732-740.
- Mohamed GA, Ibrahim SRM, Elkhayat ES, Salah El Dine R (2014) Natural anti-obesity agents. Bulletin of Faculty of Pharmacy, Cairo University 52: 269-284.
- Dulloo AG, Duret C, Rohrer D, Girardier L, Mensi N, et al. (1999) Efficacy of a green tea extract rich in catechin polyphenols and caffeine in increasing 24-h energy expenditure and fat oxidation in humans. Am J Clin Nutr 70: 1040-1045.
- Bertoia ML, Rimm EB, Mukamal KJ, Hu FB, Willett WC, et al. (2015) Dietary flavonoid intake and weight maintenance: Three prospective cohorts of 124 086 US men and women followed for up to 24 years. BMJ 352: 17.
- Hoek-van den Hil EF, van Schothorst EM, van der Stelt I, Swarts HJ, van Vliet M, et al. (2015) Direct comparison of metabolic health effects of the flavonoids quercetin, hesperetin, epicatechin, apigenin and anthocyanins in high-fat-diet-fed mice. Genes Nutr 10: 469.
- Sakurai N, Ara T, Kanaya S, Nakamura Y, Iijima Y, et al. (2013) An application of a relational database system for high-throughput prediction of elemental compositions from accurate mass values. Bioinformatics 29: 290-291.
- Price NL, Gomes AP, Ling AJ, Duarte FV, Martin-Montalvo, et al. (2012) SIRT1 is required for AMPK activation and the beneficial effects of resveratrol on mitochondrial function. Cell Metab 15: 675-690.
- Zygmunt K, Faubert B, MacNeil J, Tsiani E (2010) Naringenin, a citrus flavonoid, increases muscle cell glucose uptake via AMPK. Biochem Biophys Res Commun 398: 178-183.
- Osakabe N (2013) Flavan 3-ols improve metabolic syndrome risk factors: Evidence and mechanisms. J Clin Biochem Nutr 52: 186-192.
- Ganpule AA, Tanaka S, Ishikawa-Takata K, Tabata I (2007) Interindividual variability in sleeping metabolic rate in Japanese subjects. Eur J Clin Nutr 61: 1256-1261.
- Denzer CM, Young JC (2003) The effect of resistance exercise on the thermic effect of food. Int J Sport Nutr Exerc Metab.13: 396-402.
- Huang J, Wang Y, Xie Z, Zhou Y, Zhang Y, et al. (2014) The anti-obesity effects of green tea in human intervention and basic molecular studies. Eur J Clin Nutr 68: 1075-1087.
- Hodgson JM, Croft KD (2010) Tea flavonoids and cardiovascular health. Mol Aspects Med 31: 495-502.
- Yuasa Y, Nagasaki H, Akiyama Y, Hashimoto Y, Takizawa T, et al. (2009) DNA methylation status is inversely correlated with green tea intake and physical activity in gastric cancer patients. Int J Cancer 124: 2677-2682.
- Tsuboko S, Kimura T, Shinya M, Suehiro Y, Okuyama T, et al. (2014) Genetic control of startle behavior in medaka fish. PLoS One 9: 112527.
- OMRON (2014) High-precision research activity meter OMRON Active style Pro HJA-750C.
- OMRON (2008) OMRON Health Management Software BI-LINK Activity Volume PROFESSIONAL EDITION Ver1.0 HMS-HJA-IC01J.
- Trost SG, McIver KL, Pate RR (2005) Conducting accelerometer-based activity assessments in field-based research. Med Sci Sports Exerc 37: 531-543.
- Atkins P, de Paula J, Walters V (2006) Physical Chemistry (8th edn). Macmillan Higher Education, New York, USA.
- Agilent Technologies (2008) Agilent 1200 Series LC Systems and Modules.
- TFS (2007) LTQ Orbitrap XL™ Hybrid FT Mass Spectrometer: Unrivaled Performance and Flexibility. Mass Spectrometry.
- Kessner D, Chambers M, Burke R, Agus D, Mallick P (2008) ProteoWizard: Open source software for rapid proteomics tools development. Bioinformatics 24: 2534-2536.
- KOMICS (2005) Power Get 3.5.7 released.
- Kanehisa M, Goto S (2000) KEGG: Kyoto Encyclopedia of Genes and Genomes. Nucleic Acids Res 28: 27-30.
- Van Rossum G (2007) Python programming language. In USENIX Annual Technical Conference.
- R Core Team (2015) R: A language and environment for statistical computing. R Foundation for Statistical Computing, Vienna, Austria.
- Nakahara H, Amari S (2002) Information-geometric measure for neural spikes. Neural Comput 14: 2269-2316.
- Funabashi M (2014) Network decomposition and complexity measures: An information geometrical approach. Entropy 16: 4132-4167.
SUPPLEMENTARY INFORMATION
http://www.heraldopenaccess.us/fulltext/Food-Science-&-Nutrition/Supplementary_Material.docx
http://www.heraldopenaccess.us/fulltext/Food-Science-&-Nutrition/Supplementary_data_1_Human_Physical_Activity.xlsx
http://www.heraldopenaccess.us/fulltext/Food-Science-&-Nutrition/Supplementary_data_2_Bancha_metabolome.xlsx
Citation: Funabashi M, Ohta K (2020) Flavonoid-Rich Secondary Metabolites in Naturally Grown Green Tea are Correlated with a Higher Shift of the Consumers' Excise Level. J Food Sci Nutr 6: 063.
Copyright: © 2020 Masatoshi Funabashi, et al. This is an open-access article distributed under the terms of the Creative Commons Attribution License, which permits unrestricted use, distribution, and reproduction in any medium, provided the original author and source are credited.