Food and Nutrition Security Status of Households in Bungoma County Kenya
*Corresponding Author(s):
Wabwoba Mary StellaLicha Consultany, Bungoma, Kenya
Tel:+254 0715210135,
Email:stella@licha.co.ke / nekesamary5@gmail.com
Abstract
Food and nutrition security for every household is public concern throughout the globe. Food is a basic necessity of life as it dictates the health status of individuals. Documented evidence shows insufficient food stocks among households in Kenya. Available literature indicates that Bungoma County is food insecure with a poverty index of 52.9%. The objective of this study was to determine the food security and Nutrition status of households in Bungoma County. A cross-sectional survey design was used in the study and a cluster sample size of 384 households was selected. Tools used for data collection were questionnaires, interview guides, focus group discussions and observation checklists. The nutrition status of pre-school children was determined by measuring the Mid Upper Arm Circumference (MUAC) and Body Mass Index (BMI) tools were used to determine nutritional status for pre-school children and adults respectively. Data was analyzed using descriptive and inferential statistics. The Study revealed household’s food insecurity caused by insufficient knowledge and skills on balancing meals. Feeding priority was given to pre-school children than adults. Households experienced severest food shortage in the month of May. On food access, majority of the households consumed carbohydrates (ugali) daily while proteins were rare foods in most households. Adults were found to be malnourished while children under five years were well nourished. The study concluded that households in Bungoma County were food insecure and adults needed urgent nutritional intervention. Protein foods were luxury while carbohydrates was common for majority of the households. The study recommended that there should be long-term commitment to mainstreaming food security and nutrition in public policies and programs. Households should be sensitized and trained on how to balance diets for family members especially the adults.
Keywords
Adults; Household food insecurity; Nutritional status; Pre-school children
Introduction
Food is a basic necessity of life. It is a basic means of sustenance and key for healthy and productive life. According to the food situation reports dating way back 2011, records show insufficient food stocks among households in Kenya [1]. Available literature indicates that Bungoma County is food insecure and also records a poverty index of 52.9% compared to the National index of 46%, while the food poverty stands at 43% [2]. Households in Bungoma County are food insecure as many families take one meal a day, in contrast to the recommended three meals per day [3,4]. The importance of food is shown in the fact that it accounts for substantial part of a household budget while at a national level food is of economic and political significance especially in issues relating to national security, maintaining political stability and ensuring peace and stability among the populace. It is therefore important to continuously audit levels of household food nutrition in order to establish its status and put strategic preventive measures in place. If Kenya is to continue to cut down on health costs and compete in a global economy, it should ensure adequate food and nutrition security within households. Therefore, it is arguable that findings of this study with a focus on Bungoma County will inform similar studies in other areas. The recommendations from this study may guide Bungoma county government to put in place mechanisms that address the problem of food and nutritional insecurity among households in the county.
Research Methods And Design
This study was done in four sub-counties of Bungoma County:-Bumula, Bungoma West, Mt. Elgon and Bungoma North (Figure 1). The study adopted a descriptive survey research design where land size, incomes, types of crops grown, yield of crops, food utilization (BMI and MUAC measure), were variables observed. A cluster (multistage random) sample size of 384 respondents from households was selected. Within the same household, a BMI for adults and MUAC (children under five years) measure was taken, this was used as proxy indicator for food security in question. Key informants were purposively sampled from NGOs, FBOs, GOK departments and financial institutions.
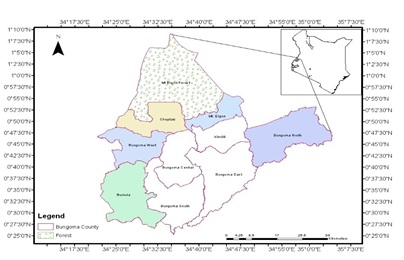 Figure 1: Amap of Bungoma County, Kenya.
Results And Discussion
Causes of food insecurity
Food security exists when all people at all times have physical, social and economic access to sufficient, safe and nutritious food to meet their dietary needs and food preferences for an active and healthy life [5]. The factors cited by household heads as common causes of food shortage in the county were: high cost of farm inputs, agricultural production being subsistent with little diversification, lack of organized marketing systems, thereby making them less competitive, insufficient knowledge and skills on modern technology on food production and insufficient storage facilities for farm produce. Factors highlighted during Focus Group Discussions included; negative attitude by the youth who view agriculture as dirty and unattractive, so they preferred white-collar jobs. They also cited lack of visionary leadership and entrepreneurial spirit to convert the factors of production into income. Key informants had a different view, they saw enough labor, people with knowledge about food production, two planting season as a result of favorable weather and fertile soils. This was expected to guarantee food security, but it was not the case here.
Food availability and Seasonality
Food availability: One of the key indicators of food security is the number of meals eaten per day by households over the years. The meals on average individual members ate on a normal day during the peak food availability season was three [3], for all the different ages groups and gender (adult male and female, youth and children below 18 years old). In the low food availability season the children ate three meals while the others ate two meals per day. In the last 12 months, 82.5% respondents reported to have had months in which they did not have enough food to meet the dietary needs. Among the male, female and youth headed households at least 83%, 85% and 79% of households did not have enough food to meet their households need in the year of study. This demanded targeted intervention for vulnerable groups within the county.
Food availability was also determined by main crops grown, acreage, yields and income earned. For each crop, they further ranked in terms of importance: 5-highest, 4-higher, 3-high, 2-low, 1-least. The crops grown included; maize, beans, bananas, potatoes, millet, cassava, sugarcane, local poultry and livestock. For every household, most of the land was predominantly maize and beans (northern zones), while sugarcane was grown in the lower zones. The average yield of maize per acre was 10 bags, beans 3 bags, millet 2 bags, sorghum 3 bags, and bananas (50 bunches). Every household had local poultry. On ranking the enterprise in terms of incomes earned to the household, maize ranked as the highest income earner. These findings agree with what Audsley et al., found in his study that farmers rely on incomes from sale of farm produce to purchase other household goods.
Seasonality in food supply: Seasonality in food production has an influence on food security. The results showed that there was one distinct peak of food deficit in the County: This occurs in April-June. The food deficit months need to be targeted in order to reduce food gap. In food deficit months, the female headed households seemed to fair better compare to the other months (September-December). Most of the households (70% for all) were food insecure in May. During this time of the year, FGD revealed that most of the farm produce would have been sold to purchase farm inputs. This finding is similar to what KARI found during household baseline survey done in Bungoma County [4].
Food access to households and utilization in Bungoma County
To determine the accessibility of food to the household, the household heads were asked to state how often they consumed; carbohydrates (cereals), proteins (Beef, chicken, fish, termite, milk, eggs, legumes) and vitamins (Fruits, vegetables) in a week. 50% of households consumed carbohydrates in form of ugali on daily basis, while 35% consumed proteins once a week. Fruits and vegetables were consumed by majority of the households on the daily basis, this is common because ugali is always accompanied with vegetables.
Chicken, eggs, milk and Ugali consumption
These are cheap and readily available types of foods which can be accessed by most households, so the respondents were asked to state the number of times in a week their family consumed them. This question also aimed at establishing whether households balanced their diets by consuming readily available proteins, carbohydrates and vitamins. The results showed that 55% household did not consume chicken in a week, 48% of the households did not consume eggs in the week, over 50% of the households did not easily access milk in their diet and Ugali was consumed on daily basis by 60% of the household. The study established that chicken in households were a delicacy so not easily consumed, milk was not available, eggs were sold to buy other items in the kitchen. Ugali is every household’s main food and this explained why every household planted maize. These findings also confirmed what key informants had revealed that households were food secure if maize was available. FGD also argued that a household head must always eat ugali for dinner to give him energy for work. Other foods like rice, potatoes, and bananas were considered a snack or food for children. These findings signify diet imbalance within households and it also agrees with what FAO (2013) estimated that over 800 million people do not meet their daily required energy needs from their diets. Millions suffer more acute malnutrition during transitory or seasonal food insecurity, and over 200million children suffer from protein energy malnutrition- PEM [6].
Nutritional status of pre-school children
This was done by taking MUAC measurements of the children under five years (Figure 2). The MUAC measure of less than 12.5 (Red color) mark indicates severe acute malnutrition, the measure ranging between 12.5 and 13.5 (Orange color) is considered moderate nutrition, whereas the measure above 13.5 (Green color) is mild or no malnutrition [7]. According to the results obtained, 8% of the children suffer from severe acute malnutrition, 29% moderately acute malnutrition while 63% mild or no malnutrition. Pearson Chi-square showed no significant (P<0.01) variation in nutritional status of under-fives in the study area. These results do not agree with the nutritional survey report done in Bungoma County, where 27% of the children under five were found to suffer from stunting, severe malnutrition and wasting [8]. Children are given priority when it comes to feeding, followed by the elderly. Hence they were well nourished compared to adults who take care of them.
 Figure 2: Taking MUAC Measurement for under five child.
Body Mass Index for Adults in Bungoma County, Kenya
A measure of nutritional status of the adult (≥18years) was assessed using the BMI measure tool. BMI is determined by dividing the weight in kilograms by the height in meter squared (Kg/M2). The findings showed that 56.25% were severely underweight, 16% underweight, 7% were overweight (obese) and only 17% normal. The Pearson chi-square ( showed a high significant (P>0.01) variation in the BMI of household heads. This clearly shows imbalance in nutrition and hence food insecurity in the County. The adults were poorly fed as indicated by severe underweight due to malnutrition.
The FGD pointed out that young adults just idle, do not work on the farm and majority engage in boda boda public transport business but do not spare time to eat, hence majority were found to be malnourished. This finding agreed with the study done by Muyesu [9], where he found that households did not access sufficient food in Bungoma County. This is in contrast to what was found in Kiambu where adult men were well nourished compared to women and children in the same household [10].
Conclusion and Recommendations
Households in Bungoma County were food insecure and adults needed urgent nutritional intervention. Protein foods were luxury while carbohydrates were staple food for majority of the households. Keeping food security and agriculture high on the development agenda, through comprehensive reforms, improvements in the investment climate, supported by sustained social protection, was crucial for achieving major reductions in poverty and undernourishment.
The study recommended that there should be long-term commitment to mainstreaming food security and nutrition in public policies and programs. Households should be sensitized and trained on the importance of balanced diets for family members especially the adults.
Acknowledgement
Many thanks to all those who supported this research in one way or another. Almighty God bless you all.
References
- GOK (2012) Agriculture Sector Development Support Programme, Project Document, Government Printers, Nairobi, Kenya.
- KNBS (2010) Kenya National Census report. Government Printers, Nairobi, Kenya.
- UNICEF (2009) Determinants of malnutrition in children: A conceptual Framework.
- KARI (2013) Ministry of Agriculture, Livestock and Fisheries and Agricultural Sector Development Strategy Programme (ASDSP), Household Baseline Survey, Bungoma, Government Printers, Nairobi, Kenya.
- WHO (2004) WHO and the Global Food Security Crisis: The Health and Nutrition. World Health Organization, Geneva,
- FAO (2013) Sustainable Food Systems for Food Security and Nutrition, WFD.
- WFP (2009) Comprehensive Food security and Vulnerability Analysis guidelines. World Food Programme, Rome, Italy.
- KDHS (2012) Kenya Demographic Health and Nutrition Survey report. Government printers, Nairobi Kenya.
- Muyesu (2013) The impact of Tobacco farming on Household food security in Bungoma County. Unpublished Masters Thesis at MMUST, Kenya.
- Wabwoba MS, Wakhungu JW (2013) Factors affecting sustainability of community food security projects in Kenya. Agriculture and food security 2: 9.
Citation: Stella WM (2021) Food and Nutrition Security Status of Households in Bungoma County Kenya. J Food Sci Nutr 7: 125.
Copyright: © 2021 Wabwoba Mary Stella, et al. This is an open-access article distributed under the terms of the Creative Commons Attribution License, which permits unrestricted use, distribution, and reproduction in any medium, provided the original author and source are credited.