High Protein Consumption with Controlled Phosphorus Level Increases Plasma Concentrations of Uremic Toxins in Cats with Early Chronic Kidney Disease
*Corresponding Author(s):
Eden EphraimPet Nutrition Center, Hill's Pet Nutrition, Topeka, United States
Tel:+1 7852868824,
Email:eden_ephraim_gebreselassie@hillspet.com
Abstract
Cats with Chronic Kidney Disease (CKD) have elevated concentration of uremic toxins that deteriorate kidney function. This study evaluated the effect of feeding CKD cats foods containing similar phosphorus concentrations but varying levels of protein on the plasma metabolome, blood and urine chemistry as well as body weight. After a 27 day washout period on a pretrial food, 23 CKD cats were randomly assigned to one of the 6 groups to receive 3 treatment foods, each for 111 days, in a sequence following the Williams Latin Square design. The treatment foods contained 36.8% (P37), 31.9% (P32) or 25.9% (P26) protein as fed, and had similar phosphorus levels. Average body weights and food intake were not different between treatments. Blood Urea Nitrogen (BUN), urine Protein to Creatinine Ratio (UPC), plasma concentrations of microbial uremic toxins such as 3-indoxyl sulfate and P-cresol sulfate increased with higher protein concentration in food. Plasma concentrations of gamma-tocopherol/beta-tocopherol, lactate and butyrylglycine decreased while branched-chain fatty acids (e.g. isovalerate) and methylated amino acids (e.g. N6-methyllysine) increased with P37 consumption. The results suggest that high protein foods may negatively affect the health of CKD cats even when they have controlled phosphorus level.
Keywords
Body weight; Cats; Chronic kidney disease; Phosphorus; Plasma metabolomics; Protein; P-cresol sulfate; Urine protein to creatinine ratio; Uremic toxins; 3-indoxyl sulfate
Introduction
In humans, restriction of protein has been one of the major strategies to slow the progression of CKD [1]. Protein restriction leads to the reduction of host metabolites, such as urea and creatinine that are associated with deteriorating kidney function [2]. High protein intake damages glomerular structure by inducing hyper-glomerular filtration to remove protein-derived nitrogenous waste products [3]. Protein restriction has also been linked to reduction of uremic toxins produced by the gut microbiome. The increased protein that reaches the colon provides proteolytic bacteria a competitive advantage over saccharolytic bacteria, which mainly utilize carbohydrates and fiber [4]. Similar observation of reduced saccharolytic bacteria has been reported in dogs even with the use of highly digestible protein, which could be due to the reduced carbohydrate inclusion when formulating a high protein pet food [5]. Microbial indolic (e.g. 3-indoxylsulfate) and phenolic (e.g. P-cresol sulfate) uremic toxins are the result of microbial fermentation of amino acids such as tryptophan, phenylalanine and tyrosine. Previous reports have shown the significant inverse correlations of concentration of such microbial uremic toxins with kidney function [6,7].
Cats with CKD have increased blood concentration of urea, creatinine, and microbial uremic toxins such as indole sulfates, which may be negatively affecting renal health [8]. In addition to several nutritional solutions targeting macronutrients, pH and fiber source, most feline foods designed to aid in the management of CKD are restricted in protein and phosphorus and some have been shown to reduce clinical signs of uremia [9-11] and prolong the lives of cats with CKD [12]. Protein restriction is usually associated with phosphorus restriction since many meat-based protein sources have high phosphorus content. CKD patients progressively lose the ability to excrete phosphorus leading to hyperphosphatemia, which is associated with kidney damage, inflammation and oxidative stress [13]. Independent of other nutritional factors, phosphorus restriction has been shown to delay progression of CKD both in cats and humans [14,15]. Dobenecker et al. [16], reported that cats fed a high phosphorus diet experienced glucosuria, microalbuminuria and decreased creatinine clearance confirming kidney damage associated with excess phosphorus intake. The use of inorganic phosphate as food additives and preservatives is linked to a higher negative health outcomes due to its high digestibility and bioavailability [17]. Overall, studies on humans and cats have shown the importance of restricting phosphorus intake to prevent adverse effects on kidney function [16,18]. However, there have been controversies regarding whether phosphorus restriction alone should be sufficient to delay the progression of CKD in humans [15] and in cats [12,19]. To our knowledge, there were no reports showing the effect of increasing protein on concentrations of uremic toxins in CKD cats while maintaining similar phosphorus concentration. We hypothesized that in CKD cats higher protein consumption increases the concentration of circulating uremic toxins despite similar phosphorus intake. The objective of this study was to evaluate the effect of feeding CKD cats foods containing varying protein but similar phosphorus concentrations, on body weight and blood levels of uremic toxins.
Methods
The study was approved by the Institutional Animal Care and Use Committee, Hill’s Pet Nutrition, Inc., Topeka, KS, USA (Permit Number: 790) and Animal Welfare Committee. All protocols in the study complied with the National Institute of Health Guide for the Care and Use of Laboratory Animals (NRC, 2011). Cats were individually housed with exposure to natural light. All cats had opportunities to exercise with access to indoor runs and toys. Cats were owned by the commercial funders of this research or their affiliates, who gave permission for them to be included in this study. All cats returned to the Hill’s Pet Nutrition, Inc. Colony at the end of the study.
Experimental foods
Proximate analysis of the dry test foods was conducted as previously described [8]. The study used a pre-trial food, a complete and balanced dry food designed to aid in the management of renal disease, and three test foods formulated to contain 36.77% (P37), 31.91% (P32) or 25.94% (P26) as fed protein. The phosphorus concentrations of all foods were maintained at approximately 0.5%. The foods also had similar ash, crude fat, crude fiber and moisture contents. Digestibilities of the foods were largely similar with protein digestibility ranging from 89.7 % to 94.0 % (Table 1). The main sources of protein in the foods were plant based corn gluten (20.9%, 17.2%, 14.8% in P37, P32 and P26, respectively), and animal based chicken, casein, poultry by-product meal and egg combined (34.1%, 28.0%, 20.7% in P37, P32 and P26, respectively). Equal amounts of corn starch and rice increased as the protein ingredients combined. Pork fat was used to offset the changing fat concentrations of the other ingredients. Dicalcium phosphate was used only in P32 (0.23 %) and P26 (0.74 %) to increase their phosphorus concentration to match the level in P37.
|
Proximate Analysis, % |
Protein Level |
||
|
P37 |
P32 |
P26 |
|
|
Moisture |
6.76 |
6.35 |
6.76 |
|
Ash |
4.54 |
4.31 |
4.45 |
|
Crude protein |
36.77 |
31.91 |
25.94 |
|
Crude Fat |
17.71 |
17.93 |
17.71 |
|
Crude Fiber |
1.3 |
1.3 |
1.2 |
|
Phosphorus |
0.51 |
0.48 |
0.52 |
|
Magnesium |
0.048 |
0.045 |
0.047 |
|
Calcium |
0.67 |
0.68 |
0.69 |
|
Calcium/Phosphorus ratio |
1.3 |
1.4 |
1.3 |
|
Arginine |
1.64 |
1.42 |
1.26 |
|
Histidine |
0.92 |
0.79 |
0.64 |
|
Isoleucine |
1.68 |
1.44 |
1.18 |
|
Leucine |
4.25 |
3.63 |
2.91 |
|
Lysine |
2.10 |
1.77 |
1.42 |
|
Methionine |
1.22 |
1.18 |
1.25 |
|
Phenylalanine |
1.96 |
1.69 |
1.37 |
|
Threonine |
1.48 |
1.28 |
0.99 |
|
Tryptophan |
0.4 |
0.34 |
0.26 |
|
Tyrosine |
1.56 |
1.33 |
0.96 |
|
Valine |
2.01 |
1.71 |
1.41 |
|
Digestibility |
|
|
|
|
Apparent dry matter digestibility, % |
91.9 |
89.7 |
90 |
|
Apparent protein digestibility, % |
94 |
89.7 |
90.9 |
|
Apparent fat digestibility, % |
95.2 |
91.8 |
94.9 |
|
Apparent carbohydrate digestibility, % |
94 |
95 |
92 |
|
Apparent energy digestibility, % |
93.53 |
91.26 |
92.34 |
|
Diet gross energy, kcal/kg |
5220 |
5220 |
5485 |
|
Food metabolic energy, kcal/kg |
4589 |
4539 |
4871 |
|
Nitrogen-free extract calories, % |
30.1 |
38.3 |
40.2 |
|
Protein calories, % |
34.2 |
26.9 |
23 |
|
Fat calories, % |
35.7 |
34.8 |
36.8 |
Table 1: Proximate food analysis (as fed) and digestibility.
Participants and experimental design
The study was conducted using a total of 22 domestic shorthair breed cats diagnosed with IRIS stage 1 (International Renal Interest Society stage 1) [20]. Of the 22 cats, 10 were spayed female and 12 were neutered male, ranging in age from 6 to 13 years. The average body weight of the cats was 6.1±1.1Kg. After a period of 27 days on a pre-trial food, a complete and balanced dry food designed to aid in the management of renal disease, cats were assigned into six subgroups to receive P37, P32, and P26, each for 111 days, in a Williams Latin Square design sequence (Figure 1). Total food intakes and body weights were monitored daily and weekly, respectively. Samples for blood chemistry, urinalysis, and plasma metabolomics were collected at the end of each treatment period. Cats were to be removed from the study if they develop any condition whereby removal would benefit the animal, including refusal to eat, or inadequate food intake resulting in weight loss of 15% of body weight. The average metabolic weight of cats after the consumption of each treatment food was reported as weight (Kg) to the power of 0.75. Blood samples were collected at the end of each treatment period to evaluate changes in serum biochemistry and plasma metabolites. Urine was collected by cystocentesis for routine urinalysis, and UPC was calculated by dividing the concentration of urine protein by that of urine creatinine.
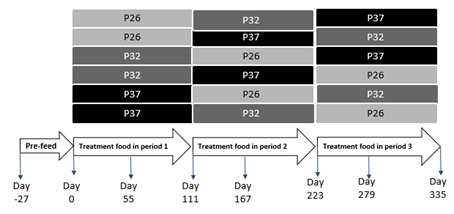 Figure 1: Williams Latin Square design in which CKD cats were assigned to 6 groups to receive P37, P32 and P26 in a particular sequence.
Blood and urine metabolites
Relative quantification of plasma metabolites was performed by a commercial laboratory (Metabolon, Morrisville, NC) as previously described [21]. Identification of hydrophilic and hydrophobic molecules was performed using the gas chromatography and liquid chromatography platforms, respectively. Mean units of metabolites including carbohydrates, amino acids, peptides, lipids, nucleotides, cofactors and vitamins, are represented as relative levels after scaling for a median of 1.
Blood chemistry and urinalysis were performed in serum and urine samples as described before [22]. Serum concentrations of creatinine, albumin, Blood Urea Nitrogen (BUN), total protein and phosphorus were measured. Urinalysis was conducted to determine urine pH, specific gravity, and concentrations of creatinine and total protein.
Statistical analysis
The JMP Pro software (JMP, Cary, NC, USA) was used to perform mixed model and Principal Components Analysis (PCA). Mixed model analysis was performed using treatment food as a main effect and animal identification as a random effect. Post hoc Tukey’s test was used to compare differences after cats consumed P26, P32 and P37. Plasma metabolomics data were rescaled to a median value of 1 and are presented as group mean and standard errors. The relative units of the metabolites were log transformed before statistical analyses was performed using ArraySudio (Omissoft Corporation, Cary NC). Means of the log transformed metabolites were compared between the treatments using a mixed model. In all analyses, statistical significance was considered as P≤0.05.
Results And Discussion
Body weight and daily intake
The average metabolic body weight was not statistically different when cats were fed P37, P32 or P26 (P>0.05). Cats had average metabolic body weights of 3.88Kg0.75, 3.87Kg0.75, and 3.86Kg0.75 after they were fed P37, P32 and P26, respectively. They maintained body weight on all treatment foods with average body weights of 6.11 Kg, 6.10 Kg and 6.07 Kg after P37, P32 and P26, respectively. The average daily food intake of the cats on the P37, P32 and P26 were 77.5g/BWKg0.75, 82.1g/BWKg0.75 and 85.4g/BWKg0.75, respectively. Both body weight and average daily intake were not significantly different between the treatment foods.
Cats with CKD commonly experience weight loss [23], as a result of loss of appetite and reduced food intake [9]. All treatment foods in this study met AAFCO recommendations for essential amino acids in cat food and had similar energy content (Table 1). The results show that the foods with varying protein concentrations did not compromise food intake and helped cats with CKD maintain body weight.
All treatment foods contained approximately 0.5% phosphorus, 0.7% calcium and 0.05% magnesium as fed (Table 1). The dietary cation anion balance (DCAB) of the foods as determined by the difference in the cations (sodium and potassium) and anions (chloride and sulfur) in the foods [24], was -9.6, -11 and -12.9 mEq/100g DM (milliequivalents per 100g dry matter), for the P37, P32 and the P26 protein foods, respectively.
Blood chemistry and urinalysis
The concentration of phosphorus in the blood was not statistically different after cats consumed P37 (3.71mg/dL±0.07), P32 (3.74mg/dL±0.06) and P26 (3.79mg/dL±0.08) (P>0.05). The results were expected as the treatment foods were formulated to contain similar phosphorus concentrations (Table 1). There were no differences by treatment in blood concentrations of creatinine, total protein and albumin. Blood Urea Nitrogen (BUN) concentrations were the highest after cats were fed P37 (29.1mg/dL, SE=1.64) and were different from the concentrations after feeding P32 (p=0.0007; 25.8mg/dL±0.08) and P26 (p<0.0001; 23.5mg/dL±0.09) (Table 2). High protein intake increases BUN in humans [25] and in cats [26]. It is well established in humans that decreased protein consumption benefits kidney patients by lowering BUN and other uremic toxins. We have previously shown that CKD cats have higher BUN compared to healthy cats [8]. Feeding CKD cats a high protein food may have deleterious consequence on the kidney by further increasing BUN concentrations.
|
Serum chemistries |
P37a |
P32b |
P26c |
P37-P32 P (SE) |
P37-P26 P (SE) |
P32-P26 P (SE) |
|
Creatinine1 |
1.34±0.09 |
1.23±0.04 |
1.33±0.05 |
0.1 (0.05) |
0.97 (0.06) |
0.19 (0.06) |
|
BUN1 |
29.1±1.64 |
25.8±0.08 |
23.5±0.09 |
0.0007 (0.89) |
0.04 (0.91) |
|
|
Total protein2 |
6.95±0.08 |
6.94±0.08 |
6.94±0.08 |
0.81 (0.06) |
0.93 (0.06) |
0.97 (0.06) |
|
Albumin2 |
3.38±0.04 |
3.4±0.04 |
3.36±0.04 |
0.87 (0.03) |
1 (0.03) |
0.87 (0.03) |
|
Phosphorus1 |
3.71±0.07 |
3.74±0.06 |
3.79±0.08 |
0.89 (0.08) |
0.57 (0.08) |
0.85 (0.08) |
|
Magnesium1 |
1.96±0.19 |
1.83±0.25 |
1.88±0.23 |
0.0002 (0.026) |
0.012 (0.027) |
0.48 (0.026) |
|
Calcium1 |
10.39±1.09 |
10.82±1.22 |
10.59±1.13 |
0.006 (0.12) |
0.27 (0.12) |
0.29 (0.12) |
|
Urinalysis |
|
|
|
|
|
|
|
Urine pH |
6.5±0.07 |
6.3±0.06 |
6.1±0.06 |
0.03 (0.07) |
0.02 (0.07) |
|
|
UPC3 |
0.22±0.14 |
0.20±0.12 |
0.16±0.09 |
0.02 (0.008) |
0.002 (0.015) |
0.002 (0.008) |
|
Urine specific gravity |
1.045±0.001 |
1.045±0.001 |
1.042±0.001 |
0.89 (0.001) |
0.008 (0.001) |
0.002 (0.001) |
Table 2. Selected serum and urine response to dietary protein.
Note: 1mg/dL, 2g/dL, 3UPC: Urine protein to creatinine ratio, a36.8%, b31.9%, c25.9% as fed protein.
Urine Protein to Creatinine ratio (UPC) was significantly different between treatments. Cats had the highest UPC on P37 followed by P32 (Table 1). Proteinuria, the presence of protein in the urine, is linked with kidney disease. Proteinuric animals with kidney disease live shorter than non-proteinuric animals with kidney disease [27]. In this study, urinary excretion of total protein was the lowest when cats ate P26 suggesting the importance of restricting protein for cats with CKD.
Urine pH plays an important role in the risk of stone formation in companion animals. Urine pH of cats in this study was significantly higher after they were fed P37 (6.5±0.07) compared to P32 (p=0.03, 6.3±0.06) and P26 (p<0.0001, 6.1±0.06). The slightly higher DACB of the P37 food may have contributed to the increase in the urine pH. Increase in urine pH is known to increase the risk of struvite formation while decreasing the incidence of calcium oxalate stone [28]. Accordingly, blood concentrations of magnesium were significantly higher after cats were fed P37 compared to both P32 and P26 (Table 2). Blood concentration of calcium, which correlates with oxalate crystal formation [29], significantly increased with P37 food compared to P32. Increased plasma calcium concentration has been shown to be associated with the progression of CKD in cats [30]. Further studies utilizing urine sediment analysis and GFR measurements are recommended to confirm the impact on the risk of urolithiasis and CKD progression. Urine Specific Gravity (USG) was slightly lower on P26 compared to both P37 and P32 (P<0.01) (Table 2). Previously, we showed that cats with CKD had higher urine pH and lower urine specific gravity compared to healthy cats [8]. The minimally reduced proteinuria after feeding CKD cats P26 could have attributed to the slight reduction in USG. However, additional studies on CKD cats may provide more information on the clinical significance of changes in UPC and USG associated with varying protein intake.
Plasma metabolomics
A total of 749 metabolites were identified in plasma samples collected after each treatment period. The complete plasma metabolomics data is shown in table S1. Principal Component Analysis (PCA) of plasma metabolites showed no separation of the 95% confidence areas after cats were fed P37, P32 and P26 (Figure 2).
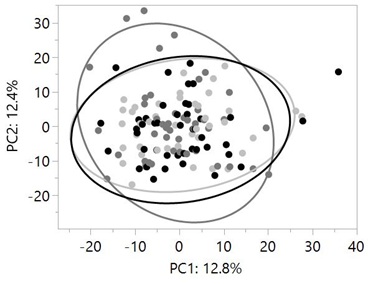 Figure 2: Principal component analysis of plasma metabolites did not show separation in 95% confidence areas (large circles) after cats were fed P37 (dark circles), P32 (dark grey circles) and P26 (light grey circles). Data were rescaled to a median value of 1. Significance was determined using one-way ANOVA on the log-transformed values followed by a post hoc Tukey’s test.
Neither of the Principal Components (PC1 and PC2) was significantly different between treatments (P>0.05). Similarly, previous evaluations of plasma and fecal metabolome did not show a complete separation in PCA analysis although plasma metabolites differentiated healthy cats from CKD cats better than fecal metabolome [8,31]. However, significant differences in plasma concentrations of uremic toxins, branched-chain amino acids and fatty acids were detected in samples collected after cats were fed P26, P32 and P37.
Urea and amino acids pathway metabolites in plasma
Higher protein consumption led to significantly increased concentrations of urea and homocitrulline in the plasma of the CKD cats (Figure 3).
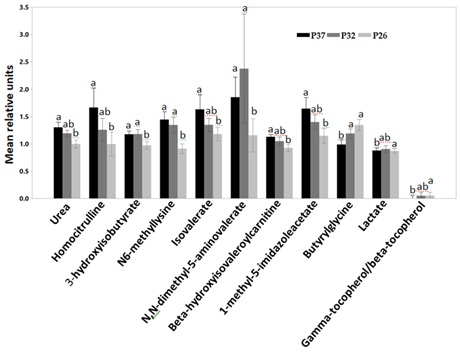 Figure 3: Relative mean units of plasma concentrations of urea and homocitrulline, 3-hydroxyisobutyrate, N6-methyllysine, isovalerate, N,N-dimethyl-5-aminovalerate, beta-hydroxyisovaleroylcarnitine, 1-methyl-5-imidazoleacetate, Butyrylglycine, lactate and gamma-tocopherol/alpha-tocopherol after CKD cats were fed P37 (black bars), P32 (grey bars) and P26 (light grey bars). Data were rescaled to a median value of 1 and are presented as group mean and standard errors. Significance was determined using mixed model analysis on the log-transformed values followed by a post hoc Tukey’s test. Bars with a letter in common were not significantly different (P≤0.05).
Cats with CKD have increased plasma concentrations of urea and citrulline compared to healthy cats [8]. CKD cats had also a numerically higher mean concentration of the arginine and proline cycle metabolite, homocitrulline [8]. Homocitrulline is a product of carbamylation of the amino groups of lysine residues. Carbamylation involves the addition of isocyanic acid, a product of urea dissociation, to amino acids. Desmons et al. [32], reported a positive correlation between homocitrulline and urea concentrations in renal patients. Further, increased protein intake led to higher plasma concentrations of the metabolites in the Leucine, isoleucine, valine pathway, such as isovalerate, beta-hydroxyisovaleroylcarnitine, 3-hydroxyisobutyrate and the lysine pathway metabolite N,N-dimethyl-5-aminovalerate (Figure 3). CKD is associated with altered amino acids profile in the plasma [33]. We have previously reported elevated plasma concentrations of the above metabolites in dogs with early renal disease compared to healthy dogs [34]. The histidine metabolism pathway metabolite, 1-methyl-5-imidazoleacetate also increased with high protein intake (P37) (Figure 3). High protein diets increase the activity of histidase, the rate-limiting enzyme in the catabolism of histidine to metabolites such as imidazoleacetate. On the other hand, low histidine foods decrease the enzyme’s activity preserving histidine from degradation [35]. The increase in the plasma concentrations of 1-methyl-5-imidazoleacetate could be the result of increased protein intake. Feeding renal cats a high protein food may therefore have a negative impact on CKD cats by increasing the accumulation of metabolites associated with the disease progression.
In a contrasting shift, the glycine conjugated short-chain fatty acid, butyrylglycine, and lactate decreased with increased protein consumption. Most Short-Chain Fatty Acids (SCFs) are not detectable in a metabolomics screen. Butyrylglycine may serve as a proximate measurement of the anti-inflammatory butyrate [5]. The decrease in butyrylglycine and the short-chain fatty acid, lactate may be due to the increased proteolysis by the gut bacteria that produces break-down products of protein, peptides and amino acids. This is shown by the increased concentrations of the Branched- Chain Fatty Acids (BCFAs) such as isovalerate with increased protein consumption. An increase in BCFAs and a decrease in SCFs is an indication of enhanced proteolysis by the gut microbes [36]. The controlled protein delivered to the gut when cats were fed P26 may have given saccharolytic bacteria a competitive advantage to ferment fiber and produce the beneficial postbiotics, butyrate and lactate [37,38].
Oxidative stress plays an important role in the pathophysiology of CKD in cats [39]. Ling and Kuo [40] summarized the various mechanisms through which oxidative stress is increased in CKD patients including the marked reduction in antioxidants such as alpha tocopherols in the serum. Cats with CKD have significantly lower plasma concentration of the antioxidant gamma-tocopherol/beta-tocopherol compared to healthy cats [8]. Here, CKD cats had a significantly decreased plasma concentration of gamma-tocopherol/beta-tocopherol, after they were fed P37 (Figure 3). Uremic toxins are among various factors contributing to the pro-oxidant state of CKD patients [40]. The increase in the plasma concentrations of several uremic toxins after cats were fed P37 could have led to the reduction in the antioxidants. The results indicate feeding CKD cats a high protein food may have a negative health consequence of increased oxidative stress.
Plasma levels of indoles
Plasma concentrations of indole sulfates such as 3-indoxyl sulfate, 5-hydroxyindole sulfate, 6-hydroxyindole sulfate and 3-hydroxyindolin-2-one sulfate increased significantly with increased consumption of protein (Figure 4). Indolin-2-one also showed a similar increase with protein consumption (Figure 4). Similarly, we have previously shown the increase in plasma concentrations of indole sulfates in healthy adult dogs with increased protein intake [5]. Indole sulfates are microbial uremic toxins produced by the proteolysis of the amino acid tryptophan. Blood concentrations of 3-indoxyl sulfate have a negative correlation with Glomerular Filtration Rate (GFR) [7,41,42] and a positive correlation to the blood concentration of creatinine [43]. Cats with renal disease have elevated plasma concentrations of indole sulfates compared to healthy cats [8]. The increase in indole sulfates with increased protein intake suggests feeding renal cats a high protein food may speed up the progression of kidney disease.
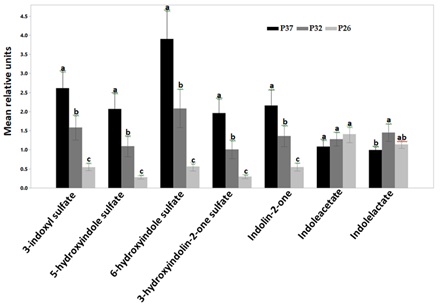 Figure 4: Relative mean units of plasma concentrations of indoles after CKD cats were fed P37 (black bars), P32 (grey bars) and P26 (light grey bars). Indole sulfates including 3-indoxylsulfate, 5-hydroxyindole sulfate, 6-hydroxyindole sulfate, 3-hydroxyindolin-2-one sulfate and indoline-2-one increased with increased protein intake (P<0.0001). Indoleacetate was not different by treatment while indolelactate concentrations were significantly higher after CKD cats were fed P32 compared with P37. Data were rescaled to a median value of 1 and are presented as group mean and standard errors. Significance was determined using mixed model analysis on the log-transformed values followed by a post hoc Tukey’s test. Bars with a letter in common were not significantly different (P≤0.05).
Unlike the sulfated indoles, the concentrations of indoleacetate were not different between treatments and were actually numerically higher in the group eating the lower protein food. Indolelactate concentration after cats were fed P37 was significantly lower than the concentration after cats ate the medium protein food (P<0.05) (Figure 4). Both indoleacetate and indolelactate are beneficial indoles that improve the gut barrier integrity [44].
Plasma concentrations of phenolic uremic toxins
The concentrations of phenolic compounds such as P-cresol sulfate, hippurate, 4-ethylcatechol sulfate, phenylpropionylglycine and 3-phenylpropionate (hydrocinnamate) increased with higher protein consumption (Figure 5). The concentration of P-cresol sulfate was significantly higher when cats were fed P37 and P32 compared to P26. There was no statistical difference between the concentrations of most other phenolic uremic toxins after cats were fed P32 and P26. The concentrations of phenylpropionylglycine and hippurate were significantly higher after cats were fed P37 compared to both P32 and P26. The concentration of 3-phenylpropionate (hydrocinnamate) and 4-ethylcatechol sulfate were only significantly different between P37 and P26.
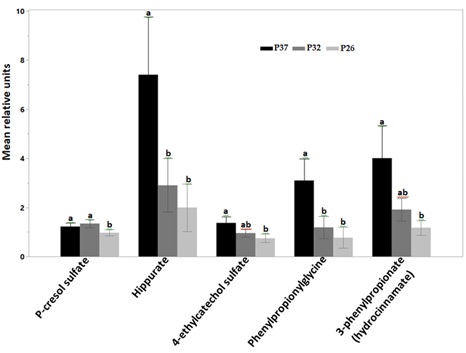 Figure 5: Relative mean units of plasma concentrations of phenolic uremic toxins after CKD cats were fed P37 (black bars), P32 (grey bars) and P26 (light grey bars). Concentrations of P-cresol sulfate were significantly higher after cats were fed P37 and P32 compared to P26. Hippurate and phenylpropionylglycine were significantly higher after cats were fed P37 compared to both P32 and P26. Concentrations of 3-phenylpropionate (hydrocinnamate) and 4-ethylcatechol sulfate significantly increased after cats ate P37 compared with P26. Data were rescaled to a median value of 1 and are presented as group mean and standard errors. Significance was determined using the mixed model analysis on the log-transformed values followed by a post hoc Tukey’s test. Bars with a letter in common were not significantly different (P≤0.05).
Most phenolic uremic toxins originate from the microbial fermentation of the amino acids phenylalanine and tyrosine. P-cresol sulfate is one of the most studied phenolic microbial uremic toxin which correlates negatively with GFR [43]. Several microbial uremic toxins positively correlate with blood concentrations of creatinine and Symmetric Dimethylarginine (SDMA) [34]. Likewise, Increase in the concentration of microbial phenolic uremic toxins has been associated with negative health consequences in CKD [45], through mechanisms involving inflammation and increased oxidative stress [46]. Feeding CKD cats protein restricted foods may slow down the progression of kidney disease through the reduction in the accumulation of several uremic toxins.
Limitations of this study include absence of microbiome and fecal metabolomics data to evaluate changes in the gut microbial composition and fecal metabolites with varying protein intake. However, very few microbial changes were observed in previous interventional studies in CKD cats [8]. The fecal metabolomics of renal cats were also shown to be similar to that of healthy cats [31]. However, varying levels of protein affects the fecal metabolome and microbiome of healthy dogs significantly [5]. Studies evaluating these changes in CKD cats would elucidate the gut associated changes that led to increased microbial uremic toxins in the plasma. Also, this study did not measure GFR of CKD cats after they were fed the foods with varying protein levels. Although several studies showed the correlation of the increased uremic toxins with reduced GFR [7,34,43], the measurement of GFR in the CKD cats after they were fed the foods with varying protein levels would also provide additional information on the impact on kidney function. This may be especially interesting because it is known that increased protein intake increases GFR [47]. So, the increased circulating concentration of the uremic toxins is even in the presence of a likely increased GFR.
In conclusion, the results of this study mainly indicate that high protein consumption increases BUN, UPC and concentrations of microbial uremic toxins such as 3-indoxyl sulfate and p-cresol sulfate in the plasma. Future work is needed to evaluate the effects of these changes on kidney function, the gut microbiome and fecal metabolites in CKD cats.
References
- Metzger M, Yuan WL, Haymann JP, Flamant M, Houillier P, et al. (2018) Association of a low-protein diet with slower progression of CKD. Kidney Int Rep 3: 105-114.
- Watanabe S (2017) Low-protein diet for the prevention of renal failure. Proc Jpn Acad Ser B Phys Biol Sci 93: 1-9.
- Ko GJ, Obi Y, Tortorici AR, Kalantar-Zadeh K (2017) Dietary protein intake and chronic kidney disease. Curr Opin Clin Nutr Metab Care 20: 77-85.
- Yang T, Richards EM, Pepine CJ, Raizada MK (2018) The gut microbiota and the brain-gut-kidney axis in hypertension and chronic kidney disease. Nat Rev Nephrol 14: 442-456.
- Ephraim E, Cochrane CY, Jewell DE (2020) Varying protein levels influence metabolomics and the gut microbiome in healthy adult dogs. Toxins (Basel) 12: 517.
- Maciel RAP, Cunha RS, Busato V, Franco CRC, Gregorio PC, et al. (2018) Uremia impacts VE-Cadherin and ZO-1 expression in human endothelial cell-to-cell junctions. Toxins (Basel) 10: 404.
- Schulman G, Vanholder R, Niwa T (2014) AST-120 for the management of progression of chronic kidney disease. Int J Nephrol Renovasc Dis 7: 49-56.
- Hall JA, Jackson MI, Jewell DE, Ephraim E (2020) Chronic kidney disease in cats alters response of the plasma metabolome and fecal microbiome to dietary fiber. PLoS One 15: 0235480.
- Hall JA, Fritsch DA, Jewell DE, Burris PA, Gross KL (2019) Cats with IRIS stage 1 and 2 chronic kidney disease maintain body weight and lean muscle mass when fed food having increased caloric density, and enhanced concentrations of carnitine and essential amino acids. Vet Rec 184: 190.
- Hall JA, Fritsch DA, Yerramilli M, Obare E, Yerramilli M, et al. (2018) A longitudinal study on the acceptance and effects of a therapeutic renal food in pet dogs with IRIS-Stage 1 chronic kidney disease. J Anim Physiol Anim Nutr (Berl) 102: 297-307.
- Ross SJ, Osborne CA, Kirk CA, Lowry SR, Koehler LA, et al. (2006) Clinical evaluation of dietary modification for treatment of spontaneous chronic kidney disease in cats. J Am Vet Med Assoc 229: 949-957.
- Polzin DJ, Churchill JA (2016) Controversies in veterinary nephrology: Renal diets are indicated for cats with international renal interest society chronic kdney disease stages 2 to 4: The pro view. Vet Clin North Am Small Anim Pract 46: 1049-1065.
- Santamaria R, Diaz-Tocados JM, Pendon-Ruiz de Mier MV, Robles A, Salmeron-Rodriguez MD, et al. (2018) Increased phosphaturia accelerates the decline in renal function: A search for mechanisms. Sci Rep 8: 13701.
- Caney S (2016) Management and treatment of chronic kidney disease in cats. In Practice Focus 10-13.
- Gonzalez-Parra E, Gracia-Iguacel C, Egido J, Ortiz A (2012) Phosphorus and nutrition in chronic kidney disease. Int J Nephrol 2012: 597605.
- Dobenecker B, Webel A, Reese S, Kienzle E (2018) Effect of a high phosphorus diet on indicators of renal health in cats. J Feline Med Surg 20: 339-343.
- Ritz E, Hahn K, Ketteler M, Kuhlmann MK, Mann J (2012) Phosphate additives in food--a health risk. Dtsch Arztebl Int 109: 49-55.
- Calvo MS, Uribarri J (2013) Public health impact of dietary phosphorus excess on bone and cardiovascular health in the general population. Am J Clin Nutr 98: 6-15.
- Scherk MA, Laflamme DP (2016) Controversies in veterinary nephrology: Renal diets are indicated for cats with international renal interest society chronic kidney disease stages 2 to 4: The con view. Vet Clin North Am Small Anim Pract 46: 1067-1094.
- International Renal Interest Society (2019) IRIS Treatment Recommendations for CKD in Cats. International Renal Interest Society, UK.
- Hall JA, Jewell DE (2012) Feeding healthy beagles medium-chain triglycerides, fish oil, and carnitine offsets age-related changes in serum fatty acids and carnitine metabolites. PLoS One 7: 49510.
- Hall JA, Yerramilli M, Obare E, Yerramilli M, Jewell DE (2014) Comparison of serum concentrations of symmetric dimethylarginine and creatinine as kidney function biomarkers in cats with chronic kidney disease. J Vet Intern Med 28: 1676-1683.
- Freeman LM, Lachaud MP, Matthews S, Rhodes L, Zollers B (2016) Evaluation of weight loss over time in cats with chronic kidney disease. J Vet Intern Med 30: 1661-1666.
- Tauriainen S, Sankari S, Pyörälä S, Syrjälä-Qvist L (2003) Effect of anionic salts on some blood and urine minerals, acid-based balance and udder oedema of dry pregnant cows. Agri Food Sci Finl 12: 83-93.
- Frank H, Graf J, Amann-Gassner U, Bratke R, Daniel H, et al. (2009) Effect of short-term high-protein compared with normal-protein diets on renal hemodynamics and associated variables in healthy young men. Am J Clin Nutr 90: 1509-1516.
- Backlund B, Zoran DL, Nabity MB, Norby B, Bauer JE (2011) Effects of dietary protein content on renal parameters in normal cats. J Feline Med Surg 13: 698-704.
- Harley L, Langston C (2012) Proteinuria in dogs and cats. Can Vet J 53: 631-638.
- Yamka RM, Friesen KG, Schakenraad H (2006) The prediction of urine pH using dietary cations and anions in cats fed dry and wet foods. Intern J Appl Res Vet Med 4: 58-66.
- Hall JA, Brockman JA, Davidson SJ, MacLeay JM, Jewell DE (2017) Increased dietary long-chain polyunsaturated fatty acids alter serum fatty acid concentrations and lower risk of urine stone formation in cats. PLoS One 12: 0187133.
- Tang PK, Geddes RF, Chang YM, Jepson RE, Bijsmans E, et al. (2021) Risk factors associated with disturbances of calcium homeostasis after initiation of a phosphate-restricted diet in cats with chronic kidney disease. J Vet Intern Med 35: 321-332.
- Hall JA, Jewell DE, Ephraim E (2020) Changes in the fecal metabolome are associated with feeding fiber not health status in cats with chronic kidney disease. Metabolites 10: 281.
- Desmons A, Jaisson S, Pietrement C, Rieu P, Wynckel A, et al. (2016) Homocitrulline: A new marker for differentiating acute from chronic renal failure. Clin Chem Lab Med 54: 73-79.
- Duranton F, Lundin U, Gayrard N, Mischak H, Aparicio M, et al. (2014) Plasma and urinary amino acid metabolomic profiling in patients with different levels of kidney function. Clin J Am Soc Nephrol 9: 37-45.
- Ephraim E, Jewell DE (2020) Effect of added dietary betaine and soluble fiber on metabolites and fecal microbiome in dogs with early renal disease. Metabolites 10: 370.
- Moro J, Tome D, Schmidely P, Demersay TC, Azzout-Marniche D (2020) Histidine: A systematic review on metabolism and physiological effects in human and different animal species. Nutrients 12: 1414.
- Hang I, Heilmann RM, Grützner N, Suchodolski JS, Steiner JM, et al. (2013) Impact of diets with a high content of greaves-meal protein or carbohydrates on faecal characteristics, volatile fatty acids and faecal calprotectin concentrations in healthy dogs. BMC Vet Res 9: 201.
- Jackson MI, Waldy C, Jewell DE (2020) Dietary resistant starch preserved through mild extrusion of grain alters fecal microbiome metabolism of dietary macronutrients while increasing immunoglobulin A in the cat. PLoS One 15: 0241037.
- Wernimont SM, Radosevich J, Jackson MI, Ephraim E, Badri DV, et al. (2020) The Effects of nutrition on the gastrointestinal microbiome of cats and dogs: Impact on health and disease. Front Microbiol 11: 1266.
- Keegan RF, Webb CB (2010) Oxidative stress and neutrophil function in cats with chronic renal failure. J Vet Intern Med 24: 514-519.
- Ling XC, Kuo KL (2018) Oxidative stress in chronic kidney disease. Renal Replacement Therapy 4: 53.
- Chen CN, Chou CC, Tsai PSJ, Lee YJ (2018) Plasma indoxyl sulfate concentration predicts progression of chronic kidney disease in dogs and cats. Vet J 232: 33-39.
- Cheng FP, Hsieh MJ, Chou CC, Hsu WL, Lee YJ (2015) Detection of indoxyl sulfate levels in dogs and cats suffering from naturally occurring kidney diseases. Vet J 205: 399-403.
- Lin CJ, Chen HH, Pan CF, Chuang CK, Wang TJ, et al. (2011) p-Cresylsulfate and indoxyl sulfate level at different stages of chronic kidney disease. J Clin Lab Anal 25: 191-197.
- Abdul Rahim MBH, Chilloux J, Martinez-Gili L, Neves AL, Myridakis A, et al. (2019) Diet-induced metabolic changes of the human gut microbiome: importance of short-chain fatty acids, methylamines and indoles. Acta Diabetol 56: 493-500.
- Feng YL, Cao G, Chen DQ, Vaziri ND, Chen L, et al. (2019) Microbiome-metabolomics reveals gut microbiota associated with glycine-conjugated metabolites and polyamine metabolism in chronic kidney disease. Cell Mol Life Sci 76: 4961-4978.
- Graboski AL, Redinbo MR (2020) Gut-derived protein-bound uremic toxins. Toxins (Basel) 12: 590.
- Sallstrom J, Carlstrom M, Olerud J, Fredholm BB, Kouzmine M, et al. (2010) High-protein-induced glomerular hyperfiltration is independent of the tubuloglomerular feedback mechanism and nitric oxide synthases. Am J Physiol Regul Integr Comp Physiol 299: 1263-1268.
Citation: Ephraim E, Jewell DE (2021) High Protein Consumption with Controlled Phosphorus Level Increases Plasma Concentrations of Uremic Toxins in Cats with Early Chronic Kidney Disease. J Food Sci Nutr 7: 096.
Copyright: © 2021 Eden Ephraim, et al. This is an open-access article distributed under the terms of the Creative Commons Attribution License, which permits unrestricted use, distribution, and reproduction in any medium, provided the original author and source are credited.