Length-Weight Relationship and Condition Factor of Ethmalosa fimbriata (Bowdich, 1825) From the Escravos Estuary, Delta State, Nigeria
*Corresponding Author(s):
Ochuko Joshua ErieghaDepartment Of Fisheries And Aquaculture, Nigeria Maritime University, Okerenkoko, Nigeria
Tel:+234 703 213 2859,
Email:oj.eriegha@yahoo.com
Abstract
Biometric data such as length-weight relationships and condition factor are veritable tools in fisheries management since it provide information about the growth of the fish, its general wellbeing, and fitness in an aquatic ecosystem. The length-weight relationship of Ethmalosa fmbriata collected from the Okerenkoko section of the Escravos estuary, Delta State, Nigeria was established, and its growth condition was evaluated using linear regression and Fulton's condition factor equation respectively. The logarithmic transformation equation of the length-weight relationship for E. fimbriata is given by the equation: Log TW=3.0588Log TL–2.1759 (r2=0.9045, n=182, P< 0.05). The computed b value (3.0588) was not significantly different (p>0.05) from 3 and revealed that fish growth is isometric. Condition factor (K) ranged between 0.620 for fish with total length (14.0 cm) and total weight (17.0 g) to 0.88 for fish with total length (16.3 cm) and total weight (38.0 g) with a mean and standard deviation value of 0.792 ± 0.01. The K value of this species in the Okerenkoko estuary indicated that they were not in good condition (K < 1). The poor condition of the fish may be attributed to occasional crude oil spillage in the area. This is first baseline data about LWRs and condition factor of fish species from the Escravos estuary. This data is therefore valuable for establishing a monitoring and management system of this fish species.
Keywords
Escravos; Fish biometrics; Growth; Regression coefficients
Introduction
Organisms generally increase in size (length and weight) during development. The key factors that influence the growth of fish are the quantity of food available, the number of fish utilizing same food source, temperature, oxygen and other water quality factors besides the size, age and sexual maturity of the fish [1]. In fish, size is generally more biologically relevant than age, mainly because several ecological and physiological factors are more size-dependent than age-dependent. Consequently, variability in size has important implications for diverse aspects of fisheries science and population dynamics [2]. Biometric data such as Length-Weight Relationship (LWR) is a veritable tool in fisheries management because it is useful in the estimation of the average length and weight by establishing a mathematical relationship between the relative well-being of the fish population [3,4]. According to Pitcher and [5], LWRs has both applied basic uses in the practical assessment of fish stocks. Length and weight data are also useful standard results of fish sampling programs [6]. Ethmalosa fimbriata, a Clupeid fish popularly known as Bonga shad is found in fairly shallow coastal waters, lagoons and estuaries, and sometimes also in lower courses of coastal rivers, even more than 300 km up rivers [7,8]. It breeds throughout the year in waters of salinities 3.5-38 ppt, but with peaks in at least some areas; spawns in the sea, in estuaries and in rivers [9]. E. fimbriata is distributed in West African Atlantic waters from Mauritania to Angola [10], and despite its marine origin, is highly abundant in estuaries, deltas, and lagoons [11]. It is one of the most important fishes targeted by artisanal fisheries in Cameroon, Ivory Coast, Nigeria, and Senegal [12,13]. In Nigeria, information on the length-weight relationship and condition factor of Ethmalosa fimbriata have been documented in Epe lagoon [14], Cross River Estuary [15,16], New Calabar River [17] and Nkoro river [18]. However, no work has been documented on the length-weight relationship of E. fimbrata from the Escravos Estuary. Hence, this study aimed to provide information on the length-weight relationship and condition factor of E. fimbriata from the Escravos Estuary. Results from this research will therefore serve as baseline resource for deductions in fisheries management policy formulations, geared towards enhanced fisheries development of the estuary.
Materials And Methods
Study area
Fish samples were collected from the Okerenkoko section of the Escravos estuary (Figure 1). The Escravos estuary is located in Western Niger Delta, Southern Nigeria. The area is mainly mangrove swamps and coastal sand edges. Salinity ranges between 14 - 31‰ [19]. The main occupation of the residents is fishing, fish processing, design and manufacturing of artisanal fishing gear such as basket net, traps, gill net, drag net, hook and line, petty trading etc. Numerous activities such as oil exploration and production also go on in the region.
Collection of E. fimbriata samples
A total of 182 samples of E. Fmbriata were randomly collected from notable fish landing points at Okerenkoko between July and October, 2021 from the landings of artisanal fisher-folks. The fish was caught by gears such as gill net and dip net. The samples were immediately transported to the teaching and research laboratory of the Faculty of Marine Environmental Management, Nigeria Maritime University, Okerenkoko, for species identification and biometric measurements. E. fimbriata was identified using keys and descriptions provided by [7,9].
Measurement of biometric parameters of E. fimbriata
Total length was measured to the nearest 0.1cm using a measuring board. Total length (cm) of each fish was taken from the tip of the snout (mouth closed) to the extended tip of the caudal fin [20]. Body weight was measured to the nearest 0.1g using Metlar 5000D electronic weighing balance.
Length-Weight Relationship
The expression W=aLb was used in the determination of the Length (L) and Weight (W) relationship [21].
Where: W= Weight of the fish (g),
L= Total length of the fish (cm),
a = Constant and,
b = Exponent of the length weight relationship.
The values of constant “a” and “b” were estimated from the log transformed values of length and weight i.e. log W=log a + b log L, via least square linear regression [21]. Departure from isometry (b = 3) for exponent of the length-weight relationship (b) was evaluated using a t-statistic function given by [22] as follows:
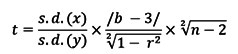 Where:
s.d. (x) = Standard deviation of the Log L values,
s.d. (y) = Standard deviation of Log W values,
n = Number of samples collected,
b = Estimated exponent of the length-weight relationship,
r2 = Correlation coefficient of the length-weight relationship.
According to [21], the value of b is significantly different from 3 if the value of t- calculated is greater than the value of t-tabulated for the degree of freedom (n–2).
Condition factor (K)
Condition factor (k) was using the equation: K= 100 W/L3 [21].
Where:
K = Condition factor,
W = Weight of fish (g) and
L = length of fish (cm).
Statistical analysis
Regression coefficient value 'b' coefficient of correlation 'r' and intercept 'a' in the Length-Weight Relationship (LWR) of E. fimbriata from the Escravos Estuary were determined by power and linear regressions using Microsoft Excel (Version 2013). Analysis of Variance (ANOVA) was used to analyze the monthly condition factor of E. fimbriata to check for significant difference at p = 0.05 using PASW Software (Version 17).
Results And Discussion
Length-weight relationship of E. fimbriata from the escravos estuary
The length-weight relationship of E. fimbriata from the Escravos Estuary (Figure 2) is given by the equation: TW = 0.0067 TL3.0588 (r2 = 0.9045, n = 182, P<0.05). A significant linear relationship was recorded between total length and total weight of E. fimbriata from the Escravos Estuary. The value of b (3.0588) was not significantly different from 3. The slope of the regression line of length and weight (b) computed for E. fimbriata obtained from the Okerenkoko estuary revealed an isometric growth pattern. When b=3, the fish grows isometrically resulting in ideal shape. When the b value is less than 3.0, the fish experiences a negative allometric growth, but when the value is higher than 3, the fish grows following the positive allometric growth pattern [23]. Findings from this study agrees with the b values (3.0) reported by [15] in E. fimbriata from Cross River. Values obtained from this study were, however, lesser that b values (3.210±0.013) reported by [14] in E. fimbriata from Epe Lagoon. The variation in ‘b’ value may be attributed to several factors such variations ecological conditions of the environment, habitat, season, body shape and amount of fat present, sex, maturity stage, temperature, salinity and available nutrient food [24, 3, 25, 16, 26]. It is noteworthy mentioning that the caught fish were not sexed, which could influence LWRs reported in the current study [27].
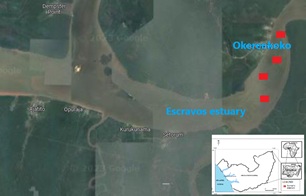 Figure 1: Map showing sample stations along the Escravos estuary.
The logarithmic transformation equation of the length-weight relationship (Figure 1) for the E. fimbriata is given by the equation: Log TW = 3.0588Log TL – 2.1759 (r2 = 0.9045, n = 182, P < 0.05).
Condition factor (K) of E. fimbriata from the escravos estuary
Condition factor (K) determined for one hundred and eighty two (182) specimens of E. fimbriata from the Okerenkoko estuary is presented in Table 1. Condition factor (K) ranged between 0.620 for fish with total length (14.0 cm) and total weight (17.0 g) to 0.88 for fish with total length (16.3 cm) and total weight (38.0 g) with a mean and standard deviation value of 0.792 ± 0.01. The present study revealed that K value decreased as the fish grow older. These values were lesser than those (1.0 ± 0.16) documented by [14] for E. fimbriata in Epe Lagoon. [16] Have also reported a higher pooled K value (1.06 ± 0.84) in E. fimbriata from Cross River Estuary. The K value of this species in the Okerenkoko estuary indicated that they were not in good condition (K < 1). The poor condition of the fish may be attributed to occasional crude oil spillage in the area [28, 29]. Ethmalosa fimbriata feed mostly on food from plant origin [3] and crude oil has been found to reduce photosynthetic rate and density of aquatic plants [30,31] reported that the larger the condition factor, the better the condition of the fish [32]. Have documented that K values may vary according to seasons and environmental conditions. [33] Corroborated this view that variation in condition factor of fish may be due to the abundance of food, adaptation to the natural environment and development of the gonads. The mean condition factor did not vary significantly (p > 0.05) across the months of sampling collection (Figure 2).
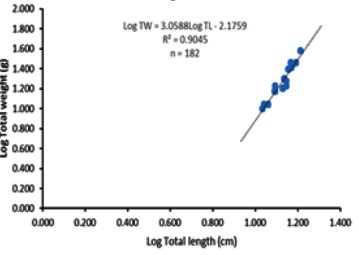 Figure 2: Map showing sample stations along the Escravos estuary.
|
Month |
Number of fish collected |
Mean Condition factor (K) |
|
July |
43 |
0.813 ± 0.01a |
|
August |
50 |
0.802 ± 0.01a |
|
September |
40 |
0.786 ± 0.01a |
|
October |
49 |
0.765 ± 0.02a |
|
Total |
182 |
0.792 ± 0.01 |
Table 1: Fulton’s Conditon Factor (K) of E. fimbriata from the Escravos Estuary.
*Means with the same superscript were not significantly different (p> 0.05)
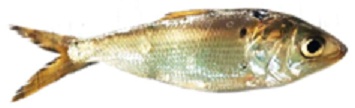 Plate 1: Bonga Shad (Ethmalosa fimbriata) Source: Field survey.
Conclusion
This study provided the first data on the length-weight relationship and condition factor of fish collected from the Escravos estuary. Biometric data of E. fimbriata from the estuary showed an isometric growth pattern (increasing in all dimensions at the same rate). The K value of this species also revealed that they were not in good condition. This might be attributed to environmental conditions or linked to morphological characteristics specific to fish species of this estuary. Crude oil activities going on in the area was also implicated. This findings can be successfully applied for estimating the standing stock biomass and comparing ontogeny of fish population from different regions. This information can therefore form a baseline tool for enhanced fisheries management.
References
- Kuriakose S (2017) Estimation of length weight relationship in fishes.In: Course Manual Summer School on Advanced Methods for Fish Stock Assessment and Fisheries Management. Lecture Note Series No. 2. CMFRI; Kochi, Kochi 215-220.
- Erzini K (1994) An empirical study of variability in length at age of marine fishes. Journal of Applied Ichthyology 10: 17-41.
- Omitoyin BO, Salako AE, Eriegha OJ (2013) Some Ecological Aspects of Oreochromis niloticus and Heterotis niloticus from Ona Lake, Asaba, Nigeria. World Journal of Fish and Marine Sciences 5: 641-648.
- Ayoade AA, Ikulala AOO (2007) Length weight relationship condition Factor and stomach contents of Hemichromis bimaculatus, Sarotherodon melanotheron and Chromidotilapia guntheri (Perciformes: Cichlidae) in Eleiyele Lake. South Western Nigeria. Revista de Biologia Tropical 55: 3-4.
- Pitcher TJ, Hart PJ (1982) Fisheries Ecology. Chapman and Hall, London.
- Morato TP, Afonso P, Loirinho JP, Barreiros RS, Sanstos, et al. (2001) Length-weight relationships for 21 costal fish species of the Azores, North-eastern Atlantic. Fisheries Research 50: 297-302.
- Gourène G, Teugels GG, Clupeidae P, Paugy D, Lévêqu C (2003) The fresh and brackish water fishes of West Africa Volume 1. Coll. faune et flore tropicales 40. Institut de recherche de développement, Paris, France, Muséum national d'histoire naturelle, Paris, France and Musée royal de l'Afrique Central, Tervuren, Belgium, 457: 125-142.
- Teugels GG, Clupeidae (2007) In M.L.J. Stiassny, G.G. Teugels and C.D. Hopkins (eds.). The fresh and brackish water fishes of Lower Guinea West-Central Africa. Collection Faune et Flore tropicales 42. Institut de Recherche pour le Développement, Paris, France, Muséum National d’Histoire Naturelle, Paris, France, and Musée Royal de l’Afrique Centrale, Tervuren, Belgium. 800: 186-204.
- Whitehead PJP, Nelson GJ, Wongratana T (1985) FAO Species Catalogue Vol 7 Clupeoid fishes of the world (suborder Clupeoidei). An annotated and illustrated catalogue of the herrings sardines pilchard’s sprats shads anchovies and wolf-herrings. FAO 125: 1-303.
- Paugy D, Lévêque C, Teugels GG (2003) The Fresh and Brackish Water Fishes of West Africa Publications Vol 1 and 2. Scientifiques du Muséum MRAC
- Charles-Dominique E Albaret JJ (2003) African Shads, with emphasis on the West African Shad Ethmalosa fimbriata.
- Limburg KE, Waldman JR (2003) Biodiversity, Status, and Conservation of the World’s Shads; American Fisheries Society Symposium 35: 27-48.
- Döring J, Tiedemann M, Stäbler M, Sloterdijk H, Ekau W (2017) Ethmalosa fimbriata (Bowdich 1825), a Clupeid Fish That Exhibits Elevated Batch Fecundity in Hypersaline Waters. Fishes 2: 1-22.
- Moses BS, Udoidiong OM, Okon AO (2002) A statistical survey of the artisanal fisheries of south-eastern Nigeria and the influence of hydroclimatic factors on catch and resource productivity. Fish Res 57: 267-278.
- Fafioye OO, Oluajo OA (2005) Length-weight relationships of five fish species in Epe lagoon, Nigeria. African Journal of Biotechnology 4: 749-751.
- Ama-Abasi D (2004) Length-weight parameters and condition factor of Bonga Ethmalosa fimbriatain the Cross River Estuary Nigeria importance of large volume of data. Global Journal of Pure and Applied Sciences 10: 379-383.
- Ajah PO, Asuquo PE (2017) Sex Ratio Length-Weight Relationship and Condition Factor of Ethmalosa fimbriata In The Cross River Estuary. IOSR Journal of Biotechnology and Biochemistry. 3: 46-55.
- Dienye HE, Olopade OA (2019) Length-Weight Relationship and Condition Factor of Fish Species Caught by Cast Net in New Calabar River Nigeria. Asian Journal of Fisheries and Aquatic Research 2: 1-13.
- Abowei JFN (2009) The Morphology Abundance Condition Factor and Length-weight Relationship of Ethmalosa fimbriata Bowdish 1825 from Nkoro River Niger Delta Nigeria. Advance Journal of Food Science and Technology 1: 51-56.
- Membere E, Abdulwasiu M (2020) Heavy Metals Concentration in Water, Sediment, and Fish around Escravos River, Nigeria. World Journal of Research and Review 10: 28-37.
- Pauly D (1984) Fish population dynamics in tropical waters: A manual for use with programmable calculators. ICLARM Studies and Reviews 8. International Center for Living Aquatic Resources Management Manila 325.
- Pauly D (1983) Some simple methods for the assessment of tropical fish stocks. FAO Fish Tech Pap 234: 52.
- Ajibare AO, Omobepade BP, Loto OO (2020) Condition Factor and Length-Weight Relationship of Berried African River Prawn (Macrobrachium vollenhovenii) in Asejire Reservoir, Nigeria. West African Journal of Fisheries and Aquatic Sciences 1: 35-42.
- Thulasitha WS, Sivashanthini K (2012) Growth Pattern and Length-weight Relationship of Scomberoides lysan(Pisces: Carangidae) from the Northern Waters of Sri Lanka. Journal of Fisheries and Aquatic Science 7: 57-64.
- Eyo VO, Awom IE (2016) Length Weight Relationship, Length Frequency Distribution and Condition Factor of the Shiny Nose Polydactylus quadrafilis (Cuvier, 1829) From the Cross River Estuary, Nigeria. International Journal of Scientific Research in Science Engineering and Technology 2: 373-378.
- Akanse NN, Eyo VO (2018) Length-weight Relationship, Condition Factor and Length Frequency Distribution of the Tongue Sole Cynoglossus senegalensisfrom AkpaYafe River, Bakassi, Cross River State, Nigeria. Asian Journal of Advances in Agricultural Research 6: 1-8.
- Pardoe H, Thórdarson G, Marteinsdóttir G (2008) Spatial and temporal trends in condition of Atlantic cod Gadus morhuaon the Icelandic shelf. Mar Prog Ser 362: 261-277.
- Eriegha OJ, Sam K (2020) Characterization of crude oil impacts and loss of livelihood in the Niger Delta, Nigeria: A fisheries perspective. International Journal of Maritime and Interdisciplinary Research 1: 255-273.
- Binyotubo TE, Eyo V, Eriegha OJ, Eze F (2022) Status and Constraints of Artisanal Fishers In Escravos Estuary around Okerenkoko and Kurutie Axis, Niger Delta, Nigeria. Advances in Multidisciplinary and Scientific Research 8: 51-62.
- Krebs CT, Tanner CE (1981) Restoration of oiled marshes through sediment stripping and Spartina propagation. Proceeding of the 1981 oil spill conference, American petroleum institute, Washington DC 375-385.
- Nikolsky G V (1963) The Ecology of Fishes. Academic Press; London 353.
- Braga FMS (1986) Estudo entre o factor de condição e relação peso/comprimento para alguns peixes marinhos. Rev Brasil Biol 46: 339-346.
- King RP (1991) The biology of Tilapia niariae Bovlenger 1899 (Perciformes: Cihlidae) in a Nigeria, Rainforest stream. Ph.D Thesis, Department of Zoology, University of Port-Harcourt, Nigeria: 102-105.
Citation: Eriegha OJ, Eyo VO (2023) Length-Weight Relationship and Condition Factor of Ethmalosa fimbriata (Bowdich, 1825) From the Escravos Estuary, Delta State, Nigeria. J Aquac Fisheries 7: 51.
Copyright: © 2023 Ochuko Joshua Eriegha, et al. This is an open-access article distributed under the terms of the Creative Commons Attribution License, which permits unrestricted use, distribution, and reproduction in any medium, provided the original author and source are credited.