Macular Thickness Measurement in Diabetic Patients Using Optical Coherence Tomography in Yaounde
*Corresponding Author(s):
Chantal Nanfack NgouneDepartment Of Ophthalmology, Faculty Of Medicine And Biomedical Sciences, University Of Yaounde I, Cameroon
Tel:+237 699878192,
Email:cngoune2001@yahoo.fr
Abstract
Objective: To determine the mean central macular thickness of diabetic patients as well as the frequency of macular thickness abnormalities and the factors associated with them.
Methodology: A prospective study was done from February to May 2021 at the University Teaching Hospital Yaounde. Analyzed parameters were age, gender, diabetes type, duration and treatment, glycemic control, fundus examination, and central macular thickness measured by optical coherence tomography. Data analysis was performed using Epi Info version 7.2.26 and Excel 2013, and comparisons were made with chi-squared and Pearson tests with a significance level of 5% (p < 0.05).
Results: 85 diabetic patients were included (165 eyes). The mean age was 57.4 ± 9.4 years. The mean central macular thickness was 229.6 ± 53.8 µm. Optical coherence tomography detected a retinal abnormality in 78.2% of the eyes compared with 8.5% on fundoscopy. Abnormalities of macular thickness included perifoveolar thickening, macular thinning, subclinical macular edema and significant macular edema.
Conclusion: Optical coherence tomography has allowed the early detection of subclinical macular edema in our population.
Keywords
Diabetic retinopathy; Macular edema; Optical coherence tomography; Retinal neurodegeneration
Introduction
The two main vision-threatening retinal complications of diabetes are severe diabetic retinopathy and diabetic maculopathy. Assessment of macular thickness is important, as macular edema is a leading cause of blindness in patients with diabetes [1,2]. Clinical diagnosis of diabetic macular edema is based on the biomicroscopic examination of the fundus by observing retinal thickening and/or the presence of dry exudates and hemorrhages in the macular region. Clinical diagnosis of retinal thickening is only possible for thickness increases greater than 1.6 times the normal. Optical Coherence Tomography (OCT) provides objective and reproducible measurements of retinal thickness and is increasingly used to detect macular thickness abnormalities in diabetics [3]. OCT differentiates two groups of macular thickness abnormalities: macular thinning [4] and macular thickening [5]. This study aimed to determine the macular thickness of diabetic patients from Cameroon and the associated factors related to these abnormalities.
Materials and Methods
In this cross-sectional non-comparative study, we measured the macular thickness of diabetic patients at the Yaounde University Teaching Hospital between November 2020 and July 2021. The study was conducted following the tenets of the Declaration of Helsinki. The institutional Ethical review board of the faculty of medicine and biomedical sciences (FMSB) of the University of Yaounde I approved the study (Number 272/UYI/FMSB/RDRC/DAASB/CSD). Written informed consent was obtained from each patient after explanation of the procedure.
All diabetic patients who consented to participate in the study were included. Exclusion criteria were: eyes with cloudy media, history of panretinal photocoagulation, cataract surgery less than three months ago, macular holes, severe myopia (≥6 diopters), and age-related macular degeneration. Diabetic characteristics, namely the type of diabetes, duration of disease, glycated hemoglobin, current treatments, and co-morbidities (hypertension, renal insufficiency, and pregnancy), were obtained from the patient’s medical record. Ophthalmological examination (distance visual acuity, intra ocular pressure, fundus examination, and fundus photograph) enabled us to obtain the clinical parameters. Macular thickness measurement was performed with a Maestro 3D spectral domain OCT in radial slices. Quantitative analysis was done by the macular mapping software, which automatically calculated the mean value of the macular thickness in different sectors of the ETDRS macular grid. A central macular thickness of 229 ± 24 μm was considered normal, which corresponds to the reference value for the Maestro 3D spectral domain OCT device [6]. Macular thickness abnormalities were identified as macular thickening (subclinical ME, significant diabetic macula edema, pericentral ME, diffuse or localized) and macular thinning. Subclinical macular edema was considered according to the Diabetic Retinopathy Clinical Research Network [7] as a central focal spot thickness on OCT between 225-299 μm and the absence of macular edema on a slit lamp. Perifoveolar edema was considered to be any thickening in the circular area of 1 mm in diameter around the macula’s central point. Clinically significant macular edema, as defined by the ETDRS, was any retinal thickening and/or exudates reaching the center of the macula, or retinal thickening and/or exudates located within 500µm of the center of the macula but not reaching it, or retinal thickening with an area of 1DP or more located at least partially within 1DP of the center of the macula [8]. Macular thinning was defined as any macular thickness less than 205 µm
Statistical Analysis
Qualitative variables were reported as a number (%). Quantitative variables were reported as a mean ± standard deviation or median with Interquartile Range (IQR) according to the normality of the distribution. The association between the variables was calculated using an odds ratio. Differences between proportions were analyzed using contingency tables and applying the chi-squared or Fischer’s exact test when the theoretical number of participants was < 5. The Pearson test was used to compare quantitative variables. Any differences were considered statistically significant for values of P < 0.05.
Results
A total of 85 (165 eyes) diabetic patients were included in this study. There were 48 (56.47%) females, and theme an age was 57.36 ± 9.36 years (range of 38-79 years). Type 2 diabetes was present in 98.82% (n=84) of patients. The mean duration of disease was 6.95 ± 6.82 years (range of 1-10 years). Metabolic control (HbA1c >7%) was poor in 44 (51.76%) patients, and theme an HbA1c was 8.06 ± 2.26%. Oral antidiabetic therapy was taken by 70 (90.59%) patients. Diabetic retinopathy was present in 14 (8.5%) eyes. The mean central macular thickness was 229.65 ± 53.78 μm, (range of 170-655 μm). A normal central macular thickness was found in 50 (58.80%) patients. Macular thickness abnormalities were detected in 129 eyes, which were distributed as follows: 90(69.75%) with macular thickening and 39 (30.25%) with macular thinning. Macular thickenings were distributed as follows: Central macular edema in 29 (32, 22%) eyes, of which 4(13.80%) had significant macular edema (Figure 1), and 25 (86.20%) had subclinical macular edema (Figure 2). 61 eyes exhibited perifoveolar edema (Figures 3&4), of which 41(67.21%) were diffuse and 20(37.79%) were localized. The correlation between macular thickness and glycemic control was not statistically significant (p=0.473); however, there was a significant negative (r < 0) correlation (p=0.049) between central macular thinning and diabetes duration. Perifoveolar thickening was not significantly associated with the duration of diabetes (P=0.454) orglycemic control (P=0.274). In addition, diabetic patients with perifoveolar thickening had good metabolic control (HbA1c: 6.7 ± 1.01%) and a longer duration of diabetes compared to those without perifoveolar thickening. There was no statistically significant correlation between central macular thickness and diabetic retinopathy (P=0.147), nor between central macular thickness and diabetes treatment (P=0.053)
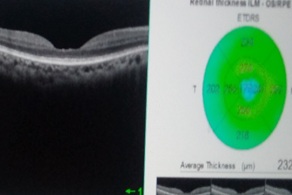 Figure 1: Central macular thinning.
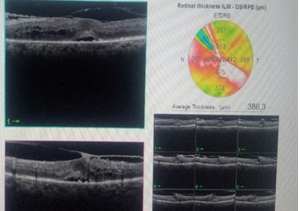 Figure 2: Significant diabetic macular edema.
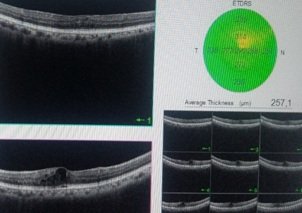 Figure 3: Subclinical macular edema.
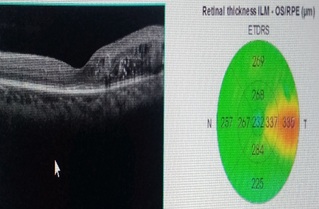 Figure 4: Focal perifoveolar macular edema.
Discussion
The mean age of the patients was 57.4 ± 9.4 years with a predominance of females. This predominance of diabetes among women has previously been reported by the WHO. A local study found similar results [9]. Nearly all the participants (98.82%) had type 2 diabetes. This result was in agreement with a study by Sobngwi et al., in 2001 who had reported 86.8% of cases of type 2 diabetes in Cameroonians [10]. Several factors explain this high prevalence of type 2 diabetes in our environment, including changes in lifestyle and eating habits under the influence of the rapid occidentalizing of African society. However, in industrialized countries, genetic predisposition is a major factor in the occurrence of type 2 diabetes. The mean duration of diabetes was 6.95 ± 6.82 years. Diabetes control, defined as HbA1c < 7%, was observed in one third of our patients. This implies that most diabetics in our series were at risk of developing retinal diabetic complications. Retinal damage in diabetes has long been considered non-existent when fundus examinations do not reveal any vascular lesions [11]. At present, the development of OCT makes it possible to confirm the existence of subclinical retinal lesions that can be identified before the first vascular lesions are visible via ophthalmoscopy [12]. Hence, in the present study, indirect ophthalmoscopy detected retinal abnormalities in 8.5% of patients, including 2.4% with clinically significant macular edema. However, OCT revealed 78.2% of macular thickness abnormalities.
In our study, macular thickness abnormalities were dominated by macular thickening in 54.5% (n=90) of patients and macular thinning in 23.6% (n=39). An increase in macular thickness is due to fluid accumulation in the macula in patients with diabetes mellitus. Various forms of macular thickenings were found in our study [13]. Subclinical macula edema accounted for 15.2% of patients. The prevalence of subclinical edema varies throughout studies; Pires et al., [14,15] reported 9.3%, while the DRCR reported 4.8% [7]. The high prevalence of subclinical macula edema in our study can be explained by the enrolment approach. In both studies, only patients with non-proliferative diabetic retinopathy were included. In our study, all diabetic patients with or without diabetic retinopathy were enrolled. This suggests that there is subclinical macular edema before the first signs of diabetic retinopathy appear. These subclinical macular edemas are thought to progress to clinically significant macular edema within two years following their diagnosis in 25–50% of cases [7]. Pires et al., found that eyes with subclinical macular edema were 3.686 times more likely to progress to clinically significant macular edema within two years following their detection [15]. One factor favoring this progression is poor diabetes control, as assessed by HbA1c levels. For every 1% increment in HbA1c, the risk of progressing to clinically significant macular edema increases by a magnitude of 1.567 [15]. Browning et al., [16] found that after a 14-month follow-up, the progression rate from subclinical macular edema to clinically significant macular edema was 31.4%. They also reported spontaneous regression of subclinical edema over time.
Perifoveolar or pericentral edema accounted for 36.9% of macular thickening in our series. According to Vujodevic et al., perifoveolar edema is a cumulative factor in the progression to clinically significant macular edema therefore; they suggested that it should be taken into account in an OCT classification [17]. In the present study, perifoveolar edema was non-significantly associated with a longer duration of diabetes (p=0.54). We hypothesize that the duration of diabetes may also be a factor in the progression to clinically significant macular edema. Clinically significant macular edema was present in 2.4% of patients (n= 4). This anomaly represents a critical stage in which treatment should be considered, as it exposes the patient to a high risk of visual loss; therefore, there is great clinical significance for early screening and identification of diabetic macular edema its prevalence varies between 2% and 10% and can increase up to 28-29% in patients with diabetes duration greater than 20 years [18]. The low rate observed in the current study can be explained by the small sample size, and also by the short average duration of diabetes of less than 10 years.
Macular thinning was found in 23.6% of cases (n=39). Both retinal neurons and glial cells are damaged by diabetes, and neuroretinal alterations mostly appeared before the onset of clinically detectable retinopathy [19]. A decrease in foveolar retinal thickness associated with a decrease in the macular photoreceptor layer in the absence of any visible lesions in the fundus was described by Verma et al., in 2009 [12]. In addition, in 2016, Sohn et al. reported a progressive thinning of the optic fiber layer, the ganglion cell layer, the medial plexiform, and the medial nuclear layer associated with the first vascular lesions [20]. Retinal thinning in the pericentral areas has been described in both type I [21] and type 2 diabetics [14]. This suggests that both types of diabetes are neurodegenerative. Currently, the diagnosis of retinal neurodegeneration is facilitated thanks to the development of non?invasive ophthalmic imaging techniques, such as OCT and multifocal electroretinogram [22]. A correlation between retinal neurodegeneration and other neurodegenerative diseases such as Alzheimer’s disease has been investigated [23]. However, the management of this neurodegenerative process has not yet been established, but therapeutic perspectives based on neuroprotection are being tested for topical neuroprotective therapy [22].
We did not find a statistically significant correlation between central macular thickness and HbA1c level. Several authors found a positive correlation between macular thickness and HbA1c for a duration of diabetes of more than 10 years [24,25]. A negative (r < 0) and significant (p=0.049) correlation was observed between macular thinning and the duration of diabetes. This would be due to the progressive loss of neurons, suggesting that the progression of the disease is irreversible, since these cells generally cannot be replaced [5].
Conclusion
The mean central macular thickness is thicker in diabetic patients in our milieu. Optical coherence tomography has allowed the early detection of subclinical macular lesions, which is necessary to preserve vision and would enable the threshold for intervention to be determined if progression occurs.
Funding
The authors declare that no funds, grants, or other support were received during the preparation of this manuscript
Competing Interests
The authors have no relevant financial or non-financial interests to disclose.
References
- Klein R, Klein BE, Moss SE, Linton KL (1992) The Beaver Dam Eye Study. Retinopathy in adults with newly discovered and previously diagnosed diabetes mellitus. Ophthalmology 99: 58-62.
- Aiello LP, Gardner TW, King GL, Blankenship G, Cavallerano JD, et al. (1998) Diabetic retinopathy. Diabetes Care 21: 143-156.
- Schimel AM, Fisher YL, Flynn HW Jr. (2011) Optical coherence tomography in the diagnosis and management of diabetic macular edema: time-domain versus spectral-domain Ophthalmic Surg Lasers Imaging 42: 41-55.
- Oshitari T, Hanawa K, Adachi-Usami E (2009) Changes of macular and RNFL thicknesses measured by Stratus OCT in patients with early stage diabetes. Eye (Lond) 23: 884-889.
- Demir M, Oba E, Dirim B, Ozdal E, Can E (2013) Central macular thickness in patients with type 2 diabetes mellitus without clinical retinopathy. BMC Ophthalmol 13:11.
- Giani A, Cigada M, Choudhry N, Deiro AP, Oldani M, et al. (2010) Reproducibility of retinal thickness measurements on normal and pathologic eyes by different optical coherence tomography instruments. Am J Ophthalmol 150: 815-824.
- Diabetic Retinopathy Clinical Research Network, Bressler NM, Miller KM, Beck RW, Bressler SB, et al. (2012) Observational study of subclinical diabetic macular edema. Eye (Lond) 26: 833-840.
- Early Treatment Diabetic Retinopathy Study Research Group. ETDRS report number 7: Early Treatment Diabetic Retinopathy Study design and baseline patient characteristics. Ophthalmology 98: 741-756.
- Dehayem YM, Sobngwi E, Nwatsock JF, Mani JM, Jupkwo B, et al. (2010) P86 Prise en charge du diabète sucré au Cameroun : résultats de l’étude Diabcare. Diabetes & Metabolism 36: 59-60.
- Sobngwi E, Mauvais-Jarvis F, Vexiau P, Mbanya JC, Gautier JF (2001) Diabetes in Africans. Part1: epidemiology and clinical specifities. Diabetes Metab 27: 628-634.
- Browning DJ, McOwen MD, Bowen RM Jr, O'Marah TL (2004) Comparison of the clinical diagnosis of diabetic macular edema with diagnosis by optical coherence tomography. Ophthalmology 111: 712-715.
- Verma A, Rani PK, Raman R, Pal SS, Laxmi G, et al. (2009) Is neuronal dysfunction an early sign of diabetic retinopathy? Microperimetry and spectral domain optical coherence tomography (SD-OCT) study in individuals with diabetes, but no diabetic retinopathy. Eye (Lond) 23: 1824-1830.
- Wilkinson CP, Ferris FL 3rd, Klein RE, Lee PP, Agardh CD, et al. (2003) Proposed International Clinical Diabetic Retinopathy and Diabetic Macular Edema Disease Severity Scales. Ophthalmology 110: 1677–1682.
- van Dijk HW, Verbraak FD, Kok PH, Stehouwer M, Garvin MK, et al. (2012) Early neurodegeneration of type 2 diabetic patients. Invest Ophthalmol Vis Sci 53: 2715-2719.
- Ozdek SC, Erdinc MA , Gurelik G, Aydin B, Bahceci U, et al. (2005) Optical coherence tomographic assessment of diabetic macular edema : comparison with fluorescein angiographic and clinical findings. ophtalmologica 219: 86-92.
- Browning DJ, Fraser CM (2008) The predictive value of patient and eye characteristics on the course of subclinical diabetic macular edema. Am J Ophthalmol 145: 149-154.
- Vujosevic S, Varano M, Egan C, Sivaprasad S, Menon G, et al. (2016) Relevance of retinal thickness changes in the OCT inner and outer rings to predict progression to clinical macular edema: An attempt of composite grading of macular edema. Ophthalmic Res 55: 19-25.
- Klein R, Klein BE, Moss SE, Davis MD, DeMets DL (1984) The Wisconsin epidemiologic study of diabetic retinopathy. IV Diabetic macular edema. Ophthalmology 91: 1464-1474.
- Gardner TW, Antonetti DA, Barber AJ, LaNoue KF, Levison SW (2002) Diabetic retinopathy: more than meets the eye. Surv Ophthalmol 47: 253-262.
- Sohn EH, van Dijk HW, Jiao C, Kok PH, Jeong W, et al. (2016) Retinal neurodegeneration may precede microvascular changes characteristic of diabetic retinopathy in diabetes mellitus. Proc Natl Acad Sci USA 113: 2655-2665.
- Biallosterski C, van Velthoven ME, Michels RP, Schlingemann RO, DeVries JH, et al. (2007) Decreased optical coherence tomography-measured percentral retinal thickness in patients with diabetes mellitus type 1 with the minimal diabetic retinopathy. Br J Ophtalmol 91: 1135-1138.
- Simo R, Hernandez C, European Consortium for the Early Treatment of Diabetic Retinopathy (2014) Neurodegenereration in the diabectic eye: new insights and therapeutic perspectives. Trends Endocronol Metab 25: 23-33.
- Doustar J, Torbati T, Black KL, Koronyo Y, Koronyo-Hamaoui M (2017) Optical coherence tomography in Alzheimer’s disease and other neurodegenerative diseases. Front Neurol 8: 701.
- Yeung L, Sun CC, Ku WC, Chuang LH, Chen CH, et al, (2010) Associations between chronic glycosylated haemoglobin (HbA1c) level and macular volume in diabetes patients without macular oedema. Acta Ophthalmol 88: 753-758.
- Chou TH, Wu PC, Kuo JZ, Lai CH, Kuo CN (2009) Relationship of diabetic macular oedema with glycosylated haemoglobin. Eye (Lond) 23: 1360-1363.
Citation: Kagmeni G, Ngoune CN, Mvilongo CT, Nsala SN, Noche CD (2022) Macular Thickness Measurement in Diabetic Patients Using Optical Coherence Tomography in Yaounde. J Ophthalmic Clin Res 9: 096.
Copyright: © 2022 G Kagmeni, et al. This is an open-access article distributed under the terms of the Creative Commons Attribution License, which permits unrestricted use, distribution, and reproduction in any medium, provided the original author and source are credited.