Molecular Characterization of Olive Cultivars from Italy (Campania): A Mass Spectrometry Approach
*Corresponding Author(s):
Andrea CarpentieriDepartment Of Chemical Sciences, University Of Naples Federico II, Italy
Tel:+39 081674121,
Email:acarpent@unina.it
Abstract
Olives mainly produced in the Mediterranean area have a rich history of nutritional, medicinal and ceremonial uses. In recent decades, there has been an increasing demand of such products thus requiring developments in the analytical workflows to ensure the quality and the typization. In this study, we present the molecular characterization of five olive cultivars from Campania region (South Italy): Bacoli (Naples), Sant’Angelo a Scala (Avellino), Controne (Salerno) and two different varieties, Ortolana and Racioppella, from Guardia Sanframondi (Benevento).
Volatile compounds, fatty acids and metals profiling where achieved by different extraction procedures coupled to mass spectrometry methodologies (GC-MS and ICP-MS).
Taken together, our results suggest similarities (as long as some peculiar differences) of olives under investigation. Metals content, fatty acids and VOC profiles led to the molecular fingerprinting of analyzed cultivars useful for product typization as long as for nutritional purposes. The methodology described in this study is fast, reproducible, sensitive and accurate and requires little sample handling.
Keywords
Fatty acids; GC-MS; ICP-MS; Metals; Olive cultivars; Volatile compounds
INTRODUCTION
Olives have a rich history of nutritional, medicinal and ceremonial uses. Italy is historically among the principal producers of olives and olive oils worldwide; the uniqueness of Italian olive oil relies in the environmental condition and farming conditions. Olives are present in 18 out of 20 Italian regions; particularly, the southern part of the nation heavily contributes to oil production (about 80%).
The molecular composition of Olea europea has been the subject of many research projects mainly focused on the classification of the most important chemical components such as glycerides, aliphatic compounds, polycyclic triterpenes, phenols and metals [1,2]. Quali/quantitative differences among these molecules define the organoleptic characteristics for each cultivar.
The quality of olive oils is strongly related to physiological conditions of the fruits from which they are extracted [3]. For example, the action of parasites (such as the olive fly and/or fungal activity during the period between harvesting and oil extraction) as long as the geographical location and the stage of ripening of the fruits (during harvesting period) are among the main factors which influence the quality of olives and therefore of olive oils [4-6]. Olives physiology undergoes changes directly related to the ripening stage; lipids biosynthesis for example, mainly occurs during the growth and ends at the beginning of ripening [7,8]. During the first stage of ripening, the fruit develops its final size, maintaining the original skin color [9]. Subsequently, chlorophyll pigments in the olive skin are progressively replaced by anthocyanins [10]. Because of these events, the process of ripening can be divided into different stages according to the concentration of anthocyanins exhibited [11]. It is therefore possible to identify a “spotted stage”, a “purple stage” and a “black stage” according to the skin color of the fruits [3,12].
At the same time, farming conditions play a fundamental role: An excessive use of pesticides, for example, can alter the quality of the final product [13].
Finally, the geographical origin of the olives themselves, represent an important aspect for oil quality. In particular, the diversified presence of mineral salts (depending on the type of soil present in the different geographical areas) deeply influence olive cultivars in terms of metals content. Clearly, environmental pollution represents a further possibility of metal entry into edible oils. The elemental analysis of olive fruits is therefore very important [14], for oil characterization [15] and oil adulteration detection. Some of them are in fact essential for human nutrition (Al, Ca, Co, Cr, Cu, Fe, K, Mg, Mn, Na, Ni and Zn), some others have effects on the oxidative stability of edible oils (Cu, Fe, Mn, Ni, Zn) and some occur in oils due to environmental contamination (Cu, Cd, Pb) [14,16].
Due to the diversity of the variables so far described, the molecular composition of olives is a complex mixture of different class of elements and molecules.
Because of the high sensitivity, accuracy, reproducibility and rapidity of analysis, mass spectrometry based methodologies have been widespread, in food chemistry [17,18].
In particular, Gas Chromatography coupled to Mass Spectrometry (GC-MS) and Inductively Coupled Plasma Mass Spectrometry (ICP-MS), have proved to be very useful tools for the analysis of complex mixtures, such as plant extracts [14,19-22]. Here, an analytical platform, integrating different mass spectrometry techniques was instrumental for the characterization of the organic and elemental components of five olive cultivars from Campania region (South Italy), respectively: Bacoli (Naples), Sant’Angelo a Scala (Avellino), Controne (Salerno) and two different varieties, Ortolana and Racioppella, from Guardia Sanframondi (Benevento).
MATERIALS AND METHODS
Samples
Different olive lots (harvested between October and December 2015 and 2016) of each variety were purchased by local producers; each lot is typical of South Italy (Campania region). Each variety was pooled and further analyses were performed on the pools.
• Pool 1 from Bacoli (Napoli)
• Pool 2 from Sant’Angelo a Scala (Avellino)
• Pool 3 from Controne (Salerno)
• Pool 4 Ortolana from Guardia Sanframondi (Benevento)
• Pool 5 Racioppella from Guardia Sanframondi (Benevento)
Reagents
Acetone, n-hexane and chloroform were supplied by Sigma-Aldrich; methanol was produced by Baker; acetyl chloride, Acetonitrile (ACN), were provided by Fluka; formic acid and methyl alcohol anhydrous were supplied by Carlo Erba; bidistilled water (MilliQ) was provided by Millipore cartridge equipment; metals standard solution, nitric acid, hydrogen peroxide solution and were provided by Romil.
Metals analysis
Sample preparation: Olives were pitted and 500 mg of olive pulp were weighed. Each sample was hydrolysed in acid using a microwave oven (Milestone Ethos 900-Mega II), in Teflon vessels by adding a mixture of 6ml of 65% HNO3, 2ml of H2O2 30%. Mineralization was achieved with the following microwave oven program: 20min to reach 220°C at 1400 W; 15min at 220°C and 1400W; ventilation for 30min. Mineralized solutions was quantitatively transferred into Falcon 50ml test-tube Milli-Q water was added until 25ml of total volume and stored at 4°C until the ICP-MS analysis was performed.
ICP-MS analysis: The analyses were carried out on an Agilent 7700 ICP-MS, equipped with a frequency matching RF generator and 3rd generation Octopole Reaction System (ORS3), operating with helium as cell gas on diluted samples (1:10v/v Milli-Q water).
The parameters were set as follows: Radiofrequency power 1550W, plasma gas flow 14L/min; carrier gas flow 0.99L/min; His gas flow 4.3mL/min. The Octopole Reaction System was activated to improve the metal quantification because of the interferences by polyatomic species produced by a combination of isotopes coming from plasma, reagents and matrix. 103Rh was used as an internal standard (50mg/mL final concentration). Multi-element calibration standards were prepared in 5% HNO3 at four different concentrations (1, 10, 50 and 100mg/L). The standard addition approach for calibration on four concentration levels was used to minimize the matrix-induced variations. At least three replicates of each calibration standard were run. Moreover, to correct possible instrumental drifts, 103Rh was added as internal standard to all the samples and calibration standards. Each sample was measured in triplicate.
Volatile compounds and Fatty Acids Methyl Esters (FAME) analysis
Sample preparation for volatile compounds extraction: Olive pulps were crushed by liquid N2 treatment. 4g of each sample was weighed and dissolved in 4ml of n-hexane for the extraction of volatile compounds that was carried out on a shaking plate for 16 hours. Then the extracts were concentrated 5 times under nitrogen flow, transferred in vials and directly analysed by GC-MS.
Sample preparation for Fatty Acids Methyl Esters extraction (FAME): Each olive pulp was crushed by liquid N2 treatment. 4g of each sample was weighed and lyophilized for 16 hours. Then the methanolysis was carried out by adding to samples 500µl of methanolic HCl (125µl of acetyl chloride was added to 2, 5ml of methyl alcohol anhydrous). Samples transesterification was performed in a Reactiterm at 95°C for 16 hours. The supernatant (resulting fatty acids methyl esters) was concentrated under nitrogen flow and then suspended in 1ml of n-hexane. 1µl of each sample was analysed by GC-MS. FAME mix standard solution from Supelco (containing the methyl esters of palmitic acid, stearic acid, oleic acid, linoleic acid and arachidic acid) was used for GC-MS analysis both for identification and quantification. Each sample was measured in triplicate.
GC-MS analysis: GC-MS analyses were performed on a 5390 MSD quadrupole mass spectrometer (Agilent technologies) equipped with a gas chromatograph by using a Zebron ZB-5HT Inferno (5%-Phenyl-95%-Dimethylpolysiloxane) fused silica capillary column (Column 30m x 0.32mm x 0.10µm) from Phenomenex.
For fatty acids, the injection temperature was 250°C the oven temperature was increased from 90°C to 140°C at 10°C/min held for 1min, increasing to 280°C at 20°C/min and held for 3min and finally to 300°C at 10°C/min held for 5min. Electron Ionization mass spectra were recorded by continuous quadrupole scanning at 70eV ionization energy, in the mass range of m/z 40-550.
For volatile compounds, the injection temperature was 250°C the oven temperature was increased held at 40°C for three minutes and then increased to 150°C at 10°C/min, increasing to 230°C at 14°C/min and finally to 280°C at 15°C/min held for 5min. Electron Ionization mass spectra were recorded by continuous quadrupole scanning at 70eV ionization energy, in the mass range of m/z 40-550 analysis. Each sample was measured in triplicate.
Statistical analysis
Multivariate statistical analysis by using the Principal Component Analysis (PCA) was performed by XLStat 2016.5 version.
The analyses for all samples (5 variables) were performed: On 61 volatile compounds peaks area determined by GC-MS analyses; on 28 FAMEs peaks area determined by GC-MS analyses; on 25 metals detected by ICP-MS.
The parameters to perform PCA were summarized in supplementary materials, tables S1, S2 and S3 including minimum, maximum, mean and deviation standard values; no missing data was considerated.
RESULTS AND DISCUSSION
Olives are widespread plants all over the Mediterranean basin. The geographical origin as long as farming habits deeply influence the properties of the plant in terms of biomolecules and metals content, an analytical platform able to characterize such an heterogeneous molecular composition can be useful for a deeper knowledge of cultivars.
The study was developed on pools of fruits from two seasons thus reducing variations connected to seasonality.
Metals analysis
As previously described, metals can enter olive plants via multiple ways. The qualitative and quantitative determination of such elements play a pivotal role in assessing the geographical origin and the quality of cultivars. To this aim, the extraction from olive samples was performed as described in the previous section and the analyses were then performed by ICP-MS. The standard solution used in our workflow, contained a wide range of metals, to identify both nutrients (such as potassium and magnesium) and contaminant metals (such as cadmium and lead). Three replicates were realized for each sample and concentrations were reported as average value in mg/kg ± standard deviation (5%). Results are summarized in table 1.
|
Metals |
Concentration (mg/kg) |
||||
|
Bacoli |
Controne |
Guardia Sanframondi, Ortolana |
Guardia Sanframondi, Racioppella |
Sant’Angelo a Scala |
|
|
Be |
< 0.01 |
< 0.01 |
< 0.01 |
< 0.01 |
0.13 ± 0.01 |
|
B |
1.72 ± 0.09 |
5.15 ± 0.26 |
9.00 ± 0.45 |
5.14 ± 0.26 |
1.23 ± 0.06 |
|
Mg |
90.67 ± 4.53 |
175.1 ± 8.8 |
203.8 ± 10.2 |
311.0 ± 15.5 |
138.6 ± 6.9 |
|
Al |
< 0.01 |
< 0.01 |
6.46 ± 0.32 |
9.54 ± 0.48 |
< 0.01 |
|
K |
5035 ± 252 |
9973 ± 499 |
8540 ± 427 |
7128 ± 356 |
7144 ± 357 |
|
Ca |
19.34 ± 0.97 |
31.03 ± 1.55 |
66.25 ± 3.31 |
97.24 ± 4.86 |
25.19 ± 1.26 |
|
V |
< 0.01 |
< 0.01 |
0.028 ± 0.001 |
0.033 ± 0.002 |
< 0.01 |
|
Cr |
< 0.01 |
< 0.01 |
3.04 ± 0.15 |
3.04 ± 0.15 |
< 0.01 |
|
Mn |
0.49 ± 0.02 |
1.72 ± 0.09 |
2.43 ± 0.12 |
1.53 ± 0.08 |
1.69 ± 0.08 |
|
Fe |
< 0.01 |
2.40 ± 0.12 |
13.01 ± 0.65 |
8.67 ± 0.43 |
< 0.01 |
|
Co |
0.016 ± 0.001 |
0.14 ± 0.01 |
0.031 ± 0.002 |
0.022 ± 0.001 |
0.002 |
|
Ni |
< 0.01 |
< 0.01 |
1.57 ± 0.08 |
1.18 ± 0.06 |
< 0.01 |
|
Cu |
< 0.01 |
1.34 ± 0.07 |
9.89 ± 0.49 |
4.93 ± 0.25 |
1.46 ± 0.07 |
|
Zn |
1.24 ± 0.06 |
6.98 ± 0.35 |
14.70 ± 0.73 |
13.47 ± 0.67 |
6.98 ± 0.35 |
|
As |
0.005 |
< 0.01 |
0.055 ± 0.003 |
0.032 ± 0.002 |
< 0.01 |
|
Se |
< 0.01 |
< 0.01 |
0.029 ± 0.001 |
0.022 ± 0.001 |
< 0.01 |
|
Sr |
1.61 ± 0.08 |
0.52 ± 0.03 |
2.10 ± 0.11 |
3.18 ± 0.16 |
0.43 ± 0.02 |
|
Mo |
< 0.01 |
< 0.01 |
0.11 ± 0.01 |
0.066 ± 0.003 |
< 0.01 |
|
Cd |
0.003 |
0.0005 |
0.004 |
0.004 |
0.002 |
|
Sn |
< 0.01 |
< 0.01 |
0.14 |
0.098 |
< 0.01 |
|
Sb |
< 0.01 |
< 0.01 |
0.074 ± 0.003 |
0.046 ± 0.002 |
< 0.01 |
|
Te |
< 0.01 |
< 0.01 |
< 0.01 |
< 0.01 |
< 0.01 |
|
Ba |
< 0.01 |
0.021 ± 0.001 |
0.62 ± 0.03 |
0.72 ± 0.04 |
< 0.01 |
|
Tl |
< 0.01 |
< 0.01 |
0.003 |
0.002 |
< 0.01 |
|
Pb |
< 0.01 |
< 0.01 |
0.71 ± 0.04* |
0.25 ± 0.01* |
0.26 ± 0.01* |
Table 1: Metal concentration in mg/Kg in olive samples.
Note: *Above the legislative limits (Pb < 0.10mg/Kg).
Potassium, magnesium and calcium, resulted to be the predominant metals in all samples. In particular, potassium concentration was much above 1000mg/kg for each sample and this is typical of cultivars from volcanic (such as Bacoli) and mountainous lands (such as Controne, Guardia Sanframondi, Sant’Angelo a Scala). In Ortolana and Racioppella samples potassium, magnesium and calcium as long as other nutrients (Mn, Fe, Co, Ni, Cu and Zn) and trace metals (Al, Cr, V, As, Se, Sr, Mo, Sn, Sb, Ba, Tl) resulted slightly different.
As for contaminants, cadmium concentration resulted to be below the legal limit (< 0.05mg/kg) for all cultivars, while lead was above limit for Italian law (< 0.10mg/kg) for Guardia Sanframondi’s and Sant’Angelo a Scala’s samples, as reported in table 1, Ortolana contains 0.71mg/kg of lead, while Racioppella 0.25mg/kg and Sant’Angelo a Scala’s olives 0.26mg/kg.
Clearly the presence of such metals can be attributed to environmental pollution and/or farming conditions (Cu, Cd, Pb) [14,16].
Elemental composition is in perfect agreement with environmental analysis performed on the corresponding soil samples (data not shown).
PCA in figure 1 performed on the overall metals content shows an overall similararity, except for some minor differences in some cultivars.
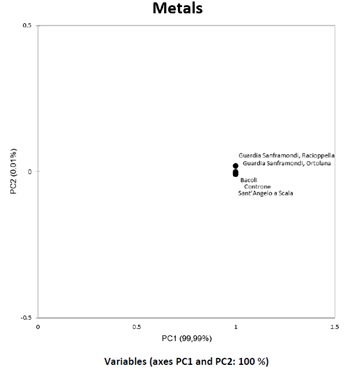 Figure 1: PCA of Metals in olive samples show the same trend in each cultivar.
Fatty Acids Methyl Esters (FAME) analysis
Fatty Acids (FA) content have a strict relation with oils stability and on oils aroma, the relative quantity of some of them (e.g. oleic/linoleic) might be representative not only of the quality but of the geographical origin of olives as well.
To obtain a profile of the fatty acids content for each cultivar, olive samples were pitted, crushed and then lyophilized. Methanolysis and transesterification were then performed to extract fatty acids methyl esters, which were then analysed by GC-MS. As an example, TICs of the GC-MS analyses of FAMEs from Ortolana (upper panel) and Racioppella (lower panel) are reported in figure 2. The identification of all analysed species was performed by comparing experimental mass spectra with the theoretical mass spectra in NIST library. The quantification of analytes was achieved by integrating chromatogram peaks areas and a FAMEs standard calibration curve, which was obtained using three different concentrations of standard fatty acids solution. Three replicates were realized and concentrations were reported as average value in mg/l ± standard deviation (5%).
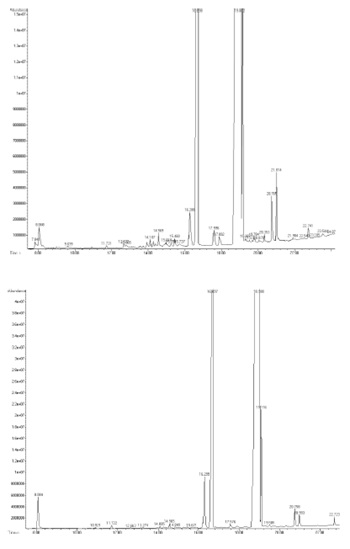 Figure 2: TICs of the GC-MS analyses of FAMEs from Ortolana (upper panel) and Racioppella (lower panel).
Concentration values were then converted in mg/g of fresh sample and results are summarized in table 2, reporting concentrations in mg/g of identified FAMEs for each cultivar.
|
Fatty Acids Methyl Esters |
Concentration (mgFAME/golives) |
|||||
|
Chemical Formula |
Bacoli |
Controne |
Guardia Sanframondi, Ortolana |
Guardia Sanframondi, Racioppella |
Sant’Angelo a Scala |
|
|
Long-Chain Saturated FA |
|
|
|
|
||
|
Palmitic acid |
16:0 |
75.00 ± 3.75 |
160.7 ± 8.0 |
53.80 ± 2.69 |
57.43 ± 2.87 |
150.9 ± 7.5 |
|
Margaric acid |
17:0 |
n.d. |
2.29 ± 0.11 |
n.d. |
n.d. |
n.d. |
|
Stearic acid |
18:0 |
7.80 ± 0.39 |
22.66 ± 1.13 |
0.21 ± 0.01 |
5.94 ± 0.30 |
39.73 ± 1.99 |
|
Behenic acid |
22:0 |
n.d. |
n.d. |
n.d. |
0.64 ± 0.03 |
3.25 ± 0.16 |
|
Lignoceric acid |
24:0 |
n.d. |
3.10 ± 0.16 |
n.d. |
n.d. |
n.d. |
|
Monounsaturated FA |
|
|
|
|
||
|
Oleic acid |
18:1 1n-9 |
543.8 ± 27.2 |
823.5 ± 41.2 |
111.1 ± 5.6 |
174.8 ± 8.7 |
1146 ± 57 |
|
Palmitoleic acid |
16:1n-7 |
11.45 ± 0.57 |
20.84 ± 1.04 |
1.98 ± 0.10 |
5.22 ± 0.26 |
18.22 ± 0.91 |
|
Cis-10- heptadecenoi c acid |
17:1 n-7 cis |
2.40 ± 0.12 |
n.d. |
0.85 ± 0.04 |
0.55 ± 0.03 |
3.99 ± 0.20 |
|
Monounsaturated Omega-9 FA |
|
|
|
|
||
|
Cis-11- eicosenoic acid |
20:1 n9cis |
3.10 ± 0.16 |
n.d. |
1.49 ± 0.07 |
1.26 ± 0.06 |
1.62 ± 0.08 |
|
Cis-13- eicosenoic acid |
20:1 n9cis |
n.d. |
5.07 ± 0.25 |
n.d. |
n.d. |
n.d. |
|
Omega-6 PUFA |
|
|
|
|
||
|
Linoleic acid |
18:2n-6 |
78.20 ± 3.91 |
139.8 ± 7.0 |
11.88 ± 0.59 |
16.33 ± 0.82 |
112.6 ± 5.6 |
|
Very-Long-Chain Saturated FA |
|
|
|
|
||
|
Arachidic acid |
20:0 |
3.39 ± 0.17 |
6.14 ± 0.31 |
1.72 ± 0.09 |
1.13 ± 0.06 |
7.99 ± 0.40 |
|
Hexacosanoic acid |
26:0 |
n.d. |
2.72 ± 0.14 |
n.d. |
n.d. |
n.d. |
|
FA Derivatives |
|
|
|
|
||
|
Azelaic acid |
|
n.d. |
2.70 ± 0.13 |
n.d. |
n.d. |
n.d. |
|
2,4- dimethylnona dioic acid |
|
n.d. |
n.d. |
n.d. |
n.d. |
3.75 ± 0.19 |
|
9,10- dihydroxy stearic acid |
9, 10-diOH C18:0 |
3.46 ± 0.17 |
5.58 ± 0.28 |
n.d. |
n.d. |
n.d. |
|
Hexadecanoic acid, dimethyl ester |
WE (2:0/16:0) |
n.d. |
2.61 ± 0.13 |
n.d. |
n.d. |
n.d. |
|
15-methyl- hexadecenoic acid |
15Met 15:1n-7 |
n.d. |
n.d. |
n.d. |
n.d. |
3.99 ± 0.20 |
|
14-hydroxy- 16,16- dimethoxy- 14-methyl hexadecanoic acid |
14,16,16- diOH C16:0 |
n.d. |
3.03 ± 0.15 |
n.d. |
n.d. |
n.d. |
|
Cis-3-octyl- oxiraneoctan oic acid |
n.d. |
5.02 ± 0.25 |
n.d. |
n.d. |
n.d. |
|
|
Other Compounds |
|
|
|
|
||
|
Citric acid |
15.53 ± 0.78 |
27.27 ± 1.36 |
1.44 ± 0.07 |
3.54 ± 0.18 |
3.45 ± 0.17 |
|
|
Malic acid |
2.83 ± 0.14 |
n.d. |
n.d. |
n.d. |
n.d. |
|
|
Endothall* |
n.d. |
3.17 ± 0.16 |
n.d. |
n.d. |
3.39 ± 0.17 |
|
|
3-metoxycarbo nylmetyl-5- oxocyclohesyl acetic acid |
|
3.42 ± 0.17 |
4.81 ± 0.24 |
n.d. |
0.51 ± 0.03 |
n.d. |
|
dimethoxyme thylbicyclo[2. 2.1.]heptane- 1 carboxylic acid |
|
n.d. |
15.42 ± 0.77 |
n.d. |
n.d. |
19.90 ± 0.99 |
|
Trans-3- penthyl- oxiraneundec anoic acid |
C18H33O3 |
n.d. |
2.22 ± 0.11 |
n.d. |
n.d. |
n.d. |
|
Cyclopropano ctanoic acid |
|
n.d. |
2.81 ± 0.14 |
n.d. |
n.d. |
n.d. |
Table 2: Fatty acids methyl esters, concentration is expressed in mgFAME/golives, the presence of herbicide is marked. n.d. not detected.
According to data reported in literature, the percentage of oleic acid in olives is between 60.2% and 75.0%, as it is influenced by many agronomical factors (olive variety, climatic conditions during growth, degree of maturation) [23] and practices related to irrigation treatment [24]; table 3A reports the percentage of oleic acid found in each sample.
|
|
Bacoli |
Controne |
Guardia Sanframondi. Ortolana |
Guardia Sanframondi. Racioppella |
Sant’Angelo a Scala |
|
% Oleic Acid |
72.5 ± 3.6 |
64.2 ± 3.2 |
60.2 ± 3.0 |
65.4 ± 3.3 |
75.0 ± 3.8 |
Table 3A: Oleic acid (methyl ester) percentage.
It should be noted that (in particular for cultivars Controne, Ortolana and Racioppella), the percentage of oleic acid is relatively low (ranging from 60.2% to 65.4%) if compared to the other two (Bacoli and Sant’Angelo a Scala) were the values are (respectively) 72.5% and 75%, thus suggesting the possibility of differentiating among different cultivars.
A further parameter to assess the quality of olives is measured by oleic/linoleic acid (O/L) content. According to literature data, O/L ratio is reported to be between 6 and 11 in olive fruits [23]; our results show that almost all values in analysed samples are included in this range, as shown in table 3B.
|
|
Bacoli |
Controne |
Guardia Sanframondi. Ortolana |
Guardia Sanframondi. Racioppella |
Sant’Angelo a Scala |
|
O/L |
6.95 ± 0.35 |
5.89 ± 0.29 |
9.35 ± 0.47 |
10.7 ± 0.5 |
10.1 ± 0.5 |
Table 3B: Oleic/linoleic ratio.
We could extract and identify other class of molecules such as citric acid. The presence of this organic acid is in fact connected to the colour of olives, quality and aroma [25,26]. The concentration of citric acid in Controne and Bacoli cultivars is remarkable (respectively 27.27mg/g and 15.53mg/g). Furthermore, we could identify not negligible quantities of Endothall (7-oxabicyclo [2.2.1] heptane-2,3-dicarboxylic acid), particularly evident in Controne and Sant’Angelo a Scala olives (respectively 3.17mg/g and 3.39). The presence of this herbicide (reported in table 2 and marked with an asterisk) could be related to the control of the weeds growth.
As predictable, PCA in figure 3 performed on identified FAMEs show an overall similarity among samples (in particular for Controne, Sant'Angelo a Scala and Bacoli olives) and some minor differences from the other two cultivars (Racioppella and Ortolana), this observation might be related to farming conditions (i.e. the use of Endothall) as long as to the geographical origin.
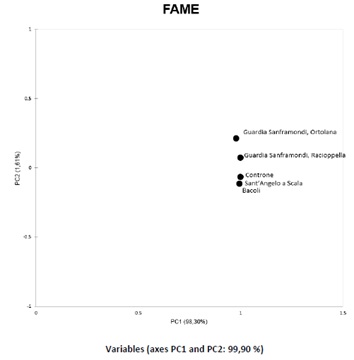 Figure 3: PCA of FAME in olive samples shows how Controne, Sant'Angelo a Scala and Bacoli are very similar, compared to the other two cultivars (Racioppella and Ortolana), this result may be related to geographical origin.
Volatile compounds analysis
Olive oil aroma is the result of the complex interaction of small volatile molecules and odor receptors [26] and it is considered as the first step in quality assessment. The maturity of the olive fruits and the type of cultivar influence the formation of volatile compounds and are important to determine the quality of olive oil. Most of the enzymes involved in the formation of volatile compounds through the lipoxygenase pathway, decreases their activity with fruit maturation, with a consequent reduction in the content of volatile compounds [27,28]. In order to extract volatile compounds, olive samples were submitted to solid-liquid extraction by using hexane, samples were then analyzed by GC-MS, as described in the Materials and Methods. As an example, TICs of the GC-MS analyses of VOCs from Ortolana (upper panel) and Racioppella (lower panel) are reported in figure 4. As previously described, the identification of analytes was performed by comparing experimental electron impact mass spectra of a given compound with the mass spectra in NIST library. A relative quantification of identified species was performed only on the peak areas. Analytes concentration was not calculated because of their heterogeneity, for which the use of a standard solution was not possible. Main and minor components are reported in table 4.
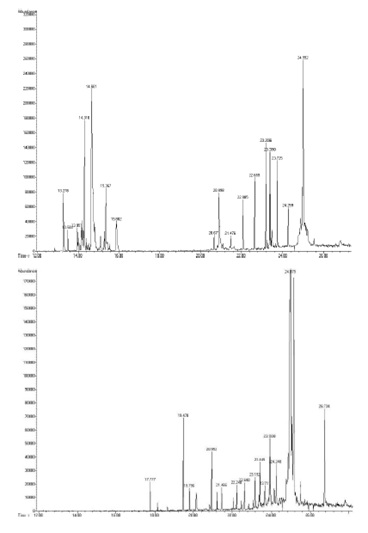 Figure 4: TICs of the GC-MS analyses of VOCs from Ortolana (upper panel) and Racioppella (lower panel).
|
VOC |
Chemical formula |
Bacoli |
Controne |
Guardia Sanframon di, Ortolana |
Guardia Sanframon di, Racioppella |
Sant’Angelo a Scala |
|
3-pentanol, 2,4- dimethyl- |
C7H16O |
n.d. |
n.d. |
n.d. |
1.39 ± 0.07 |
n.d. |
|
3-heptanol, 3,6- dimethyl- |
C9H20O |
n.d. |
n.d. |
n.d. |
1.31 ± 0.07 |
n.d. |
|
Cyclooctyl alcohol |
C8H16O |
1.17 ± 0.06 |
n.d. |
n.d. |
n.d. |
n.d. |
|
2-hexadecanol |
C16H34O |
3.59 ± 0.18 |
n.d. |
n.d. |
n.d. |
n.d. |
|
2-methyl-5-hexen-3-ol |
C7H14O |
n.d. |
n.d. |
n.d. |
0.99 ± 0.05 |
n.d. |
|
2,5-dimethyl-5-hexen-3- ol |
C8H16O |
n.d. |
n.d. |
n.d. |
6.01 ± 0.30 |
n.d. |
|
5-hexen-3-ol, 3-methyl- |
C7H14O |
n.d. |
n.d. |
1.04 ± 0.05 |
n.d. |
n.d. |
|
1-hepten-4-ol |
C7H14O |
n.d. |
n.d. |
0.17 ± 0.01 |
2.93 ± 0.15 |
n.d. |
|
2-nonen-1-ol |
C9H18O |
0.95 ± 0.05 |
n.d. |
n.d. |
n.d. |
n.d. |
|
1,7-nonadien-4-ol, 4,8- dimethyl- |
C11H20O |
n.d. |
n.d. |
7.30 ± 0.37 |
n.d. |
n.d. |
|
2-decen-1-ol |
C10H20O |
n.d. |
n.d. |
5.03 ± 0.25 |
n.d. |
n.d. |
|
E-2-tetradecen-1-ol |
C14H28O |
0.83 ± 0.04 |
n.d. |
n.d. |
n.d. |
n.d. |
|
Z,Z-2,5-pentadecan dien- 1-ol |
C15H29O2 |
n.d. |
1.64 ± 0.08 |
n.d. |
n.d. |
0.34 ± 0.02 |
|
3,7,11,15- tetramethyl- 2-hexadecen-1-ol |
C20H40O |
n.d. |
0.70 ± 0.03 |
n.d. |
n.d. |
n.d. |
|
2-octyn-1-ol |
C8H14O |
n.d. |
n.d. |
2.26 ± 0.11 |
n.d. |
n.d. |
|
2-nonyn-1-ol |
C9H16O |
n.d. |
n.d. |
0.68 ± 0.03 |
n.d. |
n.d. |
|
2-decyn-1-ol |
C10H18O |
n.d. |
n.d. |
1.05 ± 0.05 |
n.d. |
n.d. |
|
3-decyn-2-ol |
C10H18O |
n.d. |
n.d. |
1.51 ± 0.08 |
n.d. |
n.d. |
|
(2S,3S)-(-)-3- propyloxiranemethanol |
|
n.d. |
n.d. |
0.90 ± 0.05 |
1.87 |
n.d. |
|
Behenic alcohol |
C22H46O |
n.d. |
5.03 ± 0.25 |
n.d. |
n.d. |
n.d. |
|
Nonanal |
C9H18O |
n.d. |
0.38 ± 0.02 |
n.d. |
n.d. |
n.d. |
|
Dodecanal |
C12H24O |
n.d. |
0.27 ± 0.01 |
n.d. |
n.d. |
n.d. |
|
2-bromo octadecanal |
C18H35BrO |
n.d. |
5.04 ± 0.25 |
n.d. |
n.d. |
n.d. |
|
2-nonenal, (E)- |
C9H16O |
n.d. |
n.d. |
2.32 ± 0.12 |
n.d. |
n.d. |
|
2-decenal, (E)- |
C10H18O |
n.d. |
0.74 ± 0.04 |
n.d. |
n.d. |
n.d. |
|
13-tetradecenale |
C14H26O |
n.d. |
n.d. |
n.d. |
n.d. |
1.05 ± 0.05 |
|
Z-7-hexadecenal |
C16H30O |
1.23 ± 0.06 |
1.75 ± 0.09 |
n.d. |
n.d. |
n.d. |
|
10-octadecenal |
C18H34O |
n.d. |
n.d. |
n.d. |
9.37 ± 0.47 |
n.d. |
|
13-octadecenal |
C18H34O |
3.15 ± 0.16 |
n.d. |
n.d. |
n.d. |
n.d. |
|
Oleic acid, 3-hydroxy propyl ester |
C21H40O3 |
3.55 ± 0.18 |
3.93 ± 0.20 |
n.d. |
n.d. |
n.d. |
|
4-Fluoro-1-methyl-5- carboxylic acid, ethyl ester |
C7H9FN2O2 |
n.d. |
0.92 ± 0.05 |
n.d. |
n.d. |
n.d. |
|
9-octadecenoic acid, 2,2,2-trifluoroethyl ester |
C22H37F3O2 |
n.d. |
4.48 ± 0.22 |
n.d. |
n.d. |
n.d. |
|
9-octadecenoic acid (Z)-, phenylmethyl ester |
C25H42O2 |
n.d. |
0.67 ± 0.03 |
n.d. |
n.d. |
n.d. |
|
E-10,13,13-trimethyl-11- tetradecen-1-ol-acetate |
C19H36O2 |
n.d. |
3.26 ± 0.16 |
n.d. |
n.d. |
n.d. |
|
1-ethyldodecyl acrilate |
C18H35O3 |
n.d. |
n.d. |
n.d. |
n.d. |
2.34 ± 0.12 |
|
Oxalic acid, allyl nonyl ester |
C14H24O4 |
n.d. |
n.d. |
20.70 ± 1.03 |
n.d. |
n.d. |
|
Pentanoic acid, trimethyl ester |
C8H18O4 |
n.d. |
n.d. |
0.94 ± 0.05 |
n.d. |
n.d. |
|
Cyclopropanepentanoic acid, 2-undecyl-, methyl ester, trans- |
|
n.d. |
n.d. |
11.52 ± 0.58 |
n.d. |
n.d. |
|
Cyclopropanetetradecan oic acid, 2-octyl-, methyl ester |
|
n.d. |
n.d. |
2.08 ± 0.10 |
n.d. |
n.d. |
|
9-Octadecen-12-ynoic acid, methyl ester |
n.d. |
n.d. |
3.94 ± 0.20 |
n.d. |
n.d. |
|
|
Dodecanoic acid, 2- (acetyloxy)-1- [(acetyloxy)methyl]ethyl ester |
|
n.d. |
n.d. |
0.99 ± 0.05 |
n.d. |
n.d. |
|
Sulfurous acid, decyl 2- propyl ester |
|
n.d. |
n.d. |
5.20 ± 0.26 |
n.d. |
n.d. |
|
Isopropyl 5,11- dihydroxy-3,7,11- trimethyl-2-dodecenoate |
|
n.d. |
n.d. |
n.d. |
2.98 ± 0.15 |
n.d. |
|
Oxalic acid, allyl decyl ester |
|
n.d. |
n.d. |
n.d. |
4.26 ± 0.21 |
n.d. |
|
Hydroperoxide, heptyl |
n.d. |
n.d. |
1.72 ± 0.09 |
0.26 ± 0.01 |
n.d. |
|
|
ß-D-Mannofuranoside, farnesyl- |
|
n.d. |
n.d. |
n.d. |
8.17 ± 0.41 |
n.d. |
|
Oxetane, 2-methyl-4- propyl- |
|
n.d. |
n.d. |
1.99 ± 0.10 |
n.d. |
n.d. |
|
n- hexanesulphonylacetonit rile |
|
n.d. |
n.d. |
5.26 ± 0.26 |
n.d. |
n.d. |
|
2-Butanone, 3-methoxy- 3-methyl- |
|
n.d. |
n.d. |
0.23 ± 0.01 |
n.d. |
n.d. |
|
4,6-Bis(t-butyl)-2- (dimethylbenzyl)phenol |
|
n.d. |
n.d. |
1.81 ± 0.09 |
n.d. |
n.d. |
|
2,4-Bis(dimethylbenzyl)- 6-t-butylphenol |
n.d. |
n.d. |
4.82 ± 0.24 |
n.d. |
n.d. |
|
|
Pterin-6-carboxylic acid |
n.d. |
2.52 ± 0.13 |
n.d. |
n.d. |
0.83 ± 0.04 |
|
|
O-decylhydroxylamine |
0.87 ± 0.04 |
0.58 ± 0.03 |
n.d. |
n.d. |
0.60 ± 0.03 |
|
|
Nitrous-3-pyrroline |
n.d. |
n.d. |
n.d. |
n.d. |
1.60 ± 0.08 |
|
|
2-Myristynoyl- glycinamide |
|
3.44 ± 0.17 |
n.d. |
n.d. |
n.d. |
n.d. |
|
3,4-Bis-(methylthio)- quinoline |
|
n.d. |
0.36 ± 0.02 |
n.d. |
n.d. |
n.d. |
|
1-[2-Deoxy-ß-d-erythro- pentofuranosyl]pyrrole- 2,4-bisthiocarboxamide |
|
n.d. |
0.46 ± 0.02 |
n.d. |
n.d. |
n.d. |
|
11H- Cyclohepta[a]naphthalen -11-one, 9,10-dihydro- 9,9-dimethyl- |
|
n.d. |
0.40 ± 0.02 |
n.d. |
n.d. |
n.d. |
|
Oxirane, tetradecyl- |
n.d. |
0.48 ± 0.02 |
n.d. |
n.d. |
n.d. |
|
|
Squalene |
74.37 ± 3.72 |
62.62 ± 3.13 |
16.50 ± 0.83 |
60.46 ± 3.02 |
93.24 ± 4.66 |
|
|
Alpha-farnesene |
1.25 ± 0.06 |
n.d. |
n.d. |
n.d. |
n.d. |
Table 4: Percentage (based on peaks areas) of VOCs in all olive samples. (n.d. notdetected).
Thanks to our approach, we could identify 61 different molecules, which can be grouped into four main classes, namely terpenes, acids esters, alcohols and aldehydes (Table 4).
For example, our data (according to literature [29]) show that the amount of squalene is predominant in almost all analyzed cultivars, except for Ortolana variety, in which the major component is a derivative of oxalic acid (20.7 %). The high squalene content is one of the most important qualities for olives and for olive oils in fact, as already well known, this molecule represents one of the major cancer risk-reducing agent [30-32].
Among volatile compounds, we could identify many phenolic ones differently distributed between cultivars. Phenols, involved in defending plant organs from invading pathogens like bacteria, fungi and viruses, are also substrates for the browning reactions [33] and are very important for the sensory characteristics of olives [34,35].
All together volatile compounds are responsible for olives organoleptic properties, such as flavor and odor, according to sensory descriptors reported in literature [35-37]. In Bacoli olives for example, we could identify alpha-farnesene (1.25% of total VOC) which is responsible of a woody, green vegetative with a hint of a floral nuance. In Controne cultivar, nonanal (0.38%) and (E)-2-decenal (0.74%) are responsible for pungent greenery and coriander grass flavors respectively. In Ortolana variety methyl ester of pentanoic acid (0.94%) gives to the samples an unpleasant pungent odor while earthy flavor in Racioppella cultivar is due to the presence of 1-heptene-4-ol (2.93%).
PCA performed on identified VOCs is reported in figure 5, also in this case the general trend of the cultivars is quite similar, with the exception of some minor differences ascribable to the sensory descriptors previously highlighted and once again Ortolana show some differences from the other cultivars.
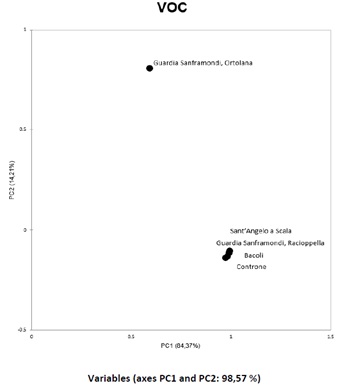
Figure 5: PCA of VOCs in olive samples shows a substantial difference between the Ortolana cultivar and the others.
CONCLUSION
We could identify more than 100 different analytes (metals, fatty acids and volatile compounds) distributed in five olive cultivars from small local producers located in four different areas of Campania region (Italy), Guardia Sanframondi (BN), Bacoli (NA), Sant’Angelo a Scala (AV), Controne (SA). Metals, FAMEs and VOCs analyses could be useful for the typization of cultivars and at the same time, for fraud discovery and contamination detection.
In fact, ICP-MS let us point out differences in metals content among cultivars, useful to possibly identify olives with a major nutritional intake and identify putative lead contamination in some samples.
Moreover, we could obtain the profile of probably the most important molecules under a nutritional aspect for olives: Fatty acids. Not only we could appreciate differences in terms of different categories content (Omega 6, Omega 9 etc), but also we could calculate important parameters to assess the quality of olives i.e. the amount of oleic acid and the definition of the oleic/linoleic ratio for each cultivar.
Finally, analysis of VOCs, led to the determination at a molecular level of the compounds responsible for olives organoleptic properties.
As a whole, our results give a thorough description at a molecular level of each cultivar. The methodology described in this study is fast, reproducible, sensitive and accurate and requires little sample handling.
Taken together, our results suggest similarities (as long as some peculiar differences) of olives under investigation and this is not surprising since olives were all harvested in the same Italian region; our approach though opens the way to future applications aimed at the identification of molecular markers of a cultivar from a specific geographical area.
ACKNOWLEDGMENT
Authors wish to thank European Union (FSE, PON Ricerca e Innovazione 2014-2020, Azione I.1 “Dottorati Innovativi con caratterizzazione Industriale”), for funding a PhD grant to Chiara Melchiorre.
CONFLICT OF INTEREST
All the Authors declare no conflict of interest.
AUTHOR CONTRIBUTIONS
CARPENTIERI Andrea collected data and drafted the manuscript.
VICCHIO Domenico prepared samples for mass spectrometry analysis.
FONTANAROSA Carolina performed mass spectrometry.
MELCHIORRE Chiara performed mass spectrometry analysis and data interpretation.
TRIFUOGGI Marco interpreted the results.
AMORESANO Angela designed the study and interpreted the results.
REFERENCES
- Bianchi G (2003) Lipids and phenols in table olives. European Journal of Lipid Science and Technology 105: 229-242.
- Tura D, Gigliotti C, Pedòa S, Failla O, Bassi D, et al. (2007) Influence of cultivar and site of cultivation on levels of lipophilic and hydrophilic antioxidants in virgin olive oils (Oleaeuropea L.) and correlations with oxidative stability. Scientia Horticulturae 112: 108-119.
- Garcia JM, Seller S, Perez-Camino MC (1996) Influence of fruit ripening on olive oil quality. Journal of Agricultural and Food Chemistry 44: 3516-3520.
- Nergiz C, Engez Y (2000) Compositional variation of olive fruit during ripening. Food Chemistry 69: 55-59.
- García-González DL, Aparicio-Ruiz R, Aparicio R (2008) Virgin olive oil-Chemical implications on quality and health. European Journal of Lipid Science and Technology 110: 602-339.
- Kiritsakis A, Kanavouras A, Kiritsakis K (2002) Chemical analysis, quality control and packaging issues of olive oil. European Journal of Lipid Science and Technology 104: 628-342.
- Nergiz C, Ergönül PG (2009) Organic acid content and composition of the olive fruits during ripening and its relationship with oil and sugar. Scientia Horticulturae 122: 216-345.
- Beltrán G, del Río C, Sánchez S, Martínez L (2004) Seasonal changes in olive fruit characteristics and oil accumulation during ripening process. Journal of the Science of Food and Agriculture 84: 1783-1790.
- Conde C, Delrot S, Gerós H (2008) Physiological, biochemical and molecular changes occurring during olive development and ripening. Journal of plant physiology 165: 1545-1562.
- Roca M, Mínguez-Mosquera MI (2001) changes in chloroplast pigments of olive varieties during fruit ripening. Journal of Agricultural and Food Chemistry 49: 832-839.
- Criado MN, Motilva MJ, Goñi M, Romero MP (2007) Comparative study of the effect of the maturation process of the olive fruit on the chlorophyll and carotenoid fractions of drupes and virgin oils from Arbequina and Fargacultivars. Food Chemistry 100: 748-755.
- Roca M, Mnguez-Mosquera I (2001) Change in the natural ratio between chlorophylls and carotenoids in olive fruitduring processing for virgin olive oil. Journal of the American Oil Chemists' Society 78: 133-138.
- Guardia-Rubioa M, Marchal-López RM, Ayora-Cañada MJ, Ruiz-Medina A (2007) Determination of pesticides in olives by gas chromatography usingdifferent detection systems. Journal of Chromatography A 1145: 195-203.
- Benincasa C, Lewis J, Perri E, Sindona G, Tagarelli A (2007) Determination of trace element in Italian virgin olive oils and their characterization according to geographical origin by statistical analysis. Analytica Chimica Acta 585: 366-370.
- Zeiner M, Steffan I, Cindric IJ (2005) Determination of trace elements in olive oil by ICP-AES and ETA-AAS: A pilot study on the geographical characterization. Microchemical Journal 81: 171-176.
- Reyes MNM, Campos RC (2006) Determination of copper and nickel in vegetable oils by directsampling graphite furnace atomic absorption spectrometry. Talanta 70: 929-932.
- Savarese M, De Marco E, Sacchi R (2007) Characterization of phenolic extracts from olives (Olea europaea Pisciottana) by electrospray ionization mass spectrometry. Food chemistry 105: 761-770.
- Cardoso SM, Guyot S, Marnet N, Lopes?da?Silva JA, Renard CMGC, et al. (2005) Characterisation of phenolic extracts from olive pulp and olive pomace by electrospray mass spectrometry. Journal of the Science of Food and Agriculture 85: 21-32.
- Lawson AM, Draffan GH (1975) Gas-liquid chromatography-mass spectrometry in biochemistry, pharmacology and toxicology. Prog Med Chem 12: 1-103.
- Jiménez MS, Velarte R, Castillo JR (2003) On-line emulsions of olive oil samples and ICP-MS multi-elemental determination. Journal of Analytical Atomic Spectrometry 18: 1154-1162.
- ?ahan Y, Basoglu F, Gücer S (2007) ICP-MS analysis of a series of metals (Namely: Mg, Cr, Co, Ni, Fe, Cu, Zn, Sn, Cd and Pb) in black and green olive samples from Bursa, Turkey. Food Chemistry 105: 395-399.
- Benincasa C, Hassine KB, Kammoun NG, Perri E (2012) Volatile and non-volatile compounds of single cultivar virgin olive oils produced in Italy and Tunisia with regard to different extraction systems and storage conditions. Intech Open, London, United Kingdom.
- Cerretani L, Maggio RM, Barnaba C, Toschi TG, Chiavaro E (2011) Application of partial least square regression to differential scanning calorimetry data for fatty acid quantitation in olive oil. Food Chemistry 127: 1899-1904
- Baccouri O, Cerretani L, Bendini A, Caboni MF, Zarrouk M, et al. (2007) Preliminary chemical characterization of Tunisian monovarietal virgin olive oils and comparison with Sicilian ones. European Journal of Lipid Science and Technology 109: 1208-1217.
- Ergonul PG, Nergiz C (2010) Determination of organic acids in olive fruit by HPLC. Czech J. Food Sci 28: 202-205.
- Benincasa C, De Nino A, Lombardo N, Perri E, Sindona G, et al. (2003) Assay of aroma active components of virgin olive oils from southern Italian regions by SPME-GC/ion trap mass spectrometry. J Agric Food Chem 51: 733-741.
- Salas JJ, Sánchez J (1998) Alcohol dehydrogenases from olive (Olea europaea) fruit. Phytochemistry 48: 35-40.
- Salas J, Willams M, Harwood JL, Sánchez J (1999) Lipoxygenase activity in olive (Olea europaea) fruit. Journal of the American 401Oil Chemists’ Society 76: 1163-1168.
- Owen RW, Mier W, Giacosa A, Hull WE, Spiegelhalder B, et al. (2000) Phenolic compounds and squalene in olive oils: The concentration and antioxidant potential of total phenols, simple phenols, secoiridoids, lignansand squalene. Food Chem Toxicol 38: 647-659.
- Pelucchi C, Bosetti C, Negri E, Lipworth L, La Vecchia C (2011) Olive oil and cancer risk: An update of epidemiological findings through 2010. Curr Pharm Des 17: 805-812.
- Hashim YZ, Eng M, Gill CI, McGlynn H, Rowland IR (2005) Components of olive oil and chemoprevention of colorectal cancer. Nutr Rev 63: 374-386.
- Song X, Wang X, Tan Y, Feng Y, Li W, et al. (2015) High production of squalene using a newly isolated yeast-like strain Pseudozyma sp. SD301. J Agric Food Chem 63: 8445-8451.
- Goupy P, Fleuriet A, Amiot MJ, Macheix JJ (1991) Enzymic browning, oleuropein content and diphenol oxidase activity in olive cultivars (Olea europaea). J Agric Food Chem 39: 92-95.
- Bendini A, Cerretani L, Carrasco-Pancorbo A, Gómez-Caravaca AM, Segura-Carretero A, et al. (2007) Phenolic molecules in virgin olive oils: A survey of their sensory properties, health effects, antioxidant activity and analytical methods. An overview of the last decade. Molecules 12: 1679-1719.
- Kalua C, Allen M, Bedgood D, Bishop A, Prenzler P et al. (2007) Olive oil volatile compounds, flavour development and quality: A critical review. Food chem 100: 273-286.
- Iraqi R, Vermeulen C, Benzekri A, Bouseta A, Collin S (2005) Screening for key odorants in moroccan green olives by gas chromatography-olfactometry/aroma extract dilution analysis. J Agric Food Chem 53: 1179-1184.
- Aponte M, Ventorino V, Blaiotta G, Volpe G, Farina V, et al. (2010) Study of green Sicilian table olive fermentations through microbiological, chemical and sensory analyses. Food Microbiol 27: 162-170.
SUPPLEMENTARY TABLES
|
Variable |
VOCs Observations |
Obs. With Missing Data |
Obs. Without Missing Data |
Minimum |
Maximum |
Mean |
Std. Deviation |
|
Bacoli |
61 |
0 |
61 |
0,002 |
74,370 |
1,548 |
9,521 |
|
Controne |
61 |
0 |
61 |
0,001 |
62,620 |
1,578 |
8,044 |
|
G.S.Ortolana |
61 |
0 |
61 |
0,001 |
20,700 |
1,639 |
3,817 |
|
G.S.Racioppella |
61 |
0 |
61 |
0,002 |
60,460 |
1,639 |
7,880 |
|
Sant’Angelo a Scala |
61 |
0 |
61 |
0,003 |
93,240 |
1,639 |
11,930 |
Table S1: Summary of data used to perform PCA of volatiles compounds in all olive samples.
|
Variable |
Fame Observations |
Obs. With Missing Data |
Obs. Without Missing Data |
Minimum |
Maximum |
Mean |
Std. Deviation |
|
Bacoli |
28 |
0 |
28 |
0,001 |
543,800 |
26,799 |
103,251 |
|
Controne |
28 |
0 |
28 |
0,001 |
823,500 |
45,181 |
157,353 |
|
G.S.Ortolana |
28 |
0 |
28 |
0,001 |
111,100 |
6,588 |
22,913 |
|
G.S.Racioppella |
28 |
0 |
28 |
0,001 |
174,800 |
9,548 |
34,236 |
|
Sant’Angelo a Scala |
28 |
0 |
28 |
0,001 |
1146,000 |
54,242 |
216,781 |
Table S2: Summary of data used to perform PCA of FAMEs in all olive samples.
|
Variable |
Metals Observations |
Obs. With Missing Data |
Obs. Without Missing Data |
Minimum |
Maximum |
Mean |
Std. Deviation |
|
Bacoli |
25 |
0 |
25 |
0,003 |
5035,000 |
206,010 |
1006,206 |
|
Controne |
25 |
0 |
25 |
0,001 |
9973,000 |
407,901 |
1993,038 |
|
G.S.Ortolana |
25 |
0 |
25 |
0,003 |
8540,000 |
354,963 |
1705,728 |
|
G.S.Racioppella |
25 |
0 |
25 |
0,002 |
7128,000 |
303,529 |
1423,197 |
|
Sant’Angelo a Scala |
25 |
0 |
25 |
0,002 |
7144,000 |
292,804 |
1427,604 |
Table S3: Summary of data used to perform PCA of metals in all olive samples.
Citation: Carpentieri A, Vicchio D, Fontanarosa C, Melchiorre C, Trifuoggi M, et al. (2020) Molecular Characterization of Olive Cultivars from Italy (Campania): A Mass Spectrometry Approach. J food Sci Nutr 6:052.
Copyright: © 2020 Andrea Carpentieri, et al. This is an open-access article distributed under the terms of the Creative Commons Attribution License, which permits unrestricted use, distribution, and reproduction in any medium, provided the original author and source are credited.