Near and Mid Infrared Spectroscopy to Assess Milk Products Quality: A Review of Recent Applications
*Corresponding Author(s):
Virgílio AnjosDepartment Of Physics, Federal Universityof Juiz De Fora, R. José Lourenço Kelmer, Juiz De Fora, CEP 36036-900, Juiz De Fora - MG, Brazil
Tel:+55 3221023307/234,
Email:virgilio.anjos@ufjf.edu.br
Abstract
The requirement of food safety and the recently increase in the consumption of dairy products in worldwide have drawn great attention for potential researches in these areas. Dairy products as milk, cheese, milk powder, whey milk powder, whey concentrated and isolated powder have a considerable demand and so are vulnerable to economic adulteration. Techniques of infrared spectroscopy have been used not only for the authenticity of dairy products, but also to their determination of quality, assisting issues as cheese ripening, composition and contamination. Based upon these applications and considering the importance of monitoring food quality this review presents some of the latest researches using infrared spectroscopy techniques for assessing intrinsic quality of dairy products.
Keywords
Adulteration; Dairy products; Food quality; Spectroscopic techniques
INTRODUCTION
Milk and dairy products are important sources of nutrients for human health [1]. In the last years, it has been observed an increase in their consumption. More than 6 billion people worldwide consume milk and milk products, which make them of paramount commercial importance within the food industry and plays an important role in the country’s economy [2,3]. Besides, great attention has been paid to the development of innovative and high-value dairy products that better fit consumers’ desires, which are mainly related to functional aspects important for human nutrition and health [1]. At the same time, over the past decade, the authentication of milk products has become a crucial issue once several major adulteration events were discovered [4]. The replacement of original substance partially or completely with more easily available and cheap compound is the most common procedure performed by defrauders. Those products presenting high-value and, which undergo a number of processing steps before they appear on the market are the most vulnerable for adulteration [5,6]. Fraud not only generates a product with food quality problems, but can also pose serious threats to consumers’ health [4,7]. Moreover, there are other problems, such as the contamination of milk by residues of veterinary drugs that may be present when the cow is milked in the grace period. The most common drugs are antimicrobials and anti-inflammatories [2,8,9]. Therefore, the determination of food quality and authentication is an important issue for final consumer’s satisfaction, food processors and regulatory authorities [10]. For this, it is important to ensure the ingredient authenticity by monitoring continuously their quality in food industry, through the development of sophisticated and accurate standardized new techniques [7,11].
Infrared spectroscopy is increasingly the most used method for determining authenticity and adulteration in foods [12] and one of the most relevant technologies in the analysis of raw materials, process control and specifications of final products in the dairy industry [1]. Techniques like Near-Infrared (NIR) and Mid-Infrared (MIR) have been successfully applied in the assessment of milk and dairy products quality, including milk powder, whey, WPCs and cheeses [13-17]. Figure 1 furnishes some analysis using MIR infrared for some types of cheeses and whey protein concentrate.
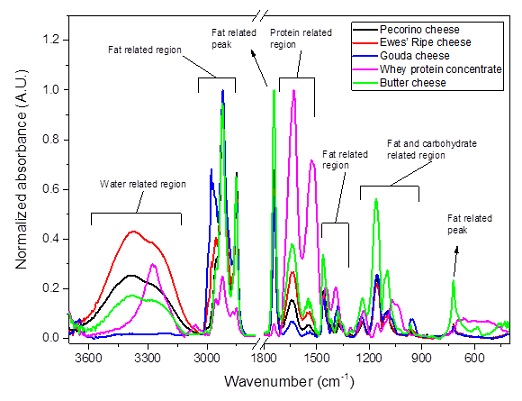
Figure 1: MIR infrared spectra of some types of cheeses and whey protein concentrate [13,14,18].
The infrared spectroscopy techniques are based on the analysis of the interaction between electromagnetic waves and matter [19] and the figure 2 shows a representation of this interaction.
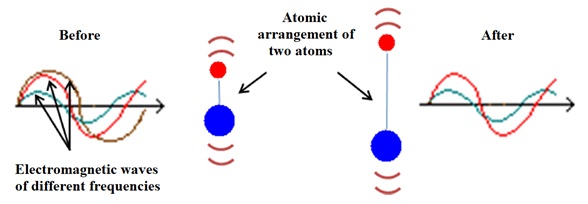
Figure 2: Representation of the interaction between electromagnetic waves and matter. Electromagnetic waves of three distinct frequencies reach an atomic arrangement of two atoms. Only the electromagnetic wave with frequency represented by the brown color is absorbed by the atomic arrangement, which begins to vibrate with greater amplitude [20].
The basic assumption behind the application of optical spectroscopic techniques to the quality evaluation of foods relies on the generation of a ‘‘fingerprint’’. An individual dairy product with a given chemical composition exposed to a light source will produce a characteristic spectrum, which is the result of the absorption of the electromagnetic energy by the various chemical constituents of the food [6].
Infrared spectroscopy has the advantage of being non-destructive and is suitable for use in a research laboratory or in an industrial environment (in online and online applications at different stages).
Laboratory techniques are generally developed and used mainly in research before the technology is applied in the industrial field. During this period, experiments carried out determine basic principles and obstacles and propose new methodologies to face problems and improve results [21]. Regarding the industrial setting, overall, the in-line applications are limited, but they refer to process control through the monitoring of crucial traits (e.g., recording of real-time production data) that allow rapid action and cost saving. The on-line applications are mainly related to end product labeling specification based on the development of prediction models using reference methods [1]. Both applications can increase efficiency, improve profitability, and enhance quality of the products. Thus, tinfrared spectroscopy techniques provide an alternative to the traditional analytical strategies that normally are relied on wet chemistry to determine the amount of a marker compound or compounds in a suspect material [6]. Besides, most of them make use of hazardous chemicals, are labour intensive and time-consuming with requirements of extensive sample preparation, as well as skilled and experienced staff [7].
NIR infrared spectroscopy uses the near-infrared region of the electromagnetic spectrum (from 750 - 2500 nm or 14290 - 4000 cm-1) and is based on molecular overtone and combination vibrations [8,22]. The spectra can be recorded in reflection, transmission, or interactance modes providing complex chemical and physical information. In particular, overtones and combinations of the vibrations such as C-H, O-H, N-H, and C=O make it possible the measurements of various structures [23].
MID infrared spectroscopy (from 2500 - 25000 nm or 4000 - 400 cm-1) monitors the fundamental vibrational and rotational stretching modes of molecules, which reflect the chemical profile of the sample [8,22,24]. Once the technique measures the fundamental vibrations instead of the overtones and combination bands measured in the NIR region, it provides a greater amount of chemical information regarding the scanned sample. The main bands obtained in the MIR spectra belong to two distinctive regions: the one called “functional group” (4000 to 1500 cm-1) and the one known as “fingerprint region” (1500 to 500 cm-1) [4]. However, most of the relevant information that is used to interpret MIR spectra is usually obtained from the functional group region, where as the fingerprint region is normally complex. It contains a lot of structural rather than functional group information, and many overlapped bands because each different compound produces a different and unique absorption pattern in this region [25].
Once NIR and MIR spectra contain large quantities of data that require processing, infrared methodologies are generally supported by chemometrics, defined as an inter-disciplinary field that uses methods such as multivariate statistics, mathematics and computer science for extracting information from chemical systems [26,27]. It can be based on unsupervised pattern recognition (principal component analysis - PCA, hierarchical cluster analysis - HCA), supervised classification (partial least squares-discriminant analysis - PLS-DA, soft independent modeling of class analogy - SIMCA, linear discriminant analysis - LDA, canonical variate analysis - CVA, artificial neural network - ANN) and multivariate calibration (partial least squares - PLS, principal component regression - PCR) [22]. The chemometric approaches can enhance significantly the potential applications of infrared spectroscopy techniques [23].
Considering the importance of monitoring food quality this review presents some of the latest researches using infrared spectroscopy techniques for assessing intrinsic quality of dairy products.
RECENT APPLICATIONS OF INFRARED SPECTROSCOPY FOR DAIRY PRODUCTS QUALITY EVALUATION
Since the 1960s, many studies have been carried out using infrared spectroscopy applied to the food industry, mainly dairy products [2,28,29]. In 1961, Goulden performed a quantitative analysis of milk and other emulsions using infrared absorption [30]. FT-MIR and FT-NIR are spectral complementary techniques, so they have advantages and disadvantages. FT-MIR is the worldwide method of choice for composition and quality controls during routine liquid milk testing. It allows a fast, nondestructive quantification of milk chemical properties to avoid reference methods, which are usually tedious, expensive, and time consuming [31]. MIR is good for qualitative and quantitative identification and presents well-defined bands for organic functional groups [32], fat, protein, lactose that are part of the milk composition. Medium infrared devices generally use a minimum sample volume for milk analysis compared to NIR equipment. However, its main disadvantages are presence of the huge band of absorption of water, since milk consists of about ~87 % water [2]. The need for sample preparation (in the absence of ATR) is another disadvantage of FT-MIR [32] and for milk analysis there is still the experimental complexity. Expensive transmitting materials [32], the Mid-infrared devices generally are much more expensive. In this respect, the NIR stands out. The NIR has advantages: simple and cheaper transmission instruments with glass optics and cheaper and less expensive light source compared to the MIR. For dairy analyzes, the samples are checked daily, therefore, for this purpose, the NIR is economically advantageous. Weak absorption due to water over to NES enables analysis of high moisture product. The NIR is not influenced by CO2 eliminating instrument purging and extremely high signal-to-noise in spectral data [32].
Many studies indicate that NIR can predict the chemical composition of milk and dairy products and can monitor the cutting-point during cheese manufacturing. Other studies have demonstrated the potential of NIR to predict sensory characteristics (for example, hardness and tenderness) of dairy products [33]. Liu et al., [31] reports different approaches to detect some potential biomarkers in milk. However, they furnish accurate results after a complex sample preparation and professional instrument operation. The advantages of NIR spectroscopy also include fast and a simultaneous, non-destructive measurement of a number of milk constituents and potential for online analysis [17]. The information of spectra relates to overtones and combinations of vibrations of some characteristic bonds, such as C-H, N-H, O-H and S-H, which typically exist in all organic molecules [31]. The disadvantage of NIR is that the spectra are less pronounced making the signal differences more subtle. According Quet al., [23] NIR has limited capacity for estimating heterogeneous samples. Generally, it cannot identify components with concentration less than 1% [32]. Moreover, low precision and subjectivity of the reference methods are also constraint for its applications. Consequently, robust calibrations are needed with regard to better sampling procedures and improvement of reference methods. For example, relies on statistical methodology - PCA, PLS, SIMCA [32].
MILK
Dairy products such as milk, consumed worldwide, have high nutritional value. However, some suppliers often add adulterants such as starch, melamine, sodium, citrate, sucrose, urea, water, whey and other components into milk and thus get a higher profit [34,35]. The adulterate milk will not only cause the risk of illnesses among people, but also lead to considerable losses for the dairy industry, once the milk quality plays a very important role in the production of all types of dairy products, as cheeses for example, affecting both cheese yield and characteristics of the cheese [36].
Thus, from both the commercial and the health perspectives, milk adulterations have become a serious problem in the food industry and therefore techniques such as infrared spectroscopy can assist against this type of practice [34].
NIR infrared was successfully applied to discriminate raw cow milk from those adulterated with different pseudo proteins and thickeners [37] and melamine, which is a nitrogen-rich substance noxious to human health [38]. Also melamine addition was investigated in powdered milk products [39-41].
Mid-infrared spectroscopy is widely used in raw milk by processors for standardization purposes before milk transformation, by dairy industry for milk payment, and by farmers, technicians, and companies, which used several milk phenotypes [42]. Bassbasiet al., [43] have employed the technique to the fast and non-destructive quantitative determination of Solid Nonfat (SNF) content in raw milk. SNF is an important nutritional parameter of raw milk, once compasses the entire residue left after the complete evaporation of water from milk; and therefore has a significant effect on the milk quality.
Botelhoet al., [35] were able to perform the simultaneous detection of five adulterants (water, starch, sodium citrate, formaldehyde and sucrose) in raw cow milk by using MID infrared spectroscopy and multivariate supervised classification. For each type of adulterant, it could be observed a specific area of the spectrum differentiating from the original milk spectrum. Regarding formaldehyde adulteration, a distinguishable peak around 1000 cm-1could be noted. In sucrose adulteration, the differentiation was found associated with the appearance of several peaks in the fingerprint region (near 1200 - 1000 cm-1). At the same line of research, Gondimet al., [44] studied a sequential strategy to detect common adulterants in milk, including water, thickeners, preservatives and neutralizing agents. It was used the Soft Independent Modelling of Class Analogy (SIMCA) classification technique applied to Mid-Infrared (MIR) data, using the cross-validation method for the construction of the models.
Luiz et al., [2] analyzed the veterinary drugs tetracycline, enrofloxacin, penicillin, ceftiofur hydrochloride and diclofenac sodium by means of PCA-associated Fourier Transform Near-Infrared Spectroscopy (FT-NIR) to fast and accurately detect residues of these drugs in milk samples. With their results, they were able to discriminate different types of antimicrobials dissolved in milk within the maximum residue limits allowed by the European Medicines Agency and the Ministry of Agriculture, Livestock and Supply of Brazil. In addition, its methodology was able to detect real samples milked on different days after the injection of ceftiofur hydrochloride, which is, in principle, a zero antimicrobial grace period.
Recently Teixeira et al., [9] established spectroscopic patterns of antibiotics isolated and in the presence of milk, in order to contribute with another tool for the detection of minimum amounts of these compounds quickly and accurately. For that, they used vibrational spectroscopy and theoretical calculations based on Density Functional Theory in bovine milk.
WHEY AND ITS PRODUCTS
Nowadays there is an increased demand for products with healthy and high nutritional properties; therefore, the dairy industry has recognized the value of whey proteins [45]. Whey constitutes about 85-90% of the volume of the milk used in the cheese production and it retains about 55% of the milk nutrients [46]. Even though it’s high concentration of good nutrients, whey was historically considered as a waste product and environmental pollutant, with no commercial use [47]. However, nowadays this by-product of cheese-making is getting new technical and nutritional applications [47-49].The whey proteins can be incorporated in several food products to maintain the functional and nutritional value and also can be used in the sports nutrition market, as nutritional supplements [45,47,49]. In this area Whey Protein Concentrate (WPC), Whey Protein Isolate (WPI) and Whey Protein Hydrolysates (WPH) are the main examples. They contain 65-80% and above 90% of protein on a dry basis, respectively, being rich in essential amino acids, bioactive peptides and antioxidants [50,51]. However due the fact of being high added value products, WPC and WPI have been target for adulteration with cheaper components [52], as carbohydrates, amino acids derivatives and thermogenic substances [15,53].
Spectroscopy methodologies have been used in studies with whey and its products [13,45,54-58]. O’Loughlin et al., [55] investigated thermal denaturation of whey protein solutions, characterizing the changes occurring in whey protein dispersions upon heat treatment through physical analysis of solutions and intra- and intermolecular level analysis using infrared spectroscopy. According to the authors, the use of Infrared (IR) spectroscopy for discerning protein structure (2° and 3°) is comparably fast and inexpensive in relation to other methods. Their results demonstrated that in homogeneous protein systems, MIR infrared is a useful tool in discerning the structural alterations relating to physical properties.
Kucheryavskiy and Lomborg [57] evaluated whey composition using Near-Infrared (NIR) spectroscopy while Partial Least Squares (PLS) regression was used to make the prediction models. The liquid whey quality parameters during protein production process monitored were total solids, lactose, protein and fat content. The results demonstrated high precision and accuracy models for prediction of fat, protein and total solids, which makes the technique applicable to use on production scale for on-line monitoring of quality parameters during the filtration process.
Regarding the issue of authentication and adulteration up to now there is no much research work regarding the use of the infrared spectroscopy to the evaluation of adulterations in WPC and WPI. The only few recent works were developed [13,56,59].
Wang et al., [56] developed a simple and rapid method to differentiate whey protein types (WPC, WPI, and WPH) used for beverage manufacturing by combining the spectral signature collected from portable mid-infrared spectrometers and pattern recognition analysis. The results showed that the major bands centered at 1640and 1580 cm−1 were responsible for separation and were associated with differences in amide I and amide II vibrations of proteins, respectively. In general, Attenuated Total Reflectance (ATR) spectroscopy combined with pattern recognition chemometrics had the ability to distinguish and authenticate the commercial whey protein ingredients in the infrared region.
Andrade et al,, [13] evaluated the potential application of Fourier-Transform Infrared Attenuated Total Reflectance (FTIR-ATR) to detect adulteration of Whey Protein Concentrate (WPC) by milk whey powder (MWP). It was found that the range between 1700 to 1500 cm-1 presented the highest peaks, characteristics of Amide I (ν C=O, ν C-N) in 1640 cm-1 and Amide II in 1550 cm-1 (δ N-H, ν C-N), and with significant distinction among the samples. The spectra characterization was made through Principal Component Analysis (PCA) and Partial Least Squares (PLS) regressions were applied to model and predict the protein content and the amount in grams of WPC and MWP in the samples. As final conclusions the authors demonstrated that the association of FTIR-ATR spectroscopy with multivariate approaches has strong potential to detect adulteration in nutritional supplements and high accuracy to predict simultaneously the protein content and mass of WPC and MWP added.
Rocha et al,, [60] used Raman spectroscopy, a complementary technique which usually is a complementar technique to the infrared absorption, associated with artificial neural network for quantify adulteration of fluid milk by addition of whey
CHEESES
Cheese is the most abundant processed dairy product in the world and provides consumers with important and essential nutrients [61]. In Brazil, about 70% of the total milk produced is processed into cheeses, where approximately 1100 tons are consumed within the domestic market per year [62]. Thus, the quality control of cheeses is of paramount importance.
Several authors have attested the cheese quality using infrared spectroscopy, once usual methods are normally time consuming and expensive. Most of the works are in relation to cheese ripening, composition and authenticity or authentication.
In 2005, AOAC international has approved the Fourier Transform Infrared (FTIR) method for determination of fat, protein, lactose and total solid contents in some dairy products [63]. Since then, studies on cheese ripening using spectroscopic methods have been published [64-70]. A recent and important work in this field was carried out [14]. They evaluated the ripening changes over time of special cheeses (Pecorino, ewes’ ripe, and Gouda) made with ewes’ milk using FTIR/ATR spectroscopy during approximately one year. The study was able to detect the proteolysis and lipolysis, which are primary reactions that define cheese ripening. Overall it was observed a downward trend of the absorbance intensity of the amide group peaks (1700 to 1500 cm−1), which are linked to the breakdown of peptide bonds. Similar behavior was obtained for the lipidic region (3000 to 2800 cm−1 and 1765 to 1730 cm−1). The proteolysis occurred in a fast pace during the first trimester of the ripening process, and the lipids were converted to smaller species as the time goes by. Hierarchical cluster analysis and principal component analysis allowed the evaluation of the physicochemical changes of the cheeses.
Regarding cheese adulteration and authenticity it can be cited [10,18,71]. Hruzikova et al., [10] developed a method for authenticity control of cheese products, which is based on the measurement of infrared spectra of the gas phase obtained by heating selected cheese under controlled conditions. The method was tested for the authenticity control of two cheese families. Cuibuset al., [71] have done a study to compare some traditional Romanian cheeses and adulterated ones using ATR-FTIR coupled to chemometrics. It was carried out a Partial Least Squares Integrated Fourier Transform Infrared (FTIR-PLS) strategy to reveal the adulteration of Dalia cheeses with fats bellowing to Palm Oil.The results proved that FTIR-PLS is a reliable technique for discriminate the adulterated cheeses with palm oil.
A recent work with the application of MIR infrared spectroscopy for the detection of adulteration was performed with butter cheeses adulterated with soybean oil in levels of 0 to 100% of replacement [18]. The main bands obtained in the spectra were related to the presence of water, lipids and proteins, which belong to the “functional group” region (4000 to 1500 cm-1) [4]. Overall, regarding the lipids related bands there was an increase in the absorbance values up to 70% of adulteration. However, the band near 3007 cm-1 which represents stretches of groups -C=CH (cis-) of double bonds in unsaturated fatty acids [72,73] was the only one in which there was a regular increase in the absorbance values because of the increase of soybean oil content in the cheeses, even in those with adulterations of 80%, 90% and 100%. Also, another aspect observed in this peak and which was used to characterize the adulterations was the band shift. Therefore it was found that the proportion and composition of unsaturated fatty acids (highly present in soybean oil, but in low concentrations in butter oil) affect the position and intensity of this band, proving fraud. Major mid-infrared bands associated with milk are presented in table 1.
|
Wavenumber (cm-1) |
Origin |
Assignment |
Reference |
|
900 to 1200 |
Lactose |
C-O-C stretch |
[74] |
|
1045 |
|
C-O stretchingvibration |
[29] |
|
2800 to 3000 |
Carbohydrates |
C-H stretch |
[75] |
|
800 to 1400 |
|
Skeletalstrechingandbending |
[75] |
|
1550 |
Protein |
Peaks of C-N and N-N |
[29] |
|
1600 to1695 |
Casein |
Amide I (C=O stretch) |
[76][77] |
|
1520 to1560 |
|
Amide II (N-H bending and C-N stretch) |
[76][77] |
|
1230 to1300 |
|
Amide III |
[76] |
|
1060 to 1100 |
|
O= P–O stretch |
[78][74] |
|
1725 to 1745 |
Fat |
C = O stretch |
[76][75] |
|
970 |
|
C=C-H bending |
[75] |
|
2800 to 3000 |
|
C-H strech |
[75] |
|
1520 to 1650 |
WheyProtein |
Amide I and Amide II |
[79][74] |
|
1632 |
|
Amide I (C=O stretch) |
[59] |
|
1531 |
|
Amide II (N-H bendingand C-N stretch) |
[59] |
|
1200 to 1400 |
|
C-H groups of aliphatic hydrocarbons Amide III |
[79] |
|
1390 |
|
C=O stretch in the COO- |
[79] |
|
1250 |
|
Amide III (C-N) |
[59] |
|
1750 |
|
Lipids C=O |
[59] |
|
1450 |
|
C-H bonds in CH2 groups |
[59] |
|
1392 |
|
C=O in carboxylic acid |
[59] |
|
1100 to 1130 |
|
C-OH stretch, C-C and C-O-C |
[59] |
|
900 to1200 |
|
C-O-C and C-O vibration of carbohydrates |
[79][74] |
|
1730 to 1765 |
Triglycerides |
C=O strecth |
[74][80] |
|
2925 |
|
Methyleneasymmetricstretching |
[80] |
|
2850 |
|
Methyleneasymmetricstretching |
[80] |
|
1475 |
|
Methyleneacissoring |
[80] |
|
1385 |
|
Methylsymmetricdeformation |
[80] |
|
1400 to 1477 |
Lipds |
C-H stretch |
[74] |
|
3680 |
Water |
O-H symmetric and antisymmetric streching vibration of water |
[81] |
|
3200 to 3600 |
|
O-H stretching |
[75] |
|
1650 |
|
H-OH stretching |
[75] |
|
1020 to 1282 |
Phospholipid |
|
[82] |
|
1055 to 1070 |
|
P-O-C |
[83] |
|
970 |
|
Asymmetrical C-N stretch of (CH3)N+ |
[84] |
|
970 to 1200 |
|
P-O-C + PO2 |
[85][84] |
|
1025 |
|
Symmetricalester C-O-P strech |
[84] |
|
1243 |
|
Asymmetricalphosphatediester PO2- |
[84] |
|
1090 |
|
Symmetrical phosphate diester stretch of PO2- |
[84] |
|
1173 |
|
Asymmetrical C-O stretchof C=O-O-C |
[84] |
|
400 to 1000 |
Melatonin |
|
[86] |
|
3200 to 3400 |
|
|
[86] |
|
1680 |
|
|
[87] |
|
1400 to 1500 |
|
|
[87] |
|
800 |
|
|
[87] |
|
900 |
|
|
[87] |
|
980 |
|
|
[87] |
Table 1: Wavenumbers of mid Infrared bands and their assignments.
Some important near-infrared bands associated with major components found in milk are summarized in table 2.
|
Wavenumber (cm-1) |
Origin |
Assignment |
Reference |
|
4775 |
Lactose |
O-H combination |
[88] |
|
4273 |
|
|
[17] |
|
5494 |
|
|
[17] |
|
6897 |
|
|
[17] |
|
5255 |
Polysaccharide |
OH stretchand HOH |
[81] |
|
8278 |
Protein |
2nd overtone C-H stretch |
[75] |
|
5767 |
|
1nd overtone C-H stretch |
[75] |
|
4000 to 4600 |
|
CH2 |
[81] |
|
4878 |
|
N-H/amide2ndor N-H/amide 3rdorcombination |
[88] |
|
4273 |
Casein |
|
[17] |
|
4329 |
|
|
[17] |
|
4762 |
|
|
[17] |
|
5050 |
|
|
[17] |
|
5495 |
|
|
[17] |
|
5618 |
|
|
[17] |
|
5780 |
|
|
[17] |
|
5814 |
|
|
[17] |
|
5952 |
|
|
[17] |
|
6897 |
|
|
[17] |
|
5628 |
Fat |
CH and CH2 |
[81] |
|
5800 |
|
C-H stretch 1st overtone |
[88] |
|
5708 |
|
C-H stretch 1st overtone |
[88] |
|
4333 |
|
C-H bend 2nd overtone |
[88] |
|
4266 |
|
C-H2 bend 2nd overtone |
[88] |
|
8400 |
WheyProtein |
|
[89] |
|
6634 |
|
|
[89] |
|
5555 to 6060 |
|
1st overtone of C-H stretch |
[89] |
|
4545 to 5000 |
|
Combination of N-H stretch and O-H stretch |
[89] |
|
4000 to 4545 |
|
C-H stretch |
[89] |
|
8000 to 9000 |
Lipds |
C-H |
[90] |
|
6900 to 7300 |
|
C-H |
[90] |
|
5600 to 6150 |
|
C-H |
[90] |
|
4167 to 4545 |
|
C-H |
[90] |
|
6000 to 7500 |
Water |
|
[81] |
|
6876 |
|
1st overtone O-H stretching |
[75] |
|
5176 |
|
O-H combinations |
[75] |
|
11905to 13158 |
Melatonin |
|
[91] |
Table 2: Wavenumbers of near Infrared bands and their assignments.
FINAL REMARKS AND FUTURE OUTLOOK
The detection of food quality and authenticity requires comprehensive monitoring of food with efficient analytical methods. In this review, recent advances in food safety evaluation by infrared spectroscopy techniques are presented and discussed. It could be confirmed that NIR and MIR spectroscopy have proven to be worthwhile analytical methods, once have the potential for assessing food safety properties, detecting adulterants, as well as performing characterization and classification of dairy products. Besides the potentiality of the infrared spectroscopy is increased by its use associated with chemometrics. Their combination makes the MIR and NIR techniques more convenient and effective for the analysis of a broad variety of products.
Even though a bunch of works have been carried out in the recent years, the increasing requirement for food quality and authenticity analyses, as well as ongoing work on the development of spectroscopic methods, it will bring several research opportunities for coming years.
ACKNOWLEDGEMENT
This work was funded by CAPES, FAPEMIG and Conselho Nacional de Desenvolvimento Científico e Tecnológico (CNPq), research support agencies of Brazil.
REFERENCES
- De Marchi M, Penasa M, Zidi A, Manuelian CL (2018) Invited review: Use of infrared technologies for the assessment of dairy products-Applications and perspectives. J Dairy Sci 101: 10589-10604.
- Luiz LC, Bell MJV, Rocha RA, Leal NL, Anjos VC (2018) Detection of Veterinary Antimicrobial Residues in Milk through Near-Infrared Absorption Spectroscopy. Journal of Spectroscopy 2018: 1-6.
- Dankowska A, Ma?ecka M, Kowalewski W (2015) Detection of plant oil addition to cheese by synchronous fluorescence spectroscopy. Dairy Sci Technol 95: 413-424.
- Lohumi S, Lee S, Lee H, Cho BK (2015) A review of vibrational spectroscopic techniques for the detection of food authenticity and adulteration. Trends in Food Science and Technology 46: 85-98.
- Nascimento WWG, Souza MPO, Valente ACMM, Anjos V, Furtado MAM, et al. (2017) Results from portable and of low cost equipment developed for detection of milk adulterations. Food Sci Technol 37: 38-74.
- Karoui R, Baerdemaeker JD (2007) A review of the analytical methods coupled with chemometric tools for the determination of the quality and identity of dairy products. Food Chemistry 102: 621-640.
- Danezis GP, Tsagkaris AS, Camin F, Brusic V, Georgiou CA (2016) Food authentication: Techniques, trends & emerging approaches. TrAC - Trends in Analytical Chemistry 85: 123-132.
- Luiz LC, Bell MJV, Rocha RA, Mendes TO, Anjos VC (2014) Análise de Resíduos de Diclofenaco Sódico Veterinário em Leite por Espectroscopia no Infravermelho Próximo. Revista Brasileira de Ciências da Saúde 18: 219-224.
- Teixeira RC, Luiz LC, Junqueira GMA, Bell MGV, Anjos VC (2020) Detection of antibiotic residues in Cow’s milk: A theoretical and experimental vibrational study. Journal of Molecular Structure 1215: 128221.
- Hruzikova J, Milde D, Krajancova P, Ranc V (2012) Discrimination of cheese products for authenticity control by infrared spectroscopy. Journal of Agricultural and Food Chemistry 60: 1845-1849.
- Rodriguez-Saona LE, Giusti MM, Shotts M (2016) Advances in infrared spectroscopy for food authenticity testing. In: Downey G (Ed.). Advances in Food Authenticity Testing. Elsevier Inc., Dublin, Ireland.
- Kamal M, Karoui R (2015) Analytical methods coupled with chemometric tools for determining the authenticity and detecting the adulteration of dairy products?: A review. Trends in Food Science & Technology 46: 27-48.
- Andrade J, Pereira CG, de Almeida JC, Viana CCR, Neves LNdeO, et al. (2019) FTIR-ATR determination of protein content to evaluate whey protein concentrate adulteration. LWT 99: 166-172.
- Andrade J, Pereira CG, Ranquine T, Azarias CA, Bell MJV, et al. (2018) Long-Term Ripening Evaluation of Ewes’ Cheeses by Fourier-Transformed Infrared Spectroscopy under Real Industrial Conditions. Journal of Spectroscopy 2018: 1-9.
- Pereira CG, Andrade J, Ranquine T, Moura INde, Rocha RAda, et al. (2018) Characterization and detection of adulterated whey protein supplements using stationary and time-resolved fluorescence spectroscopy. LWT 97: 180-186.
- Mishra P, Cordella CBY, Rutledge DN, Barreiro P, Roger JM, et al. (2016) Application of independent components analysis with the JADE algorithm and NIR hyperspectral imaging for revealing food adulteration. Journal of Food Engineering 168: 7-15.
- Brandao MP, Carmo AP, Bell MJV, Anjos VC (2010) Characterization of Milk By Infrared Spectroscopy. Rev Inst Latic Cândido Tostes 373: 30-33.
- Leite AIN, Pereira CG, Andrade J, Vicentini NM, Bell MJV, Anjos V (2019) FTIR-ATR spectroscopy as a tool for the rapid detection of adulterations in butter cheeses. LWT 109: 63-69.
- O’Donnell CP, Fagan C, Cullen PJ (2014) Process analytical technology for the food industry. Springer, Berlin, Germany.
- Leite DdeO, Prado RJ (2012) Espectroscopia no infravermelho: uma apresentação para o Ensino Médio. Revista Brasileira de Ensino de F?sica 34: 2504.
- Xie LJ, Wang AC, Xu HR, Fu XP, Ying YB (2016) Applications of Near-Infrared Systems for Quality Evaluation of Fruits: A Review. Transactions of the ASABE 59: 399-419.
- Nunes CA (2014) Vibrational spectroscopy and chemometrics to assess authenticity, adulteration and intrinsic quality parameters of edible oils and fats. Food Research International 60: 255-261.
- Qu J-H, Liu D, Cheng J-H, Sun D-W, Ma J, et al. (2015) Applications of near-infrared spectroscopy in food safety evaluation and control: A review of recent research advances. Critical Reviews in Food Science and Nutrition 55: 1939-1954.
- Wu D, Nie P, He Y, Bao Y (2012) Determination of Calcium Content in Powdered Milk Using Near and Mid-Infrared Spectroscopy with Variable Selection and Chemometrics. Food and Bioprocess Technology 5: 1402–1410.
- Polshin E, Aernouts B, Saeys W, Delvaux F, Delvaux FR, et al. (2011) Beer quality screening by FT-IR spectrometry: Impact of measurement strategies, data pre-processings and variable selection algorithms. Journal of Food Engineering 106: 188-198.
- Gómez-Caravaca AM, Maggio RM, Cerretani L (2016) Chemometric applications to assess quality and critical parameters of virgin and extra-virgin olive oil. A review. Analytica Chimica Acta 913: 1-21.
- Brereton RG (2007) Applied chemometrics for scientists. John Wiley & Sons, New Jersey, USA.
- Luiz LC (2019) Espectroscopia óptica para detecção de resíduos de antibióticos em leite. UFJF (Tese de Doutorado), São Pedro, Brazil.
- Grelet C, Fernández Pierna JA, Dardenne P, Baeten V, Dehareng F (2015) Standardization of milk mid-infrared spectra from a European dairy network. J Dairy Sci 98: 2150-2160.
- Goulden JDS (1961) Quantitative Analysis of Milk and Other Emulsions by Infra-Red Absorption. Nature 191: 905-906.
- Liu N, Parra HA, Pustjens A, Hettinga K, Mongondry P, et al. (2018) Evaluation of portable near-infrared spectroscopy for organic milk authentication. Talanta 184: 128-135.
- Brown G (2013) Quality Control using NIR/MIR Spectroscopy: A Rotten Apple Could Turn Your Product into a Lemon, IICA Tech Night presentation.
- Cattaneo TMP, Holroyd SE (2013) New applications of near infrared spectroscopy on dairy products. Journal Near Infrared Spectroscop 21: 307-310.
- Yang R, Liu R, Dong G, Xu K, Yang Y, et al. (2016) Two-dimensional hetero-spectral mid-infrared and near-infrared correlation spectroscopy for discrimination adulterated milk. Spectrochim Acta A Mol Biomol Spectrosc 157: 50-54.
- Botelho BG, Reis N, Oliveira LS, Sena MM (2015) Development and analytical validation of a screening method for simultaneous detection of five adulterants in raw milk using mid-infrared spectroscopy and PLS-DA. Food Chem 181: 31-37.
- Summer A, Franceschi P, Bollini A, Formaggioni P, Tosi F, et al. (2003) Seasonal variations of milk characteristics and cheesemaking losses in the manufacture of Parmigiano-Reggiano cheese. Veterinary Research Communications 27: 663-666.
- Zhang LG, Zhang X, Ni LJ, Xue ZB, Gu X, et al. (2014) Rapid identification of adulterated cow milk by non-linear pattern recognition methods based on near infrared spectroscopy, Food Chem 145: 342-348.
- Chen H, Tan C, Lin Z, Wu T (2017) Detection of melamine adulteration in milk by near-infrared spectroscopy and one-class partial least squares. Spectrochimica Acta - Part A: Molecular and Biomolecular Spectroscopy 173: 832-836.
- Huang M, Kim MS, Delwiche SR, Chao K, Qin J, et al. (2016) Quantitative analysis of melamine in milk powders using near-infrared hyperspectral imaging and band ratio. Journal of Food Engineering 181: 10-19.
- Mauer LJ, Chernyshova AA, Hiatt A, Deering A, Davis R (2009) Melamine detection in infant formula powder using near- and mid-infrared spectroscopy. J Agric Food Chem 57: 3974-3980.
- Balabin RM, Smirnov SV (2011) Melamine detection by mid- and near-infrared (MIR/NIR) spectroscopy: A quick and sensitive method for dairy products analysis including liquid milk, infant formula, and milk powder. Talanta 85: 562-568.
- De Marchi M, Penasa M, Zidi A, Manuelian CL (2018) Invited review: Use of infrared technologies for the assessment of dairy products-Applications and perspectives. J Dairy Sci 101: 10589-10604.
- Bassbasi M, Platikanov S, Tauler R, Oussama A (2014) FTIR-ATR determination of solid non fat (SNF) in raw milk using PLS and SVM chemometric methods. Food Che 146: 250-254.
- Gondim CS, Junqueira RG, Souza SVC, Ruisánchez I, Callao MP (2017) Detection of several common adulterants in raw milk by MID-infrared spectroscopy and one-class and multi-class multivariate strategies. Food Chem 230: 68-75.
- Sturaro A, De Marchi M, Masi A, Cassandro M (2016) Quantification of whey proteins by reversed phase-HPLC and effectiveness of mid-infrared spectroscopy for their rapid prediction in sweet whey. J Dairy Sci 99: 68-76.
- Sinha R, Radha C, Prakash J, Kaul P (2007) Whey protein hydrolysate: Functional properties, nutritional quality and utilization in beverage formulation, Food Chemistry 101: 1484-1491.
- Walzem RL, Dillard CJ, German JB (2002) Whey Components: Millennia of Evolution Create Functionalities for Mammalian Nutrition: What we know and what we may be overlooking. Crit Rev Food Sci Nutr 42: 353-375.
- Moro A, Gatti C, Delorenzi N (2001) Hydrophobicity of whey protein concentrates measured by fluorescence quenching and its relation with surface functional properties. J Agric Food Chem 49: 4784-4789.
- Bos C, Gaudichon C, Tomé D (2000) Nutritional and physiological criteria in the assessment of milk protein quality for humans. J Am Coll Nutr 19: 191-205.
- Tunick MH (2008), Whey protein production and utilization: a brief history. In: Onwulata CI, Huth PJ (Eds.), Whey Processing, Functionality and Health Benefits, 1st edn, Wiley-Blackwell, Ames, Iowa, USA.
- Patel S (2015) Functional food relevance of whey protein. Journal of Functional Foods 19: 308-319.
- Garrido BC, Souza GHMF, Lourenço DC, Fasciotti M (2016) Proteomics in quality control: Whey protein-based supplements. J Proteomics 147: 48-55.
- Ordóñez JA, Rodriguez MIC, Sanz MLJ (2005)Tecnologia de Alimentos, São Paulo, Brazil.
- Ingle PD, Christian R, Purohit P, Zarraga V, Handley E, et al. (2016) Determination of protein content by NIR spectroscopy in protein powder mix products. J AOAC Int 99: 360-363.
- O’Loughlin IB, Kelly P, Murray BA, FitzGerald RJ, Brodkorb A (2015) Concentrated whey protein ingredients: A Fourier transformed infrared spectroscopy investigation of thermally induced denaturation. Int J Dairy Technol 68: 349-356.
- Wang T, Tan SY, Mutilangi W, Aykas DP, Rodriguez-Saona LE (2015) Authentication of Whey Protein Powders by Portable Mid-Infrared Spectrometers Combined with Pattern Recognition Analysis. J Food Sci 80: 2111-2116.
- Kucheryavskiy S, Lomborg CJ (2015) Monitoring of whey quality with NIR spectroscopy - A feasibility study. Food Chem 176: 271-277.
- Wang K, Sun DW, Pu H, Wei Q (2017) Principles and applications of spectroscopic techniques for evaluating food protein conformational changes: A review, Trends Food Sci Tech 67: 207-219.
- Andrade A, Pereira CG, Ranquine T, Bell MJV, Anjos VC (2020) Mid Infrared Spectroscopy and Multivariate Analysis Evaluation of Adulteration in Whey Protein Powder. Quarks: Braz Electron J of Phys Chem And Mat Sci 2: 1-18.
- da Rocha RA, Paiva MI, Anjos V, Furtado MAM, Bell MJV (2015) Quantification of whey in fluid milk using confocal Raman microscopy and artificial neural network. J Dairy Sci 98: 3559-3567.
- Foda MI, Bahgaat WK, Kassem JM, Aly SE (2016) Fourier Transform Infrared (FTIR) Spectra in Relation to the Composition of White Soft Cheese. World Applied Sciences Journal 26: 289-295.
- Milkpoint (2017) Abiq: mercado de queijos tem alto potencial de crescimento no Brasil.
- AOAC, Infrared spectroscopic methods for determination of fat, protein, lactose, and total solids content of milk e AOAC Standard 972.16. In: Horwitz W, Latimer GW, Official Methods of Food Analysis of AOAC International, 18th , AOAC International, Gaithersburg, MD, USA, 2005.
- González-Martín I, Hernández-Hierro JM, Morón-Sancho R, Salvador-Esteban J, Vivar-Quintana A, et al. (2007) Determination of the percentage of milk (cow’s, ewe’s and goat’s) in cheeses with different ripening times using near infrared spectroscopy technology and a remote reflectance fibre-optic probe, Analytica Chimica Acta. 604: 191-196.
- González-Martín I, Hernández-Hierro JM, Vivar-Quintana A, Revilla I, González-Pérez C (2009) The application of near infrared spectroscopy technology and a remote reflectance fibre-optic probe for the determination of peptides in cheeses (cow’s, ewe’s and goat’s) with different ripening times. Food Chem. 114: 1564-1569.
- Lerma-García MJ, Gori A, Cerretani L, Simó-Alfonso EF, Caboni MF (2010) Classification of Pecorino cheeses produced in Italy according to their ripening time and manufacturing technique using Fourier transform infrared spectroscopy. J Dairy Sci 93: 4490-44966.
- Kraggerud H, Næs T, Abrahamsen RK (2014) Prediction of sensory quality of cheese during ripening from chemical and spectroscopy measurements. Int Dairy J 34: 6-18.
- Rodriguez-Saona LE, Koca N, Harper WJ, Alvarez VB (2006) Rapid determination of Swiss cheese composition by Fourier transform infrared/attenuated total reflectance spectroscopy. J Dairy Sci 89: 1407-1412.
- Subramanian A, Alvarez VB, Harper WJ, Rodriguez-Saona LE (2011) Monitoring amino acids, organic acids, and ripening changes in Cheddar cheese using Fourier-transform infrared spectroscopy. Int Dairy J 21: 434-440.
- Martín-del-Campo ST, Picque D, Cosío-Ramírez R, Corrieu G (2007) Middle infrared spectroscopy characterization of ripening stages of Camembert-type cheeses. Int Dairy J 17: 835-845.
- Cuibus L, Maggio R, Mure?an V, Diaconeasa Z, Fetea F, et al. (2014) Preliminary discrimination of cheese adulteration by FT-IR Spectroscopy. Bulletin USAMV Food Science and Technology 71.
- Kadamne JV, Jain VP, Saleh M, Proctor A (2009) Measurement of conjugated linoleic acid (CLA) in CLA-rich soy oil by attenuated total reflectance-Fourier transform infrared spectroscopy (ATR-FTIR), J Agric Food Chem 57: 10483-10488.
- Koca N, Kocaoglu-Vurma NA, Harper WJ, Rodriguez-Saona LE (2010) Application of temperature-controlled attenuated total reflectance-mid-infrared (ATR-MIR) spectroscopy for rapid estimation of butter adulteration. Food Chemistry 121: 778-782.
- Casarrubias-Torres LM, Meza-Márquez OG, Osorio-Revilla G, Gallardo-Velazquez T (2018) Mid-infrared spectroscopy and multivariate analysis for determination of tetracycline residues in cow's milk. Acta Veterinaria 87: 181-188.
- Nawrocka A, Lamorska J (2013) Determination of Food Quality by Using Spectroscopic Methods, Advances in Agrophysical Research 14: 348-367.
- Paré J R J, Bélanger JMR (1997)Instrumental Methods in Food Analysis: Techniques and Instrumentation in Analytical Chemistry. Elsevier 18: 119-120.
- Curley DM, Kumosinski TF, Unruh JJ, Farrell HM Jr. (1998) Changes in the Secondary Structure of Bovine Casein by Fourier Transform Infrared Spectroscopy: Effects of Calcium and Temperature. J Dairy Sci 81: 3154-3162.
- Etzion Y, Linker R, Cogan U, Shmulevich I (2004) Transform Infrared/Attenuated Total Reflectance Spectroscopy. Journal of Dairy Sciene 87: 2779-2788.
- Wang T, Tan SY, Mutilangi W, Plans M, Rodriguez-Saona L (2016) Application of Infrared portable sensor technology for predicting perceived astringency of acidic whey protein beverages. J Dairy Sci 99- 9461-9470.
- de Ruig WG (1971) Infrared spectra of monoacid triglycerides: with some applications to fat analysis, Centre for Agricultural Publishing and Documentation Wageningen. Agric Res Repts (Versl. Landbouwk. Onderz) 759.
- Sivakesava S, Irudayaraj J (2002) Rapid determination of tetracycline in milk by FT-MIR and FT-NIR Spectroscopy. J Dairy Sci 85: 487-493.
- Villé H, Maes G, De Schrijver R, Spincemaille G, Rombouts G, et al. (1995) Determination of phospholipid content of intramuscular fat by Fourier Transform Infrared spectroscopy. Meat Sci 41: 283-291.
- Abramson MB, Norton WT, Katzman R (1965) Study of Ionic Structure in Phospholipids by Infrared Spectra. J Biol Chem 240: 2389-2395.
- Meng X, Ye Q, Pan Q, Ding Y, Wei M, et al. (2014) Total phospholipids in edible oils by invial solvent extraction coupled with FTIR analysis, J Agric Food Chem 62: 3101-3107.
- Li J, He Y, Anankanbil S, Guo Z (2018) Phospholipid-Based Surfactants. In book: Biobased Surfactants. Chapter 7.
- Filali S, Bergamelli C, Lamine Tall M, Salmon D, Laleye D, et al. (2017) Formulation, satability testing, and analytical characterization of melatonin based preparation for clinical trial. J Pharm Anal 7: 237-243.
- Chakrabarty S, DiTucci MJ, Berden G, Oomens J4, Williams ER (2018) Structural Investigation of the Hormone Melatonin and Its Alkali and Alkaline Earth Metal Complexes in the Gas Phase. J Am Soc Mass Spectrom 29: 1835-1847.
- Mehrotra R (2006) Infrared Spectroscopy, Gas Chromatography/Infrares in Food Analysis. In Book: Encyclopedia of Analytical Chemistry.
- Wójcicki K (2018) Applying NIR spectroscopy to evaluate quality of whey protein supplements available on the polish market. ?ywno?? Nauka Technologia Jako?? 25: 59-70.
- Chmielarz M, Sampels S, Blomqvist J, Brandenburg J, Wende F, et al. (2019) FT-Nir: a tool for rapid intracellular lipid quantification in oleaginous yeast. Biotechnology for Biofuels 12: 169.
- Karu TI, Pyatibrat LV, Ryabykh TP (2003) Melatonin modulates the action of near infrared radiation on cell adhesion. J Pineal Res 34:167-172.
Citation: Pereira C, Luiz LC, Bell MJV, Anjos V (2020) Near and Mid Infrared Spectroscopy to Assess Milk Products Quality: A Review of Recent Applications. J Dairy Res Tech 3: 014.
Copyright: © 2020 Cristina G Pereira, et al. This is an open-access article distributed under the terms of the Creative Commons Attribution License, which permits unrestricted use, distribution, and reproduction in any medium, provided the original author and source are credited.