On the Development and Adaptation of a Predictive Model of Full-Factor Optimization of The Basic Probiotic Fermented Dairy Product Technological Process
*Corresponding Author(s):
Zobkova ZSAll-Russian Research Institute Of Dairy Industry, 35, Lyusinovskaya St., 115093 Moscow, Info@vnimi.org, Russia
Email:z_zobkova@vnimi.org
Abstract
The purpose of building a predictive model for optimization of technological processes probiotic fermented dairy product was providing the design of some set of formulations in which the RBV indicator (relative biological value, %) would correspond to the maximum value at given production parameters. For this purpose, a full-factor experiment (FFE) was conducted in which mass fraction of sucrose ( ωs, %) and fat-protein index (r), - the ratio of mass fraction of fat to mass fraction of protein in the normalized mixture in the intervals from 0 to 10 and from 0 to 1.5%, respectively, were taken as independent factors. As a result, a mathematical description of the dependence of RBV parameter on mass fraction of sucrose and fat-protein index was obtained. The set of obtained data on the influence of mass fraction of sucrose on the dynamic of local RBV maximums and the dynamic of their corresponding values of mass fraction of fat showed that mass fraction of sucrose equal to 7.31 % corresponded to maximum of RBV equal to 244.86 %. The latter corresponded to the optimum of fat-protein index equal to 1.241. In order to provide maximum of RBV the lower limit of the mass fraction of fat should correspond to 3.475%.
Analysis of FFE data showed the presence of additional factors of RBV dependence on mass fraction of fat and protein. In order to clarify the developed model taking into account the additional factors, a correction coefficient Q=RBV/RBVref was introduced into it, where RBVref is the reference value of RBV, equal to 244.863%.
To determine the functional dependence of correction coefficient on the mass fraction of fat, the experimental data were approximated. As a result, the following mathematical description of the form Q=fq(ωF) was obtained: RBV = exp [a + b*exp(ωF)], where a and b are coefficients. As a result, a minimum acceptable Q factor value was established, corresponding to the condition RBV =100, Qmin = 0.40839.
The aim of the study - to develop and adapt a predictive model of full-factor optimization of the probiotic fermented dairy product technological process.
Keywords
A predictive model of a process; Full-factor experiment; Probiotic fermented dairy product; Relative biological value
Introduction
According to FAO/WHO, the world population will increase to 9.7 billion by 2050 [1]. In accordance with rapidly evolving product markets and increasing population's needs for new types of products, increasing of their shelf life, there is a need to expand the range of products and to modernize traditional technologies. One of the ways to solve the problem of population’s nutrition and health is to incorporate biologically valuable food products in a diet [2-5]. The main means of achieving these goals is to increase the efficiency and quality of scientific research, to improve the forms of linking science with production, to accelerate the introduction of scientific achievements in industry. The latter will make adjustments to accelerated developments of efficient product technologies. Using new planning methods of an experiment with the aim of technological process's optimization would let to shorten study's duration on the creation of new types of products. One of the scientific advances in recent years is the rapid development of experimentally statistical research methods in various industries, including dairy [6]. According to the author [6] finding models by the method of full-factor experiment consists of planning the own experiment, checking reproducibility, obtaining a mathematical model of the object with checking the statistical significance of sample regression coefficients and checking the adequacy of the mathematical description. The purpose of model building is to predict responses values at states that have not been studied experimentally but that approximate the optimum.
The most reliable method of product quality assessment from this point of view is the biological method using higher animals [7,8]. However, its application is difficult with regular product control, evaluation of raw materials, different processing methods and new technologies. For biological evaluation of raw materials and finished products, protozoan life forms, whose basic parameters of metabolic processes are close to those of higher organisms, can be used as indicators [9-12]. Analysis of literature data and previous studies shows that among the currently existing test-organisms, Tetrahymena pyriformis ciliates correspond most closely to higher organisms in their physiological and biochemical parameters and toxic-biological reactions to exposure to certain substances [11-18].
The aim of the study - to develop and adapt a predictive model of full-factor optimization of the probiotic fermented dairy product technological process.
Materials and Methods
The studies were conducted at the Russian Research Institute of the Dairy Industry. The objects of the study were the samples of probiotic fermented dairy product manufactured in accordance with mathematical model of the process providing for the expected maximum RBV values close to 244.86%; mass fraction of fat not less than 3.48% ?with a minimum mass fraction of whole raw milk protein - 2.8%; mass fraction of sucrose - 7.3%. Starter on thermophilic streptococci, bulgarian bacillus and bifidobacteria concentrate were used for fermentation.
The relative biological value of the obtained products were assessed by an express method of biotesting in accordance with the method developed by the authors and published in Foods 2022, Vol. 11, ?1, P. 114 [19]. A probiotic fermented dairy product manufactured in accordance with current regulatory documents without taking into account the fat-protein index was used as a control sample.
Mathematical data processing was carried out using Microsoft Excel 2010 (Microsoft Corporation, Ink.) with the "Solution Search" add-in installed, as well as specialized software packages TableCurve 2D v.5.01 (SYSTAT Software, Ink.) and Wolfram Mathematica 10.2 (Wolfram Research, Ink.), textbook [20].
Results And Discussion
The creation's aim of predictive model of technological process's optimization of probiotic fermented dairy product was providing the design of probiotic fermented dairy product technological process in which RBV would correspond to the maximum value with satisfactory fixed process parameters. For this purpose, a full-factor experiment was conducted in which mass fraction of sucrose ( , %) and fat-protein index (r) (the ratio of mass fraction of fat to mass fraction of protein) in normalized mixture were taken as independent in the intervals from 0 to 10 and from 0 to 1.5%, respectively. RBV was taken as the resultant factor. Based on the results of the research there was obtained the refined mathematical description of the dependence of the RBV on the mass fraction of sucrose and fat-protein index which adequately describes empirical relationship between the resulting and independent factors
|
i |
Statistics of mathematical descriptions of coefficients |
Statistics of coefficients ki: t-importance |
||||||
|
Subcoefficients |
R2 |
F-adequacy** |
||||||
|
parameters |
ai |
bi |
ci |
di |
||||
|
1 |
value |
4.605170 |
0.069438 |
-0.04814 |
0.008224 |
0.9999 |
< 0,00001 |
< 0,00001 |
|
t-importance * |
< 0,00001 |
< 0,00001 |
< 0,00001 |
< 0,00001 |
||||
|
2 |
value |
0 |
-3.855900 |
2.671659 |
-0.456400 |
0.9999 |
< 0,00001 |
< 0,00001 |
|
t-importance * |
– |
< 0,00001 |
< 0,00001 |
< 0,00001 |
||||
|
3 |
value |
0 |
19.88832 |
-13.70803 |
2.340083 |
0.9999 |
< 0,00001 |
< 0,00001 |
|
t-importance * |
– |
< 0,00001 |
< 0,00001 |
< 0,00001 |
||||
|
4 |
value |
0 |
-34.91040 |
23.89756 |
-4.05886 |
0.9999 |
< 0,00001 |
< 0,00001 |
|
t-importance * |
– |
< 0,00001 |
< 0,00001 |
< 0,00001 |
||||
|
5 |
value |
0 |
25.37633 |
-17.18997 |
2.893844 |
0.9999 |
< 0,00001 |
< 0,00001 |
|
t-importance * |
– |
< 0,00001 |
< 0,00001 |
< 0,00001 |
||||
|
6 |
value |
0 |
-6.584389 |
4.409618 |
-0.735032 |
0.9999 |
< 0,00001 |
< 0,00001 |
|
t-importance * |
– |
< 0,00001 |
< 0,00001 |
< 0,00001 |
||||
|
Statistics of mathematical description |
R2 |
0.9999 |
||||||
|
F- adequacy |
< 0,00001 |
|||||||
Table 1: Statistical characteristics of the mathematical description of fermented dairy product RBV dependence on fat-protein index and mass fraction of sucrose.
* significance according to Student's test; ** adequacy according to Fisher's test
In accordance with the polynomial nature of the obtained mathematical description, the response surface inevitably contains extremes corresponding to the local minimums or maximums of RBV values within some interval of independent factors. Finding the maximum of response surface within the rational area of independent factors definition in this case was non-trivial problem, because it was polynom of the fifth degree ∂RBV/∂ωs∂r, the analytical finding of the roots of which was very problematic. In this regard extremes were determined by numerical methods scanning the response surface in steps of 0.01 for one of the independent factors and determining in each case function's maximum of one variable for the second independent factor.
Due to the fact that every discrete value of fat-protein index, theoretically, can be corresponded to an infinite combination of mass fractions of fat and of protein in the normalized mixture, the mass fraction of sucrose was taken as a fixed index, as unambiguously fixed, during determination of maximums. The location of the calculated maximums on the response surface of the mathematical description is presented in Figure 1.
 Figure 1: Response surface of the effect of fat-protein index and mass fraction of sucrose on the RBV with maximums (blue lines) at fixed mass fraction of sucrose.
The analysis of the obtained results shows that in the position of local maximums at a fixed mass fraction of sucrose there is a dynamics in the value of RBV and fat-protein index. Since the determining factor of both dynamics is mass fraction of sucrose, they were comparatively evaluated (Figure 2).
 Figure 2: Effect of mass fraction of sucrose on the dynamics of local RBV maximums and the dynamics of their corresponding values of mass fraction of fat.
Within the considered area of values of mass fraction of sucrose, each of the dynamics illustrates the presence of a gap at a variable value of 2.96%. Comparative analysis of the left side of the dynamics from the breakpoint shows an RBV increase with almost unchanged fat-protein index, which presumably indicates the dominant influence of the factor of sucrose presence in fermented dairy product on the RBV value. This conclusion also confirms the continued RBV increase with further increase in sucrose presence up to some maximum value. While some fixed ratio of fat and protein is a kind of background for the manifestation of the positive properties of sucrose. In the case of further increase in the mass fraction of sucrose, there was an almost symmetrical decrease in RBV, requiring a decrease in the fat-protein index for its provision. This probably indicates that the added mass fraction of sucrose, which makes its total amount exceed some critical value and becomes for the most part a stressor. Some degree of excess of mass fraction of fat over mass fraction of protein also becomes a stressor.
Due to the small discretization step of mass fraction of sucrose in determining the set of local RBV maximums, dynamics shown in Figure 2 are sets of discrete values. Thus, it is sufficient to range set elements without the need to approximate their values in order to find local maximum of RBV dynamics within considered area of mass faction of sucrose determination with technologically acceptable accuracy. Analysis of the set values showed that the maximum RBV (244.866%) corresponds to the maximum mass fraction of sucrose 7.31%, which in turn corresponds to the optimum of the fat-protein index, equal to 1.241. For convenience of practical application, it makes sense to round the mass fraction of sucrose to 7.3%. As a consequence of this rounding the RBV value decreased slightly - to 244,863 and the change in the fat-protein index value did not exceed 2.4-10-4.
The found optimal solutions, theoretically, allows to be optimal from the point of view of relative biological value. These solutions let to calculate any fermented dairy product formulations, in which at the optimal mass fraction of sucrose and any values of mass fraction of fat or protein the conformity of the fat-protein index to its optimal value is provided. However, use of this approach into the practice imposes on the potential set of formulations a certain limitation associated with the chemical composition of raw materials used in the creation of normalized mixture. Thus, while the mass fraction of fat can vary widely due to separation or concentrating, the lower limit of possible values of the mass fraction of protein in raw milk can't be less than 2.8%. But in order to observe the optimum of the fat-protein index (1,241) the lower limit of the mass fraction of fat should correspond to 3.475%. Thus, the final version of the practically realizable set of formulations in terms of mass fractions of fat and protein corresponds to the straight line in the unpainted area of Figure 3.
 Figure 3: Area of practically realizable combinations of mass fractions of fat and protein to satisfy the condition of maximum RBV.
High permissible degree of variability of probiotic fermented dairy product formulations by mass fraction of fat (or protein) in the wide ranges of values with equality of the established basic conditions for ensuring the maximum RBV allows to put forward a hypothesis about the possibility of the additional restriction’s existence narrowing the permissible range of values of mass fractions of fat (or protein). In order to confirm or reject this hypothesis, the approbation of the developed model was conducted on samples with different concentrations of mass fractions of fat and protein under the conditions of optimum - RBV maximization. The obtained results are presented in Table 2.
|
Input parameters of the normalized mixture |
RBV, % |
|||
|
mass fraction of fat, % |
mass fraction of protein, % |
mass fraction of sucrose, % |
fat-protein index |
|
|
3,48 |
2,80 |
7,3 |
1,24 |
240 ± 16,8 |
|
3,48 |
2,80 |
7,3 |
1,24 |
242 ± 18,1 |
|
3,48 |
2,80 |
7,3 |
1,24 |
237 ± 16,6 |
|
3,48 |
2,80 |
7,3 |
1,24 |
234± 16,4 |
|
3,97 |
3,20 |
7,3 |
1,24 |
210 ± 14,7 |
|
3,97 |
3,20 |
7,3 |
1,24 |
202 ± 14,1 |
|
3,97 |
3,20 |
7,3 |
1,24 |
190 ± 13,3 |
|
3,97 |
3,20 |
7,3 |
1,24 |
197 ± 13,8 |
|
4,09 |
3,30 |
7,3 |
1,24 |
184 ± 12,9 |
|
4,21 |
3,39 |
7,3 |
1,24 |
172 ± 12,9 |
|
4,21 |
3,39 |
7,3 |
1,24 |
165 ± 11,5 |
|
4,21 |
3,39 |
7,3 |
1,24 |
158 ± 11,0 |
|
4,21 |
3,39 |
7,3 |
1,24 |
180 ± 12,6 |
Table 2: Original data on model approbation.
Since the fat-protein index was kept constant in all samples, therefore, the values of mass fractions of fat and protein in the composition of the normalized mixture are strictly related. Thus, it is reasonable to use one (any) of these indicators for further analysis. We randomly selected the mass fraction of fat (ωF ).
Analysis of the data in Table 2 allowed us to make a preliminary conclusion that there is some inverse correlation between the mass fraction of fat and the RBV value. Consequently, the hypothesis about the presence of additional corrective factors was confirmed. In order to develop corrective model a correction coefficient was introduced into it Q= RBV/RBVref, where RBVref -reference value RBV, equal to 244,863%. To determine the functional dependence of this parameter on the mass fraction of fat, the experimental data were approximated, as a result of which the following mathematical description of the form was obtained Q = fQ (ωF):
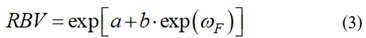 where a and b – coefficient.
Analysis of the data in Table 2 showed that the experimental error of RBV determination (ΔRBV) is also inversely correlated with the values of mass fraction of fat. Accordingly, this value was converted into the error of the correction coefficient ΔQ= ΔRBV/RBVref. The approximation of the obtained values showed that the functional dependence of the form ΔQ = fΔQ (ωF) is identical to the formula (3), differing only in the coefficients. Statistical parameters of both dependencies are given in Table 3.
|
Parameters |
Statistical characteristics |
||||
|
coefficient |
values |
t-importance |
R2 |
F- adequacy |
|
|
a |
0.287623 |
< 0.00002 |
0.944064 |
< 0.00001 |
|
|
b |
-0.009550 |
< 0.00001 |
|||
|
a |
-2.347034 |
< 0.00001 |
0.907574 |
< 0.00001 |
|
|
b |
-0.009811 |
< 0.00001 |
|||
Table 3: Statistical characteristics of the mathematical description of dependencies and on the mass fraction of fat.
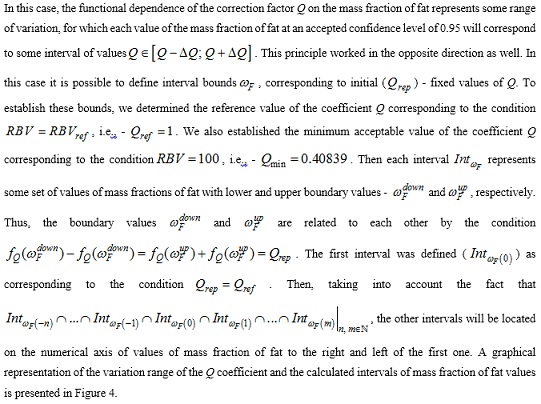
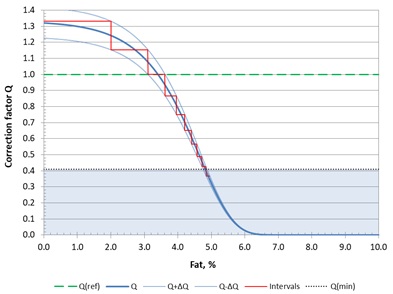 Figure 4: Variation range of the correction factor Q and variation intervals ωF.
Analysis of the obtained data showed that at fixed values of mass fraction of sucrose and fat-protein index, a decrease in mass fraction of fat (and protein simultaneously) promotes a nonlinear increase in RBV, reaching the reference Q value at ωF = 3,405%. Further downward extrapolation shows the potential possibility in achieving an RBV in the fully skimmed product more than 1.32 times higher than the maximum value obtained in the simulations under varying fat-protein index and mass fraction of sucrose. However, this potential is unlikely to have the possibility of practical realization due to the limitation presented in Figure 3.
Narrowing the variation range of the Q coefficient with increasing mass fraction of fat led to a gradual decrease in the width of the intervals and an increase in their number. If the mass fraction of fat exceeds the value of 4.84%, the value of the correction coefficient becomes smaller Qmin. Thus, this value is the upper limit of applicability of the RBV maximization principle for optimizing the formulation of the normalized mixture for fermented dairy product production.
In order to maximize the use of the available range of mass fractions of fat and leveling the effect of the minimum mass fraction of protein in the normalized mixture at values less than 3.476% (which corresponds to a mass fraction of protein 2.8%), we conventionally divided the area of determination of this value into two global intervals - A and B. At interval A we softened the requirements for optimizing the composition of the normalized mixture, i.e. we left only the mass fraction of sucrose as constant. In this case, with a constant minimum mass fraction of protein and decreasing mass fraction of fat, the fat-protein index will continuously decrease. We determined the RBV change curve at interval A based on formulas (1) and (2). In turn, on the global interval B we determined the RBV change curve taking into account the correction coefficient: RBV = RBVref .Q. Let's convert the reference values Qrep to RBV reference values: RBVrep = RBVref . The full RBV curve as a function of mass fraction of fat with division into intervals and the final version of the rational set of "fat-protein" combinations are presented in Figure 5. Assuming a hypothetically non-zero probability of the possibility of extrapolating the interval differentiation RBV and on the global interval A, we obtained a complete picture of the distribution of intervals satisfying the RBV reference values.
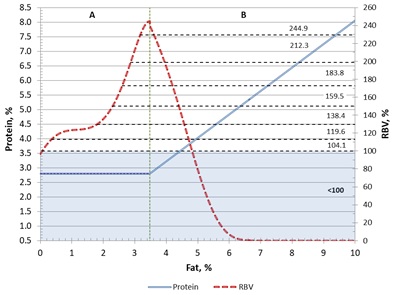 Figure 5: Influence of mass fraction of fat on RBV and rational set of "fat - protein" combinations in the formulation.
In their specificity, the mass fraction of fat intervals appeared to be nested within each other as the RBV reference value increased. By subtracting the values of the nested intervals from the outer intervals, rational intervals of mass fraction of fat corresponding to the RBV reference values were obtained, differentially for each of the global intervals A and B. The results are presented in the Table 4.
|
RBVrep, % |
Parameter |
Intervals |
|||
|
A |
B |
||||
|
Start |
end |
start |
End |
||
|
244.86 |
fat |
3.17 |
3.47 |
3.48 |
3.61 |
|
protein |
2.8 |
2.8 |
2.8 |
2.91 |
|
|
212.31 |
fat |
2.87 |
3.17 |
3.61 |
3.95 |
|
protein |
2.8 |
2.8 |
2.91 |
3.18 |
|
|
183.82 |
fat |
2.6 |
2.87 |
3.95 |
4.2 |
|
protein |
2.8 |
2.8 |
3.18 |
3.38 |
|
|
159.49 |
fat |
2.29 |
2.6 |
4.2 |
4.4 |
|
protein |
2.8 |
2.8 |
3.38 |
3.54 |
|
|
138.36 |
fat |
1.8 |
2.29 |
4.4 |
4.57 |
|
protein |
2.8 |
2.8 |
3.54 |
3.68 |
|
|
119.65 |
fat |
0.35 |
1.8 |
4.57 |
4.71 |
|
protein |
2.8 |
2.8 |
3.68 |
3.79 |
|
|
104.05 |
fat |
0.06 |
0.35 |
4.71 |
4.84 |
|
protein |
2.8 |
2.8 |
3.79 |
3.9 |
|
|
<100 |
fat |
< 0.06 |
> 4.84 |
||
|
protein |
2.8 |
>3.9 |
|||
Table 4: Intervals of mass fraction of fat corresponding to RBV reference values.
The obtained values can serve as a criterion for the formation of a set of formulations for the production of sugar-containing fermented dairy products with a high potential of relative biological value. It should be kept in mind that the domain of this approach is limited in terms of mass fraction of fat ranging from 0.06 to 4.84% and mass fraction of protein ranging from 2.8 to 3.9%.
Conclusion
Approbation of the optimization model of the technological process of probiotic fermented dairy product production and the obtained mathematical dependencies can serve as a criterion for the formation of a set of formulations for the production of sugar-containing fermented dairy products with a high potential of relative biological value. It should be taken into account that the definition area of this approach is limited in terms of mass fraction of fat in the range from 0.06 to 4.84% and mass fraction of protein - from 2.8 to 3.9%. With this approach (development of models) it is possible to analyze modes promising for the studied process, which in real conditions at the experimental stage is not always possible to obtain. The development of this model allowed us significantly reduce the duration of research on the optimization of the technological process.
References
- https://www.fao.org/common-pages/search/ru/?q=%D0%B4%D0%B5%D0%BC%D0%BE%D0%B3%D1%80%D0%B0%D1%84%D0%B8%D1%8F
- Turovskaya SN, Galstyan AG, Petrov AN (2018) Scientific and practical potential of dairy products for special purposes. Proceedings of the National Academy of Sciences of the Republic of Kazakhstan. Ser Geol Tech Sci 6: 16-22.
- Khurshudyan SA, Pryanichnikova NS, Ryabova AE (2022) Food quality and safety. Transform Concepts Food Ind 6: 8-10.
- Tutelyan VA, Vyalkov AI, Razumov AN, Mikhailov VI, Moskalenko KA, et al. (2010) Scientific Foundations of Healthy Nutrition; Publishing House “Panorama”: Moscow, Russia 816.
- Pokrovsky AA (1981) The Development of New Products of Increased Biological Value Is the Most Important Task of Nutrition Science: A Textbook; Medicine: Moscow, Russia, 14-20.
- Fedorov VG, Pleskonos AK (1980) Planning and realization of experiments: in food industry. Food Industry
- Evans E, Carruthers S (1978) Comparisons of methods used for estimating the growth of Tetrahymena pyriformis. J Sci Food Agr 29: 703-707.
- Lanokhina GM, Irlina IS, Etlin SN (1991) Peculiarities of the use of infusoria culture in toxicological studies. Quest Nutriciolog 3: 81-82.
- Dolgov VA (1992) Methodological aspects and practical application of accelerated biological evaluation of forages, livestock products and other objects of veterinary-sanitary and environmental control. Doctoral dissertation, Russian Agricultural Academy, Moscow, Russia.
- Shemarova IV (2007) Methodical recommendations on the use of infusoria Tetrahyena Pyriformis GL as test objects in toxicological, pharmacological and ecological studies; SPBGAVM: St. Petersburg, Russia, 26.
- Dolgov VA, Lapaev VE (1991) Methodical recommendations for the use of infusoria (Tetrachymena piriformis) as a test culture in the device "Biotester-2" (express-method); State Medical and Sanitary Association: Moscow.
- Dolgov VA, Lavina SA (2000) Methodical recommendations for accelerated toxicological evaluation of fodder using the device "Biotester-2", No. 13-7-2/2156, Department of Veterinary Medicine of the Ministry of Agriculture of the Russian Federation: Moscow.
- Dolgov VA, Lavina SA, Arno TS, Semenova EA, Nikitchenko VE (2010) Methodical manual on biotest assessment of quality and safety of various objects of veterinary-sanitary and environmental control; Russian Academy of Agricultural Sciences: Moscow, Russia.
- Dolgov VA, Lavina SA, Nikitchenko DV (2014) Evaluation and interrelation of toxicity parameters of various substances for Tetrahymena pyriformis infusoria and white rats. Bulletin. RUDN 2: 49-54.
- Karpova MV, Frolova OA (2011) Use of Tetrahymena pyriformis to assess the relative biological value and toxicity of milk. Proceedings of the All-Russian XIII Congress of nutritionists and nutritionists with international participation. Pers Diet Present Future 1: 46-47.
- Zobkova, ZS, Yurova EA, Semipyatniy VK, Lazareva EG, Zenina DV, et al. (2022) Modification of Biotesting-Based Fermented Dairy Product Design for Curd and Curd Products. Foods 11:
- Shulgin YP, Blinov YG, Shulgina LV (2004) Biological express-evaluation of hydrobiont muscle tissue using Tetrahymena pyriformis. Proc TINRO Pac Fish Res Cent 136: 294-303.
- Zobkova ZS (2022) Methodological aspects of designing whole-milk products with increased relative biological value. Food Industry 68-71.
- Zobkova ZS, Lazareva EG, Semipyatny VK (2022) Methodical approach to the creation of sour-milk products with optimal biological value. Foods 114.
- Fetisov EA, Semipyatiy VK, Petrov AN, Galstyan AG (2015) Planning and analysis of the results of technological experiments / Moscow : All-Russian Research Institute of Dairy Industry, 98.
Citation: Zobkova ZS, Kondratenko VV, Pryanichnikova NS, Zenina DV, Korovina NS (2023) On the Development and Adaptation of a Predictive Model of Full-Factor Optimization of The Basic Probiotic Fermented Dairy Product Technological Process. J Food Sci Nutr 9: 163
Copyright: © 2023 Zobkova ZS, et al. This is an open-access article distributed under the terms of the Creative Commons Attribution License, which permits unrestricted use, distribution, and reproduction in any medium, provided the original author and source are credited.