Optimization Study on Fortified Bamboo Shoots Corn Flakes Based on Fibre Content and Physical Analysis
*Corresponding Author(s):
Rumaisa NordinDepartment Of Chemical Engineering Technology, Faculty Of Engineering Technology, Universiti Malaysia Perlis, Padang Besar, Perlis, Malaysia
Email:rumaisa@unimap.edu.my
Abstract
The aim of this work was to evaluate the potential of Bamboo Shoots Powder (BSP) as a dietary fibre source in cornflakes. Response Surface Method (RSM) with Central Composite Design (CCD) was used to optimize amount of cornmeal and BSP to fortified cornflakes. The relationship between independent variables (amount of cornmeal and BSP) with the physical properties (crispness, hardness, L*, a*, and b*) was evaluated. The second-order polynomial model adequately described the physical properties with regression coefficient, R2>0.75. The optimum formulation was found to be 22.183g of cornmeal and 13.538g of BSP, resulting in crispness = 56.60 ± 7.77, L* = 58.54 ± 0.65, a* =9.680 ± 0.09, and b* = 34.06 ± 0.68. Through comparison, optimized corn flakes showed higher Total Dietary Fibre (TDF) content (16.25% ± 0.35), darker in colour, more reddish and less yellowish than that of control and commercial cornflakes. Commercial cornflakes gave least crispness value (52.8 ± 8.40) compared to control (86.2 ± 9.12) and optimized cornflakes. In terms of overall acceptability, panellist least preferred optimized BSP fortified cornflakes. The study concluded with development of BSP fortified cornflakes having high TDF content with optimized formulation.
Keywords
Bamboo shoot; Cornflakes; Fortification; Optimization; RSM; Total dietary fibre
Introduction
In the wake of time and advancement of science and technology, globalisation and urbanisation has affected people’s dietary habits and forced many people to consume convenient but unhealthy fast food [1]. Fast foods are rich in refined carbohydrate, sodium (salt), total fat, cholesterol, saturated and Tran’s fatty acids, but poor in essential nutrients and dietary fibres [2]. This eating habit hinders people from getting enough fibre. A journal published in [3][1] stated that the intake of Dietary Fibre (DF) of most people worldwide is less than 20 g per day, lesser than the recommended intake of DF of around 25-30 g per day by [4].
According to [5], DF is defined as the edible parts of plants or analogous carbohydrates that are resistant to digestion and absorption in the human’s small intestine with complete or partial fermentation in the large intestine. It includes polysaccharides, oligosaccharides, lignin, and associated plant substances. DF plays an essential role in human diet and health.
Bamboo Shoots (BS) are known to be one of the rich sources of DF that contain a total dietary fibre ranging from 2.23 to 4.20 g/100 g weight of fresh BS [6]. The shoots of bamboo are not only rich in fibre content, but are high content in carbohydrates, proteins, amino acids, and minerals [7]. BS also contains phytosterols that can lower the blood cholesterol and Low-Density Lipoprotein (LDL) cholesterol levels. Besides that, BS offer health benefits such as stimulating appetite, boosting digestion, enhancing weight loss, and also curing cardiovascular diseases and cancer [8]. Due to its nutritional values and health advantages, BS has the potential as functional food and fibre fortified source into a wide range of food products [9].
However, BS have a short harvesting period and post harvesting time which require immediate processing after harvesting otherwise it will deteriorate [6]. The most common and convenient method to handle BS is converting it into powder that can be utilized as food fortification purposes [10]. The advantages of using BSP are its prolonged shelf life, ease of handling, and low moisture content. The characteristics of a low moisture content of BSP allows it to be added directly and incorporated inside different food products in order to increase their fibre content [11]. Bamboo fibre had been fortified in different food products such as fruit juices, bakery, meat product, sauces and shredded cheese [12]. Nonetheless, limited works had studied the application of BS as a dietary fibre source in fortified cereals type foods.
Materials And Methods
Materials
Fresh, raw edible BS “rebung hutan” were bought from the local market. The rest of the ingredients such as cornmeal, sugar, and salt were bought from Giant hypermarket, Kangar.
Preparation of BSP
The outer culm sheath and damaged parts were removed and the edible part of the bamboo shoots were washed and then cut into an approximate 1 cm thickness slides with the help of a knife. The fresh shoots contain cyanogenic glycoside that is harmful to human if consumed [13]. The BP slides were boiled at 100? for 20 to 30 minutes to remove the cyanogenic glycoside. Then, the shoots were dried to a constant weight in food dehydrator (Excalibur Products, Sacramento, CA) at 70? for 24 hours [11]. Dried slices of shoots were ground into powder form by laboratory blender (model 7010BU; Waring Commercial, Torrington, CT) and kept in closed container.
Experimental design
RSM was applied to the experimental data using statistical package Design Expert version 12.0.3.0 (Stat-Ease Inc., Minneapolis, USA) for the generation of response surface plots and optimization of the formulations. Face-centred CCD was applied to design the formulation of cornflakes. The upper and lower values for the factors using face-centred CCD were set at +alpha (α=+1) and -alpha (α=-1) thus, all the factors were chosen within the limits.
The effects of the two independent variables (amount of BSP and amount of cornmeal) on the texture (hardness and crispness) and colour (L*, a* and b*) of the cornflakes were investigated. Two factors with three levels were used and 12 runs with different amount of BSP and cornmeal were conducted. The details of the experimental design of RSM are shown in Table 1.
|
Run |
Independent Variables |
Responses |
|||||||
|
Weight of cornmeal (g) |
Weight of BSP (g) |
Texture |
Colour |
||||||
|
Coded Level (x1) |
Actual Level (X1) |
Coded Level (x2) |
Actual Level (X2) |
Crispness (Y1) |
Hardness (g) (Y2) |
L* (Y2) |
a* (Y3) |
b* (Y4) |
|
|
1 |
1 |
30 |
-1 |
0 |
43.40 |
1870.54 |
72.57 |
0.45 |
39.46 |
|
2 |
1 |
30 |
1 |
15 |
20.40 |
927.30 |
61.18 |
7.94 |
31.28 |
|
3 |
-1 |
15 |
1 |
15 |
35.20 |
3049.94 |
56.22 |
9.90 |
29.04 |
|
4 |
-1 |
15 |
-1 |
0 |
73.00 |
2232.09 |
70.83 |
1.52 |
36.93 |
|
5 |
0 |
22.5 |
0 |
7.5 |
57.60 |
6975.43 |
63.11 |
7.60 |
32.23 |
|
6 |
0 |
22.5 |
0 |
7.5 |
45.60 |
7198.97 |
62.03 |
7.96 |
35.04 |
|
7 |
0 |
22.5 |
-1 |
0 |
77.00 |
3021.32 |
71.21 |
1.12 |
38.00 |
|
8 |
0 |
22.5 |
0 |
7.5 |
44.00 |
6447.41 |
61.19 |
8.71 |
36.00 |
|
9 |
0 |
22.5 |
0 |
7.5 |
60.00 |
6265.66 |
61.48 |
7.42 |
36.85 |
|
10 |
-1 |
15 |
0 |
7.5 |
25.20 |
4248.85 |
58.89 |
9.09 |
34.90 |
|
11 |
1 |
30 |
0 |
7.5 |
7.80 |
3266.99 |
63.32 |
7.70 |
38.08 |
|
12 |
0 |
22.5 |
1 |
15 |
60.60 |
2756.05 |
58.00 |
9.68 |
34.79 |
Table 1: Experimental design in coded (x) and actual value (X) of variables and experimental results.
Preparation of cornflakes
The cornflakes were prepared according to 12 experimental runs. The preparation of cornflakes was according to the work done by [14] with slight modification. These formulated mixed were further mixed with fixed ingredients i.e., sugar (10.5g) and salt (1g). The water was added as 1:1 ratio to cornmeal and BSP mixer to make good consistency dough. The ingredients were mixed well with a rubber spatula in a mixing bowl. The oven (model EPRC-9860E/SS; ELBA) was preheated to 170? for 15 minutes to ensure the temperature of the oven reach the setting temperature. The dough was placed between two silicon baking tray cloth and pressed to get 1.0 mm thin layer of dough which measured the thickness later using calliper. The chips were left to bake at 160? for 3.5 minutes and then the cornflakes were turned over to bake for another 4 minutes. After baking, the cornflakes were cooled to ambient temperature and packed in airtight containers for further analysis i.e., textural properties and colour measurements.
Textural properties of cornflakes
The hardness and crispness of cornflakes were determined by a texture analyser TA. XTplusC (Stable Micro System, Godalming, and Surrey, UK). The hardness and crispness of cornflakes were measured using a Multiple Puncture probe by compressing cornflakes at one turn in a plastic vessel. The cornflakes samples subjected to deformation were filled at a height of 3.0 cm in the vessel and compression of 60% of the sample height. The hardness is defined as the maximum force achieved when the sample is compressed. The crispness is defined as the number of force peaks when the sample undergoes compression. The following settings were used: pre-test speed, 5 mm/s; test speed, 1 mm/s; post-test speed, 15 mm/s; distance, 15 mm; trigger force, 5g. The tests were also performed by making 5 replicates per batch.
Colour measurement of cornflakes
Colour is one of the most important parameters for acceptability of the product. The colour parameters (L*, a* and b*) were evaluated according to the CIELab system, in a chroma meter (model CR-410; Konica Minolta, Japan). The letters L*, a* and b* represents the whiteness–blackness, redness-greenness and yellowness-blueness of the sample, respectively. Calibration was done according to standard white reference tile. The readings were performed triplicates per sample.
Optimization procedure and validation of model
Optimization of the two factors and multiple responses was carried out using numerical optimization technique. From 12 experimental runs, only several or one conditions were selected by RSM as optimum formulation for BS fortified cornflakes. The desired goals for optimum texture and colour range were determined based on the result obtained from the analysis and the closeness of the responses’ value with commercial cornflakes (Kellogg’s Corn Flakes). By conducting another set of experiments based on selected optimum condition, the experimental result for texture and colour were obtained and compared with predicted result from optimise model to determine the adequacy of response surface model. The verification can be calculated by using percentage error and percentage error that is lower than 5% indicates a good fit [15].
 where mev is experimental value and mpv is predicted value.
Determination of TDF
The determination of TDF was accomplished according to the guideline provided [16] by using Megazyme Total Dietary Fibre Kit that consists of thermostable α-amylase, purified protease, and purified amyloglucosidase.
Comparison between optimum BSP fortified cornflakes with control and commercial cornflakes
The optimum BSP fortified cornflakes were compared with control and commercial cornflakes in terms of TDF content, texture, colour and sensory organoleptic.
Sensory evaluation of cornflakes
The sensory evaluation of corn flakes was conducted using a 7-point hedonic scale with 7=like extremely, 5=neither like nor dislike and 1=dislike extremely. 44 untrained panels from UniCITI ALAM Residential College were involved in the evaluation. The aspects considered for analysis were colour, aroma, taste, crispiness, and overall acceptability. The test location was at Food Preparation and Sensory Laboratory, UniCITI Alam Residential College. The average scores of all the panellists were computed for different characteristics.
Statistical analysis
A second-order polynomial equation in function of X were fitted for each response which is crispness (X1), hardness (X2), L* (X3), a*(X4), and b* (X5).
 Where Y is predicted response and β0 is constant coefficients of the model. The regression coefficient (β1 and β2), (β12) and (β11 and β22) represents linear, interaction and quadratic effects respectively. X is the independent variables with X1 are crispness of cornflakes and X2 is hardness of cornflakes.
All analysis results in RSM were reported as mean. The statistical analysis was performed by using statistical package Design Expert version 12.0.3.0 (Stat-Ease Inc., Minneapolis, USA). All statistical significance was determined at 5% significance level (P < 0.05). The adequacy of the model was determined by considering R2 value above 80% and insignificant lack-of-fir test (P>0.05) as good indicators of fitting. In case of comparison and sensory analysis, data were reported as mean ± SD. The data was assessed by single factor analysis of variance (ANOVA) and by Tukey test with probability ≤ 0.05 by using IBM SPSS Statistics (Version 26) predictive analytics software.
Results And Discussions
The corresponding fitting of the models and the experimental data of the texture (hardness and crispness) and colour (L*, a*, and b*) of cornflakes were analysed. The result of analysis of variance (ANOVA) has been presented in Table 2. The coefficient of determination (R2) provides a measure of the variability in the observed values and it was used to judge the adequacy and fitness of the model. The value of R2 which is more than 0.75 is relatively adequate for prediction. Furthermore, the lack-of-fit indicates the failure of the model representing the experimental data. A significant lack-of-fit value (P>0.05) is mostly preferred because it indicates that this value was not significant relative to the pure error and all predictive models that can be developed to be applied within the experimental range at any values [17]. Further, 3D surface plots showed the interaction among independent variables in relation to the observed responses.
|
Source |
Cripsness |
Hardness |
L* |
a* |
b* |
||||||||||
|
F-value |
p-value |
R2 |
F-value |
p-value |
R2 |
F-value |
p-value |
R2 |
F-value |
p-value |
R2 |
F-value |
p-value |
R2 |
|
|
Model |
15.35* |
0.0047 |
0.8777 |
144.75* |
<0.0001 |
0.9863 |
39.31* |
< 0.0001 |
0.8846 |
18.12* |
0.0011 |
0.7740 |
22.83* |
0.0005 |
0.8136 |
|
X1 |
10.60* |
0.0225 |
|
29.10** |
0.0030 |
|
5.86* |
0.0418 |
|
1.15 |
0.3151 |
|
6.63* |
0.0328 |
|
|
X2 |
16.54* |
0.0097 |
|
0.3697 |
0.5697 |
|
72.76* |
<0.0001 |
|
35.09* |
0.0004 |
|
39.02* |
0.0002 |
|
|
X1X2 |
0.9120 |
0.3834 |
|
11.27* |
0.0202 |
|
|
|
|
|
|
|
|
|
|
|
X12 |
41.21* |
0.0014 |
|
175.69* |
<0.0001 |
|
|
|
|
|
|
|
|
|
|
|
X22 |
18.08* |
0.0081 |
|
342.05* |
<0.0001 |
|
|
|
|
|
|
|
|
|
|
|
Lack-of-Fit |
0.3341 |
0.8071 |
|
4.86 |
0.1754 |
|
14.69 |
00651 |
|
8.10 |
0.1140 |
|
0.6493 |
0.7115 |
|
|
Coded equation |
51.13-10.30X1-12.87X2 + 3.70 X1 X2 -31.46 X12+ 20.84 X22 |
6655.25 -577.67X1-65.11X20440.27 X1 X2 -2198.92X12-3068.16X22 |
63.34+1.85X1-6.54X2 |
6.59–0.7367X1 + 4.07X2 |
35.22+1.33X1 3.21X2 |
||||||||||
|
*Significant (P < 0.05), X1 amount of cornmeal (g), X2 amount of BSP (g), R2 coefficient of determination, CV coefficient of variation, |
|||||||||||||||
Table 2: ANOVA of response surface model for textural properties and colour measurement of cornflakes.
Effect of cornmeal and BSP on texture properties and colour measurement of cornflakes
Crispness
Result for the crispness of formulated corn flakes varied between 7.8 to 77.0 (Table 1). The significance (P < 0.05) of quadratic model was indicated by 15.53 F-value and 0.3341 lack-of -fit (Table 2). The equation model in the coded units for crispness (Y1) was fitted into the second-order polynomial equation as shown in Table 2. From (Figure 1), the response surface for crispness appeared as a saddle shape. Similar observation was reported by [18] that the addition of pea dietary fibre caused the structure inside of biscuit becomes loose and hence lowers the crispness of crisp biscuit. However, [19] reported that the crispness of extruded products increased with the increasing level of potato fibre. This might be attributed to the greater starch digestibility and the microstructure was weaker and more breakable. 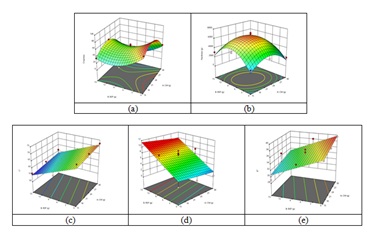
Figure 1: Response surface plot for (a) crispness, (b) hardness, (c) L*, (d) a* and (e) b*.
Hardness
Results for the hardness of corn flakes varied between 927.302 g to 7198.970 g (Table 1). R2 value of 0.9863 and F-value of 144.75 (Table 2) exhibited that response surface model for hardness was significant (P<0.05), which was further exemplified by the lack-of-fit. The equation model in the coded units for hardness (Y2) was fitted into the second-order polynomial equation as shown in Table 2. The cornmeal significantly affects the hardness of the corn flakes with P=0.0030, meanwhile, the bamboo shoot powder insignificantly (P=0.5697) affects the hardness of the corn flakes. From Figure1b, the increment of cornmeal (from 15g to 21g) and bamboo shoot powder (0g to 7g) increased the hardness of corn flakes to a maximum point and then lowered the hardness of corn flakes. [20] Reported that the water holding capacity of carrot pomace fibre powder had caused the increment of water content in dough and the dough with high water content resulted in formation of gluten network which causes the cookies to be harder. In contrast, the addition of dry residue from wild oregano resulted in the decrement of hardness of corn flakes product due to the fibres in wild oregano which reduce the pore wall thickness and expansion ratio [21]. Nevertheless, the hardness values in this project cannot represent the actual situation. Theoretically, the higher the maximum force, the harder the corn flakes. However, the hardness values for fortified corn flakes samples that have a soft texture were higher than that of having a hard texture. This might be due to when the probe penetrated through the corn flakes samples, the soft samples were not broken and accumulated at the bottom of the vessel then caused the probe resisting a higher force than it should be.
L*
Table 1 showed the results for L* value of cornflakes varied between 56.22 and 72.57. The model F-value of 39.31 indicates that the model is significant while the lack-of-fit F-value of 14.69 indicates that it is not significant relative to pure error (Table 2). The fitness of the model was further conformed by a satisfactory value of R2, indicating that 88.46% variability in response was predictable by the model selected. Increment in cornmeal and BSP significantly decreased (P=0.0418 and P<0.0001, respectively) the L* values of samples. The decrease in lightness may be explained by the fact that BSP exhibits a brownish colour. For that reason, a decrement in lightness values with the addition of BSP was expected because of the colour of BSP. The decrement in lightness of cornflakes containing fortified BSP is in accordance with [22].
a*
The results of a* value of cornflakes varied between 0.45 and 9.90 (Table 1). The results of ANOVA assured the goodness of fit for the model with significant model F-value, non-significant lack of fit and satisfactory R2 (Table 2). As can be seen from Figure 1d, the fortification of increasing BSP level caused a significant increase in redness (a*) values of samples (P=0.0011). Generally, the darker samples tend to give more reddish spectrum [23] and hence, it might attribute that the incorporation of BSP into cornflakes produces a darker and more reddish cornflakes.
b*
The results of b* value of cornflakes varied between 29.04 and 39.46 (Table 1). The R2 value of 0.8136 shows that the model for b* is adequate to describe the experimental result (Table 2). The model F-value of 22.83 indicates that the model is significant while the lack-of-fit F-value of 0.6493 indicates that it is not significant relative to pure error (Table 2). As can be seen from Figure 1e, higher BSP level caused a significant (P=0.0002) decrease in b* values of samples meanwhile higher cornmeal level caused a significant (P=0.0328) increase in b* values. This is in accordance with [22] who have reported a decrease in b* value (P < 0.05) of biscuit with increasing addition of BSP which attributed to the caramelisation of sugar substances during baking.
Optimization and validation of model
The numerical optimization was employed to generate optimum amount of cornmeal and BSP by setting certain goals for each response. The goal for cornmeal (15g-30g), L* (56.22-76.57), a* (0.45-9.9), and b* (29.04-39.64) was set in a range which means any value selected within the range was favourable. Meanwhile, the amount of BSP was set as maximise in order to obtain maximum TDF content of fortified cornflakes. The goal of the crispness was set following the crispness of Kellogg’s cornflakes® (34-66). The maximum crispness was set to make cornflakes as crispy as possible. However, the hardness attribute was not preceded for optimization as the values from experimental run were incorrect. Thus, the response of hardness was neglected and set as none.
The optimized formulation corresponded to a cornmeal amount of 22.183 g and a BSP amount of 13.538g. The optimized formulation was prepared to obtain the result for crispness and colour profile (L*, a*, and b*). The predicted values were validated with experimental value and found that all the responses were predicted well as the percentage error was within 5%.
Comparison between the control, optimized and commercial cornflakes
Table 3 shows that the BSP fortified cornflakes was significantly higher in terms of TDF content (16.25 ± 0.35%) as compared to the control (3.99 ± 0.10%) and commercial cornflakes (4.81 ± 0.24%). The increment of TDF content in optimized BSP fortified cornflakes could be the result of the incorporation of BSP during cornflakes formulation. Similar observations were reported by [16,24] for cookies and functional biscuits that were fortified with bamboo shoot powder respectively. According to the US Food and Drug Administration (2016) [25], a food product that contain 20 percent or more of the DRV (more than 5.5g) per Reference Amount Customarily Consumed (RACC) allows “high” source claim. Therefore, the optimized bamboo shoot fortified corn flakes in this project may be claimed as a high source of dietary fibre for the functional health benefits.
|
Parameter |
|
Control (Cornmeal only) |
Bamboo Shoot Powder Fortified Corn Flakes |
|
Kellogg’s Corn Flakes |
|
Total dietary fibre (%) |
|
3.99 ± 0.10 a |
16.25 ± 0.35 b |
|
4.81 ± 0.24 a |
|
Crispness |
|
86.2 ± 9.12 b |
56.6 ± 7.77 a |
|
52.8 ± 8.40 a |
|
L* |
|
71.31 ± 0.37 b |
58.54 ± 0.65 a |
|
60.80 ±1.03 c |
|
a* |
|
1.49 ± 0.29 b |
9.68 ± 0.09 a |
|
11.00 ± 0.73 c |
|
|
|
|
|
|
|
|
b* |
|
36.29 ± 0.21 a |
34.06 ± 0.68 a |
|
47.18 ± 1.58 b |
Table 3: Comparison of crispness, colour measurement, and the total dietary fibre content of control, optimized corn flakes, and commercial corn flakes.
The mean ± SD within a row superscripted with different alphabets are significantly (p ≤ 0.05) different using the Tukey test.
Crispness result showed that BSP fortified cornflakes and commercial cornflakes had significantly lower crispness (56.6 ± 7.77 and 52.8 ± 8.40, respectively), compared to control (86.2 ± 9.12). The differences in texture flakes are caused by differences in protein, fat, crude fibre and also the amount of starch in raw materials [26]. The goal of crispness for the optimum cornflakes was set according to the crispness of Kellogg’s corn flakes during optimization step in RSM, hence, there was no significant difference of crispness (P>0.05) between them.
Lightness (L*) of BSP fortified cornflakes was significantly (P<0.05) lower (58.54 ± 0.65) than the control (71.31 ± 0.37) and commercial cornflakes (60.80 ± 1.03). This can be proved from (Figure 2) which shows that the BSP fortified cornflakes were darker compared to others. Initially, the BSP itself had a darker colour compared to cornmeal. Therefore, the darker colour of fortified cornflakes might due to the presence of BSP in the formulation. A similar result was found by [27] and they concluded that increasing the amount of BSP resulted in a significant (P<0.05) smaller L* value of cooked pork batters compared with that of control.
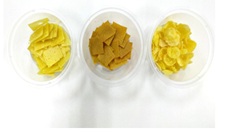 Figure 2: Visualisation of the corn flakes for control, optimized corn flakes and commercial corn flakes.
Meanwhile, redness (a*) of optimized cornflakes was significantly (P < 0.05) higher (9.68 ± 0.09) than the control (1.49 ± 0.29), but lower than commercial cornflakes (11.00 ± 0.73). On the other hand, yellowness (b*) of optimized cornflakes was significantly lower (34.06 ± 0.68) than the control (36.29 ± 0.21), but higher than commercial cornflakes (47.18 ± 1.58). The observation in colour (L*, a* and b*) of fortified cornflakes was consistent with the findings of [22] which reported the various amounts of BSP added into biscuit and pork nuggets decreased the L* and b* values but increased the a* value. Besides that, different cornflakes processing method and ingredients used in formulations could also be the reasons for different values of colour.
Sensory evaluation
Sensory acceptance of the food products is equally important along with fortification and enrichment with various nutrient elements [24]. To assess the acceptability of the optimized formulation of bamboo shoot fortified corn flakes, a hedonic sensory evaluation was carried out. The transformed data of colour, aroma, taste, crispness, and Overall Acceptability (OA) of the control, optimized and commercial corn flakes were presented in Table 4.
|
Types of cornflakes |
Mean Sensory Score |
||||
|
Colour |
Aroma |
Taste |
Crispness |
OA |
|
|
Control |
5.45±1.35 b |
5.55±1.11 b |
5.89±1.15 b |
5.98±0.98 b |
5.93±0.79 b |
|
Bamboo shoot powder fortified cornflakes |
4.30±1.00 a |
4.39±1.28 a |
4.11±1.17 a |
4.61±1.32 a |
4.41±0.97 a |
|
Commercial cornflakes |
6.20±0.79 c |
5.41±1.28 b |
5.82±1.19 b |
6.41±0.73 b |
6.02±0.88 b |
Table 4: Sensory analysis of the corn flakes samples.
The mean±SD within a column superscripted with different alphabets are significantly (p ≤0.05) different using Tukey test.
A sensory evaluation of colour acts as a very important parameter in the judgment of properly condition of cornflakes which not only reflects the appropriate amount of raw material used for the preparation but also gives the information concerning the formulation and quality of the product [11]. From the result observed, the colour of the optimized cornflakes was significantly scored (P<0.05) lower (4.30 ± 1.00) compared to that of control (5.45 ± 1.35) and commercial cornflakes (6.20 ± 0.79). This less preference by the panellist might be due to the darker colour of optimized corn flakes, as seen in (Figure 2) that is caused by the darker colour of the BSP. A similar observation was made from [22] where the score for the colour of fortified biscuit decreased from 7.50 ± 0.82 to 6.30 ± 1.16 with increasing levels of incorporated BSP from 0% to 15%.
The aroma of optimized cornflakes was also significantly (P < 0.05) lower (4.39 ± 1.28) compared to that of control (5.55 ± 1.11) and commercial cornflakes (5.41 ± 1.28). This might be due to the pungent smell of bamboo shoot powder [24].
Another criteria is taste where it is a major factor in the acceptance of newly produced product [11]. The taste of optimized cornflakes was significantly lower (4.11 ± 1.17) compared to that of control (5.89 ± 1.15) and commercial corn flakes (5.82 ± 1.19). The taste of the fortified cornflakes was less acceptable and might be caused by the slight bitterness that was present in the raw BS due to the high polyphenol content [22]. In addition to that, there is a connection in the colour of food and their palatability [28]. A darker colour of optimized cornflakes which differs from the commercial cornflakes may cause the less preference by the panellists.
Texture of the corn flakes was affected with the addition of BSP. Sensory results for the crispness of optimized cornflakes were significantly (P<0.05) lower (4.61 ± 1.32) compared to that of control (5.98 ± 0.98) and commercial cornflakes (6.41 ± 0.73). This result can be gleaned from the finding that the perception of food acceptance of consumers can be affected by the flavour and texture of food [28]. In addition, an established preference would developed by consumers towards the familiar product [29]. Hence, there was a higher preference score for commercial cornflakes in terms of crispness.
The crispness of cornflakes was analysed by both using consumer acceptance and instrumental measurement. Nonetheless textural analysis results observed the control to a have higher crispness value compared to that of commercial cornflakes (Table 3). Meanwhile, there was no significant difference (P>0.05) between the crispness of optimized and commercial cornflakes in terms of sensory acceptance (Table 4). This can be assumed that the taste of cornflakes might affect the liking of panellists on texture. [30] Reported that bread with no added bitter germ extracts significantly scored better than the breads with bitter germ extract in terms of taste, texture, appearance liking, and overall acceptance. Therefore, it was important to take into consideration of the result from instrumental texture measurement and consumer acceptance.
Overall acceptability (OAA) scoring is a subjective evaluation in confirming the product acceptability by the consumer. Overall acceptability of optimized cornflakes was significantly (P<0.05) lower (4.41 ± 0.97) compared to that of control (5.93 ± 0.79) and commercial cornflakes (6.02 ± 0.88). This proved that the colour, aroma, taste, and texture definitely contributed to the overall preference by the panellist. Hence, panellist mostly preferred control and the commercial samples as compared to optimized bamboo shoot fortified corn flakes.
Conclusion
Present study successful prepared BSP that has a TDF content of 43.09% ± 0.79. Besides that, CDD Design RSM using was also been incorporated to be tool for optimising the effect of cornmeal and BSP on the texture and colour of cornflakes. All the statistical significant terms such as R2 values, F-value and lack-of-fit had shown the adequacy of the model. The optimum formulation of fortified cornflakes was obtained at 22.183g of cornmeal and 13.538g of BSP. These optimum fortified cornflakes are able to give desirable texture properties and colour measurement.
The TDF content of optimum fortified cornflakes is 16.25% ± 0.35 and this makes it suitable to be claim as high fibre source according to FDA. As comparison, the TDF content of optimized cornflakes is 12.26% and 11.44% higher than that of control and commercial cornflakes, respectively. The natural dark colour of BSP was resulted in darker, more reddish and less yellow fortified cornflakes compared to the control. In terms of textural properties, addition of BSP lowered the crispness compared to control, but it was insignificant (P>0.05) difference from commercial cornflakes.
Both instrumental texture and sensory evaluation play an important role to assess the conformity of BSP fortified cornflakes to sensory specifications. In the current project, crispness was measured by both texture analyser and sensory evaluation. Even the result of crispness measured by the texture analyser showed that commercial cornflakes had the lowest crispness, the preferences on crispness by panellists for commercial cornflakes was scored the highest that due to the familiarity towards the commercial cornflakes. Hence, the result of sensory evaluation showed that panellist mostly preferred control and commercial samples as compared to optimized BSP fortified cornflakes.
In overall, this is the initial study for the development of BSP fortified products. It has a huge potential to be developed as novel food industry, especially in Malaysia. BS is getting more popular as a healthy and nutritionally supplemented food. The BS which has a short post harvesting time can be processed into powder form and hence, has the advantages of longer shelf life, easy for packaging and long-distance transportation. Apart from that, the BSP can be easy to add and incorporate with other food products. Thus, it can be used as fortification purpose.
References
- Ashakiran S, Kiran D (2012) Fast foods and their impact on health. Journal of Krishna Institute of Medical Sciences University 1: 7-15.
- Bahadoran Z, Mirmiran P, Azizi F (2016) Fast food pattern and cardiometabolic disorders: A review of current studies. Health Promot Perspect 5: 231-240.
- The Lancet (2019) High intake of dietary fiber and whole grains associated with reduced risk of non-communicable diseases.
- World Health Organization (2018) Healty diet.
- American Association of Cereal Chemists (2001) Report of the dietary fibre definition committe 46: 112-126.
- Bisht M, Chongtham N, Santosh O (2018) Bamboo shoot as a potential source of dietary fiber for food fortification.
- Nongdam P, Tikendra L (2014) The nutritional facts of bamboo shoots and their usage as important traditional foods of Northeast India. International Sc Res Noti 14:1-16.
- Chongtham N, Bisht MS, Haorongbam S (2011) Nutritional properties of bamboo shoots: Potential and prospects for utilization as a health food. Comprehensive Reviews in Food Science and Food Safety 10: 153-168.
- Abdullah MMH, Gyles CL, Marinangeli CPF, Carlberg JG, Jones PJH, et al. (2015) Dietary fibre intakes and reduction in functional constipation rates among Canadian adults: A cost-of-illness analysis. Food Nutr Res 59: 28646-28646.
- Santosh O, Bajwa H, Bisht M, Chongtham N (2018) Freeze-dried bamboo shoot powder for food fortification: Enrichment of nutritional content and organoleptic qualities of fortified biscuits. MOJFPT 2: 342-348.
- Naeem N (2015) Effect of bamboo powder supplementation on physicochemical and organoleptic characteristics of fortified cookies. Food Sc Tech 4: 7-13.
- Nirmala C, Sheena H, David E (2009) Bamboo shoots: A rich source of dietary fibres. Dietary fibres, fruit and vegetable consumption and health, Klein F, Moller G (Eds) USA: Nova Science Publishers 15-30.
- Rawat K, Nirmala C, Bisht M (2015) Processing techniques for reduction of cyanogenic glycosides from bamboo shoots. In: Proceeding of the 10th World Bamboo Congress, Korea.
- Beanpanda Cooking Diary (2016) Homemade corn flakes cereals.
- Pathera AK, Riar C, Yadav S, Sharma D, Yadav YS, et al. (2017) Optimization of dietary fiber enriched chicken nuggets for different cooking methods. J of Food Me & Cha 1386-1397.
- Megazyme (2017) Total dietary fibre assay procedure.
- Šumi? Z, Vakula A, Tepi? A, ?akarevi? J, Vitas J, et al. (2016) Modeling and optimization of red currants vacuum drying process by response surface methodology (RSM) Food Chemistry 203: 465-475.
- Su-fen L, Jian-fu L (2015) Effect of pea dietary fiber on the texture of dough and crisp biscuit. Food Technology 14: 131-133.
- Parada J, Aguilera JM, Brennan C (2011) Effect of guar gum content on some physical and nutritional properties of extruded products. Journal of Food Engineering 103: 324-332.
- Sahni P, Shere DM (2017) Physico-chemical and sensory characteristics of carrot pomace powder incorporated fibre rich cookies Asian. Journal of Dairy and Food Research 36: 327-331.
- Kosutic M, Filipovic J, Pezo L, Plavsic D, Ivkov M (2016) Physical and sensory properties of corn flakes with added dry residue of wild oregano distillation. Journal of the Serbian Chemical Society 81: 51-51.
- Choudhury M, Badwaik LS, Borah PK, Sit N, Deka SC (2015) Influence of bamboo shoot powder fortification on physico-chemical, textural and organoleptic characteristics of biscuits. Journal of Food Science and Technology 52: 6742-6748.
- Oliveira LC, Alencar NM, Steel CJ (2018) Improvement of sensorial and technological characteristics of extruded breakfast cereals enriched with whole grain wheat flour and jabuticaba (Myrciaria cauliflora) peel. LWT 90: 207-214.
- Santosh O, Bajwa HK, Bisht MS, Nirmala C (2019) Functional biscuits from bamboo shoots: Enrichment of nutrients, bioactive compounds and minerals in bamboo shoot paste fortified biscuits. International. Journal of Food Science and Nutrition 4: 89-94.
- Food and Drug Administration H (2016) Food labeling: Revision of the nutrition and supplement facts labels. Final rule. Federal Register 81: 33741-33999.
- Agustia FC, Rosyidah S, Subardjo YP, Ramadhan GR, Betaditya D (2019) Formulation of Flakes made from mocaf-black rice-tapioca high in protein and dietary fiber by soy and jack bean flour addition. In: Proceeding from IOP Conference Series: Earth and Environmental Science, IOP Publishing, 255: 012019.
- Li K, Liu JY, Fu L, Zhao YY, Zhu H, et al. (2020) Effect of bamboo shoot dietary fiber on gel properties, microstructure and water distribution of pork meat batters. Asian-Australasian Journal of Animal Sciences 33: 1180.
- Tamayo FA, Tamayo PAA (2020) Sensory Evaluation, Acceptability and Proximate Analysis of Bambusa blumeana as Bamboo Shoot Cupcake: A Product Development. International Journal of Disaster Recovery and Business Continuity 11: 33-43.
- Chen YC (2019) Understanding and assessing cultural differences in sensory preferences. Cereal Foods World 64.
- Bakke A, Vickers Z (2011) Effects of bitterness roughness PROP taster status and fungiform papillae density on bread acceptance. Food Quality and Preference 22: 317-325.
Citation: Nordin R, Ko CW (2022) Optimization Study on Fortified Bamboo Shoots Corn Flakes Based on Fibre Content and Physical Analysis. J Food Sci Nutr 8: 141.
Copyright: © 2022 Rumaisa Nordin, et al. This is an open-access article distributed under the terms of the Creative Commons Attribution License, which permits unrestricted use, distribution, and reproduction in any medium, provided the original author and source are credited.