Oral Vitamin D Therapy and Clinical Characteristics of the Tear Film following Routine Phacoemulsification
*Corresponding Author(s):
Larysa TutchenkoDepartment Of Ophthalmology, Shupyk National Medical Academy Of Postgraduate Education, Kyiv, Ukraine
Tel:+380 678046720,
Email:LarysaTutchenko@gmail.com
Abstract
Objective: To determine the effects of Vitamin D supplement on tear volume, tear film stability, ocular surface integrity and comfort after phacoemulsification encompassing a 2.2mm self-sealing clear corneal incision at the vertical meridian.
Methods: Twenty-five patients taking 600 IU cholecalciferol daily for up to 1month postop (group I,) were compared with a control group (II, n=25). Tear Meniscus Height (TMH), fluorescein Break-Up Test (BUT), Schirmer I test, ocular surface comfort (self-assessment ten-point discrete scale 0=No discomfort, 10=very uncomfortable) & staining (Oxford scale) checks were made on all eyes. Patients were checked at preop, 1 week, 1&2 months postop.
Results: The key significant findings (p<0.05) were, at 1 month postop in groups I and II respectively, mean (±sd, 95%CI) TMH were 0.20mm (±0.09, 0.16-0.24) and 0.12mm (±0.09,0.06-0.17) and median (range) ocular surface comfort score were 2.0 (0-8) and 4.0 (1-7). There was a significant linear relationship between the change in TMH and TMH at preop in group I (r=0.581, n=22 p=0.011) and II, (r=0.908, n=12 p<0.001). Mean (±sd, 95%CI) serum vitamin D levels increased from 20.87ng/ml (±8.72, 17.38-24.35) to 25.78ng/ml (±10.52, 20.46-31.11). At 2 months postop mean (±sd, 95%CI) TMH was 0.12mm (±0.12,0.09-0.15) after vitamin D therapy had ceased in group I and TMH reduced from a preop of 0.29mm (±0.25,0.19-0.38) to 0.11mm (±0.11, 0.03-0.19) in group II.
Conclusion: Oral ingestion of vitamin D appears to maintain, if not improve, tear volume and improve ocular comfort after cataract surgery. Without daily vitamin D supplementation, tear volume and comfort reduced after phacoemulsification.
Keywords
Phacoemulsification; Tears; Vitamin D
INTRODUCTION
The reported incidence of dry eye after cataract surgery ranges from 9.8% to 32% [1-6]. The aetiology underpinning this includes loss of conjunctival goblet cells, impaired meibomian gland function and damage to corneal nerves [5]. It has been claimed, 80% of cataract patients have an abnormal tear test result, and over 50% have meibomian gland dysfunction, prior to surgery [7,8]. Several studies report tear stability, and Schirmer 1 test scores, reduce after routine cataract surgery [2,3,9-18]. And, some claim that tear stability returns to preop levels by 3 months postop [11,13,15,19]. Others found tear volume and osmolarity were unaffected by routine phacoemulsification [12,20]. Nevertheless, damage to the lid margin and meibomian glands occurs, surface staining increases, conjunctival goblet cell count falls and metaplasia of the conjunctival epithelium is encountered, after cataract surgery [2,3,10,12,13,15,17,18,21, 22].
Reduced blood serum levels of Vitamin D(25(OH)D) have been shown to correlate with signs such as reduced tear volume and stability in dry eye [23-29]. However, there is conflicting evidence in the literature. One study, based on 16,396 patients, reported no link between serum 25(OH)D and dry eye [30]. Another, based on 17,542 patients, reported serum 25(OH)D was reduced in patients with dry eye symptoms [31].
Dry Eye is characterized by changes in tear composition and ocular surface inflammation [32-35]. Surgical intervention at the ocular surface generates an inflammatory response that could lead to dry eye symptoms. Could oral administration of vitamin D preserve the stability and volume of tears at the ocular surface after routine phacoemulsification?
The aim of this study was to determine the effects of oral ingestion of vitamin D on ocular comfort, surface integrity, tear film stability and volume after routine unremarkable phacoemulsification.
MATERIALS AND METHODS
Measurement of tear stability and volume
Tear film stability was evaluated by the fluorescein Break-Up Test (BUT) [36]. Tear volume was assessed by routine Schirmer 1 test [37], and measurement of the Tear Meniscus Height (TMH) along the lower lid margin approximately half-way between the canthi using a standard slit lamp biomicroscope [38]. The incident slit light beam was kept at the narrowest setting, and lowest light intensity (to avoid reflex lacrimation), but still allowed the TMH to be observed. An image of the TMH was captured using a smart phone fixed to the eyepiece. The actual height of the tear meniscus was measured, after calibrating the arrangement, using a suitable scale. The setup was calibrated at each session of data collection. The typical magnification at each session was approximately x35. One member of the team (MS) performed these tests in order to limit inter-operator variability.
Assessment of ocular surface integrity
Ocular surface integrity was assessed using the Oxford scale after staining with lissamine green [39]. This scale consists of 5 pictures allowing for comparison of any surface staining. The categories range from 0 (no staining) through to 5 (severe staining).
Assessment of ocular surface comfort
Patients were asked to rate the comfort of each eye using a 10-point discrete scale [40]. This consisted of a 10cm line with graduations labelled, 0=no discomfort, 10=very uncomfortable eye feeling very itchy and gritty all the time.
Assessment of serum Vitamin D
Both endogenously produced or food-derived vitamins, D2 (ergocalciferol) and D3 (cholecalciferol), are hydroxylated by the liver into 25-hydroxy vitamin D(25(OH)D), the major circulating metabolite of vitamin D with a plasma half-life 2-3 weeks. Thus, the plasma concentration of 25(OH)D is the primary indicator of vitamin D status [41]. A reliable and economically viable Enzyme-Linked Immunosorbent Assay (ELISA) was used for assessing 25(OH)D levels [42]. Blood serum levels, of the 25 patients recruited to receive daily vitamin D supplements, were assessed before vitamin D supplementation and 30 days later (less than 8 days after Vitamin D treatment had ceased). These subjects arrived in the morning (07:00-10:00am) with an empty stomach following an overnight uninterrupted sleep of no less than 8 hrs. Subsequently, a resting venous blood sample (12 mL) was obtained, by venipuncture and collecting into a vacutainer tube, from an antecubital forearm vein. Plasma samples were measured for 25(OH)D concentration using an ELISA kit (Euroimmun AG, Luebeck, Germany). Blood samples were taken only from the subjects that agreed to take the vitamin supplement. This was carried out for sake of cost and minimising the distress of intrusion.
Vitamin D supplement
A recommended minimal daily dose of vitamin D supplementation safe for most people is 600 IU [43]. As such, a 600 IU vitamin D supplement in the form of cholecalciferol capsules (D-cap 600, ?-??? 600, Omnifarma, Ukraine http://omnifarma.kiev.ua/products/d-kap) was chosen for this study.
Subject recruitment
A power equation should be used to calculate the number of subjects that should be enrolled in a clinical trial [44]. However, the data required to compute the power equation was not available as the necessary assumptions regarding the likely treatment outcomes could not be made, with ample confidence, to proceed. Previous studies, based on oral antioxidants and tear film stability, reported statistically significant improvements in cohorts of 20 and 40 subjects [45,46]. A more recent study by Yang et al., [27] reported significant reduction in dry eye symptoms and staining in 32 dry eye patients after oral vitamin D supplementation. These earlier trials were not based on surgical cases. Thus, for the current investigation it was decided that a sample of 25 subjects should be given the vitamin D supplement and 25 should act as a control group.
Study design
This was a prospective, consecutive, partially masked, single-centre, observational pilot study that was approved by the local ethics committee and followed the tenets of the Declaration of Helsinki. Throughout the study, the investigator gathering the data on tear volume, stability, surface staining and comfort remained unaware which patient was, or was not, taking vitamin D. All patients signed consent forms after the aims and procedures of the investigation were fully explained. From the outset, measurements were taken from patients on a consecutive, case-by-case, and basis. Patients were randomly assigned to one of two groups namely: Group I (n=25, given D-cap600 [?-???600, Omnifarma, Ukraine http://omnifarma.kiev.ua/products/d-kap] for daily intake for up to 30 days following surgery) or Group II (n=25 control). Group 1 patients were encouraged and reminded to comply with the routine of taking the vitamin D supplement every day. All patients were Caucasian, residents of Kyiv, Ukraine (latitude 50.45466°N), where the study was conducted between November 2017 and March 2018. Prior to surgery all patients went through the full mandatory, according to the local protocol, laboratory and clinical examinations and tests. All patients were asked to continue with their normal diets over the course of the study, encouraged and reminded to return for all scheduled follow-up visits. A flow chart showing the schedule of events is shown in Figure 1.
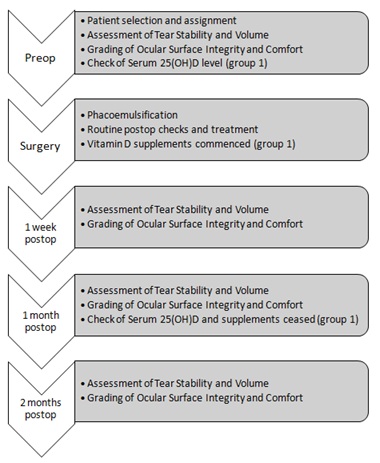 Figure 1: Step-by-step flow chart showing the schedule of events over the course of the study.
Exclusion criteria
Other than the need for cataract surgery, none of the patients enrolled had any history of active (or previous) ocular conditions, or surgery involving either the anterior or posterior segment, or had any complications with respect to surgery (e.g. hyper-mature longstanding hard cataracts, capsule rupture, vitreous loss), or during the postop period (e.g. corneal oedema, uveitis). At the time of the study, none of the patients had any severe health conditions which could additionally influence the anterior eye surface or vitamin D absorption/level (e.g. previous intestinal surgery, neoplasms, inflammation, autoimmune and endocrinological diseases, abnormal haematology, strict dietary limitations, intake of regular medication or antibiotics three months prior to the study).
Description of surgery and postoperative treatment
Routine uneventful surgery was performed under topical anaesthesia through a 2.2mm self-sealing clear corneal incision at the vertical meridian by one surgeon (LT). In all cases, a corneal tunnel at 12 o’clock and paracenteses of 1.2mm at 3 and 9 o’clock, were made. Circular capsulorhexis, of 5.0mm, was followed by lens hydro dissection, phacoemulsification and bimanual cortex removal using the Infinity Vision System (Alcon Surgical, Inc). A hydrophobic acrylic 1-piece monofocal IOL was inserted into the capsular bag. The surgical wound was closed by stromal hydration. Surgery was completed with injections of dexamethasone (subconjunctival) and beta methasone (parabulbar). The time taken to complete surgery was monitored to quantify the duration of ocular surface exposure. Postoperative treatment included topical drops of levofloxacin, dexamethasone and indomethac in with a gradual tapering off, dexpanthenol gel and a combination of trehalose and hyaluronic acid. IOP was within normal limits at all examinations.
Pre- and postoperative assessment of ocular surface and tears
Subjects were asked to rate their ocular comfort scores before any other tests. TMH was measured, fluorescein was instilled, BUT was measured and ocular surface staining assessed. The subject rested for five minutes, and then the Schirmer 1 test was performed. The order of data procurement remained unchanged throughout the study.
STATISTICAL ANALYSIS
Data were stored on an Excel spread sheet (Microsoft, Redmond, WA) and analysed in two steps as follows.
Step 1
Firstly, a comparison of pre-and 1-month postop levels of serum 25(OH)D levels in group I (paired t-test). Secondly, an intergroup comparison of the duration of ocular surface exposure during surgery (t-test).Thirdly, within each group, to determine the significance of any) interocular differences in TMH, Schirmer, BUT, comfort and staining scores (t-test or Mann-Whitney U test), ii) intraocular difference between pre-and postop TMH, Schirmer, BUT, comfort and staining scores (paired t-test or Wilcoxon matched pairs signed rank test). Thirdly, to determine the significance of any differences in TMH, Schirmer, BUT, comfort and staining scores between the operated and unoperated eyes at each stage of the investigation (t-test or Mann-Whitney U test).
Step 2
For the operated eyes, to estimate the significance of any i) association between changes (preop-postop value) in TMH, Schirmer, BUT, comfort and staining scores with preop baseline values (Spearman’s rho or Pearson correlation coefficient [r]), ii) intergroup differences in the gradients of any significant linear associations between changes in TMH, BUT, comfort and staining scores and preop baseline values (repeat measure ANOVA, according to requirements described by Diedenhofen, et al. [47].
Non-parametric tests were used where applicable. Paired t-, and Wilcoxon matched pairs signed rank, test was performed on data obtained from patients at postop and their corresponding data harvested at preop. The significance level was set at p<0.05.
RESULTS
Group I (vitamin D) consisted of 15 females and 10 males (mean age 73±9.7, range 48-82 years) and group II (control group) consisted of 16 females and 9 males (mean age 71.1±8.2, range 51-83 years). Twenty-six returned for planned follow up at 1-week (17 group I and 9 group II),34at 1-month (22 group I and 12 group II) and 24 at 2-months (15 group I and 9 group II) postop. The chief results are shown in tables 1-3 and figures 2-6. In both groups, there were no significant interocular differences with respect to TMH, Schirmer, BUT, comfort and staining scores at any time during the study. Some patients did not attend all follow up visits, consequently paired t- and Wilcoxon matched pairs signed rank tests were performed on data obtained at postop and the corresponding data obtained at preop. The key findings were as follows.
|
TMH Group |
Pre-op |
1 week |
1 month |
2 months |
|
I, operated |
0.18mm (±0.10, 0.14-0.22) |
0.20mm, (±0.10, 0.14-0.24). |
0.20mm, (±0.10, 0.16-0.24). |
0.12mm, (±0.12, 0.09-0.15) |
|
I, unoperated |
0.19mm, (±0.09, 0.16-0.23) |
0.18mm, (±0.11, 0.13-0.23) |
0.21mm, (±0.08, 0.17-0.24) |
0.13mm, (±0.08,0.09-0.17) |
|
II, operated |
0.29mm (±0.25,0.19-0.38) |
0.14mm, (±0.04, 0.12-0.17]. |
0.12mm, (±0.11,0.05-0.18) |
0.11mm, (±0.11,0.03-0.19) |
|
II, unoperated |
0.22mm, (±0.09,0.18-0.26) |
0.16mm, (±0.06,0.12-0.20) |
0.18mm, (±0.13,0.10-0.25) |
0.09mm, (±0.09,0.02-0.17) |
|
Schirmer Test Group |
Pre-op
|
1 week
|
1 month
|
2 months
|
|
I, operated |
8.90mm (±5.7, 6.7- 1.1) |
11.7mm (±6.3, 8.7-14.7) |
14.2mm (±8.6, 10.4-18.0) |
11.2mm (±9.0, 6.7-15.8) |
|
I, unoperated |
10.9mm (±7.2,8.1-13.8) |
10.5mm (±6.1,7.6- 13.4) |
13.5mm (±7.9,10.1-17.0) |
12.1mm (±750,10.1-17.0) |
|
II, operated |
15.4mm (±8.1,12.2-18.6) |
19.3mm (±9.3,13.2-25.3) |
17.3mm (±9.3,12.1-22.6) |
14.4mm (±5.6,10.8-18.1) |
|
II, unoperated |
16.2mm (±8.2,13.0-19.4) |
19.4mm (±89,13.6-25.2) |
17.1mm (±9.6,12.5-21.7) |
13.7mm (±7.8,8.7-18.8) |
Table 1: Tear Volume. The mean (±sd, 95% confidence interval) Tear Meniscus Height (TMH) and Schirmer test values at each stage of the study are shown for groups I (Vitamin D treatment group) and II (control group) for both operated and unoperated eyes.
|
Group |
Pre-op |
1 week |
1 month |
2 months |
|
I, operated |
6.9s (±4.2,5.3-8.5) |
7.2s (±2.9,5.8-8.6) |
8.8s (±4.5,6.8-10.8) |
9.6s (±7.3,6.7-11.9) |
|
I, unoperated |
6.0s (±3.1,4.8-7.2) |
7.8s (±3.5,6.1-9.4) |
8.9s (±4.1,7.1-10.7) |
8.6s (±4.2,6.5-10.78) |
|
II, operated |
8.4s (±4.8,6.5-10.3) |
5.7s (±2.1,4.3-7.1) |
8.6s (±4.7,5.9-11.2) |
7.2s (±1.6,6.1-8.2) |
|
II, unoperated |
8.8s (±4.4,7.1-10.5) |
7.7s (±3.0,5.7-9.6) |
6.7s (±4.6,4.1-9.3) |
6.7s (±3.7,4.2-9.1) |
Table 2: Tear Stability. The mean (±sd, 95% confidence interval) tear break up times (BUT, in seconds) at each stage of the study are shown for groups I (Vitamin D treatment group) and II (control group) for both operated and unoperated eyes. Apparent changes in the mean value of BUT were not significant (p≥0.05).
|
Group |
Pre-op |
1 week |
1 month |
2 months |
|
I, operated |
i.4.5(0-10) ii.1.0(0-4) |
i.4.0(0-9) ii.1.0(0-1) |
i.2.0(0-8) ii.0.0(0-2) |
i.2.0(0-5) ii.0.0(0-1) |
|
I, unoperated |
i.5.0(0-10) ii.1.0(0-3) |
i.5.0(0-8) ii.1.0(0-2) |
i.2.0(0-9) ii.1.0(0-4) |
i.2.0(0-5) ii.0.0(0-1) |
|
II, operated |
i.2.5(1-7) ii.1.0(0-3) |
i.2.0(1-5) ii.0.5(0-1) |
i.4.0(1-7) ii.0.0(0-1) |
i.5.0(2-5) ii.0.0(0-1) |
|
II, unoperated |
i.3.5(1-9) ii.1.0(0-3) |
i.3.0(1-4) ii.0.0(0-1) |
i.3.0(0-8) ii.0.0(0-1) |
i.4.0(1-5) ii.0.0(0-2) |
Table 3: Categories of ocular surface (i) comfort and (ii) staining according to the Oxford scale. The median, and range, of the scores at each stage of the study are shown for groups I (Vitamin D treatment group) and II (control group) for both operated and unoperated eyes.
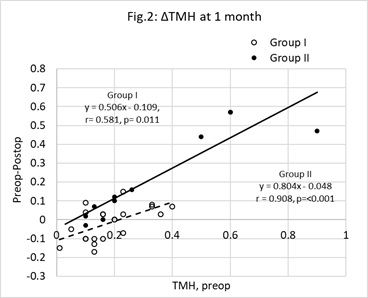
Figure 2: Change (Δ) in Tear Meniscus Height (TMH) at one month postop. Unfilled circles represent group I (Vitamin D treatment group) cases, filled circles represent group II (control group). The change (ΔTMH = preop TMH minus postop TMH) was significantly correlated with the preop value (x). The characteristics of the least squares regression lines linking ΔTMH (y) with x were, group I (broken line) y=0.506x-0.109 (r=0.581, n=22, p=0.011) and group II (unbroken line) y=0.804x-0.0486 (r=0.908, n=12, p<0.01).The points below the y=0 line represent cases where TMH improved. There is a greater proportion of unfilled, as opposed to filled, circles below this line (z=-1.953, p=0.023). N.B, some data points overlap each other.
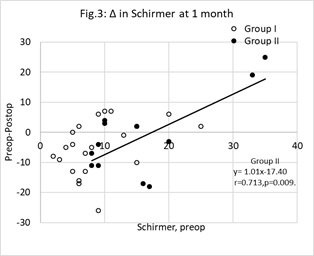
Figure 3: Change (Δ) in Schirmer test scores at one month postop. Unfilled circles represent group I (Vitamin D treatment group) cases, filled circles represent group II (control group). The change (y= preop score minus postop score) was significantly correlated with the preop score (x) in group II only. For group II, the least squares regression line linking y with x was, y=1.01x- 17.40 (r=0.713, n=12, p<0.01). The points below the y=0 line represent cases where Schirmer test score improved. N.B, some data points overlap each other.
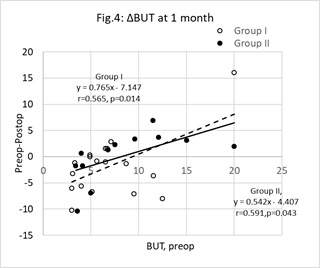
Figure 4: Change (Δ) in Tear Break-Up Time (BUT) at one month postop. Unfilled circles represent group I (Vitamin D treatment group) cases, filled circles represent group II (control group). The change (ΔBUT = preop BUT minus postop BUT) was significantly correlated with the preop value (x). The characteristics of the least squares regression lines linking ΔTMH (y) with x were, group I (broken line) y=0.765x-7.147(r=0.565, n=22, p=0.014) and group II (unbroken line) y = 0.542x-4.407 (r=0.591, n=12, p=0.043). The points below the y=0 line represent cases where BUT improved. There is a greater proportion of unfilled, as opposed to filled, circles below this line (z=1.793, p=0.037). N.B, some data points overlap each other.
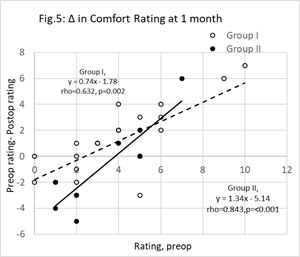
Figure 5: Change (Δ) in comfort scores at one month postop. Unfilled circles represent group I (Vitamin D treatment group) cases, filled circles represent group II (control group). The change (y = preop score minus postop score) was significantly correlated with the preop value (x). The least squares regression lines linking y with x were, group I (broken line) y=0.74x-1.78 (r=0632, n=22, p<0.01) and group II (unbroken line) y = 1.34x-5.14 (r=0.591, n=12, p<0.01). The points below the y=0 line represent cases that reported a fall in comfort. N.B, some data points overlap each other.
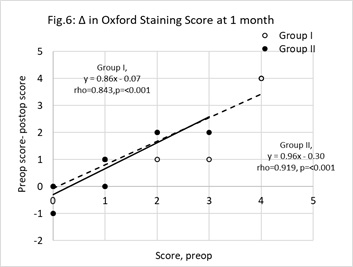
Figure 6: Change (Δ) in staining scores at one month postop. Unfilled circles represent group I (Vitamin D treatment group) cases, filled circles represent group II (control group). The change (y = preop staining score minus postop staining score) was significantly correlated with the preop value (x). The least squares regression lines linking y with x were, group I (broken line) y=0.86x-0.07 (r=0.843, n=22, p<0.01) and group II (unbroken line) y = 0.96x-0.30 (r=0.919, n=12, p<0.01). The points below the y=0 line represent cases where staining became worse. N.B, some data points overlap each other.
Step 1
Serum levels
For the group I cases that returned at 1-month postop, the mean (±sd) serum 25(OH)D level increased significantly (paired t-test, p=0.041) from 20.87ng/ml (±8.72, 95%CI, 17.38-24.35) to 25.78ng/ml (±10.52, 95%CI, 20.46-31.11).
Duration of surgery
The mean (±sd) duration of surgery was 9.5mins (±1.5, 95%CI, 7-11) in group I and 9.2mins (±1.1, 95%CI, 8-10) in group II. The difference was not significant (t-test, p>0.05). Ocular surface exposure during surgery did not exceed 12 mins in any single case.
Longitudinal changes: Comparisons between pre-and postop values.
Group I, operated eyes
TMH reduced from a preop mean (±sd) value of 0.18mm (±0.10, 95%CI, 0.14-0.22) to 0.12mm (±0.12, 95%CI, 0.09-0.15) at 2-months postop (paired t-test, p=0.017). Schirmer scores improved from preop mean (±sd) of 8.90mm/5mins (±5.7, 95%CI, 6.7-11.1) to 14.2mm/5mins (±8.6, 95%CI, 10.4-18.0) at 1-month (Wilcoxon matched pairs sign rank test, p=0.007). Median (range) comfort score reduced from 4.5(0-10) at preop to 2.0(0-8) at 1-month (Wilcoxon matched pairs sign rank test, p=0.034) remaining at 2.0(0-5) by 2-months (Wilcoxon matched pairs sign rank test, p=0.026) postop. Median (range) staining score reduced from 1.0(0-4) at preop to 0.0(0-2) at 1-month (Wilcoxon matched pairs sign rank test, p=0.002) remaining at 0.0(range, 0-1) by 2-months (Wilcoxon matched pairs rank sign test, p=0.003) postop.
Group I, contralateral unoperated eyes
TMH reduced from a preop mean (±sd) value of 0.19mm (±0.09, 95%CI, 0.16-0.23) to 0.13mm (±0.08, 95%CI, 0.09-0.17) at 2-months postop (paired t-test, p=0.025). Median (range) comfort score reduced from 5.0(0-10) at preop to 2.0(0-9) at 1-month (Wilcoxon matched pairs sign rank test, p=0.005) remaining at 2.0(0-5) by 2 months (p=0.004) postop. Median (range) staining reduced from 1.0(0-3) at preop to 0.0(0-3) at 1-month (Wilcoxon matched pairs sign rank test, p=0.045) remaining at 0.0(0-1) by 2-months (Wilcoxon matched pairs sign rank test, p=0.0) postop.
Group I, interocular comparisons
At preop, 1 week, 1 and 2-months postop the respective p values were; 0.285, 0.360, 0.191 and 0.314 (t-test) for TMH; 0.146, 0.291, 0.393 and 0.389 (Mann-Whitney U test) for Schirmer test scores; 0.214, 0.322, 0.482 and 0.279 (Mann-Whitney U test) for BUT; 0.333, 0.338, 0.467, 0.206 and 279 (Mann-Whitney U test) for comfort; 0.111, 0.107, 0.061 and0.464 (Mann-Whitney U test) for staining.
Group II, operated eyes
TMH fell from a preop mean (±sd) value of 0.29mm (±0.25, 95%CI, 0.19-0.38) to0.12mm (±0.11, 95%CI, 0.05-0.18) at 1-month postop (paired t-test, p=0.005) and 0.11mm (±0.11, 95%CI, 0.03-0.19) at 2-months postop (paired t-test, p=0.023). Median (range) staining reduced from 1.0(0-3) at preop to 0.0(0-1) at 1-month (Wilcoxon matched pairs sign rank test, p=0.034) remaining at 0.0(0-1) at 2-months (Wilcoxon matched pairs sign rank test, p=0.036) postop.
Group II, contralateral unoperated eyes
TMH reduced from a preop mean (±sd) value of 0.22mm (±0.09, 95%CI, 0.18-0.26) to 0.09mm (±0.09, 95%CI, 0.02-0.17) at 2-months postop (paired t-test, p=0.007).
Group II, interocular comparisons
At preop, 1 week, 1 and 2-months post op the respective p values were; 0.109, 0.425, 0.198, and 0.328 (t-test) for TMH; 0.382, 0.485, 0.474 and 0.425 (Mann-Whitney U test) for Schirmer test scores; 0.402, 0.085, 0.173 and 0.370 (Mann-Whitney U test) for BUT;0.212, 0.225, 0.379 and 0.242 (Mann-Whitney U test) for comfort; 0.358, 0.400, 0.500 and 0.422 (Mann-Whitney U test) for staining.
Operated eyes: Intergroup comparison of TMH, Schirmer, BUT, comfort and staining scores at each stage of the investigation
At preop, there was a significant difference in Schirmer test (Mann-Whitney U test, p=0.002). Preop mean (±sd) values were, group I 8.9mm/5mins (±5.69, 95%CI, 6.68-11.14) and group II 15.3mm/5mins (±8.11, 95%CI, 12.20-18.55). At 1-month postop, there was a significant difference with respect to TMH (unpaired t-test, p=0.006) and comfort (Mann-Whitney U test, p=0.04). Mean (±sd) values for TMH were, group I0.20mm (±0.09, 95%CI, 0.16-0.24) and group II 0.12mm (±0.09, 95%CI, 0.06-0.17). Median (range) comfort scores were, group I 2.0(0-8) and group II 4.0(1-7). Differences between the groups were most prominent at 1-month postop. Thus, for the step 2 analysis, the changes in TMH, Schirmer, BUT, comfort and staining scores at 1-month postop were compared with the respective baseline values.
Unoperated eyes: Intergroup comparison of TMH, Schirmer, BUT, comfort and staining scores at each stage of the investigation
At preop, there was a significant difference in Schirmer test (Mann-Whitney U test, p=0.012).Preop mean (±sd) values were, group I 10.5mm/5mins (±6.92, 95%CI, 7.78-13.21), group II 17.7mm/5mins (±8.16, 95%CI, 14.53-20.93). A difference was also detected1-week later. At 1-month there was a significant difference in relation to BUT (Mann-Whitney U test p=0.015). Mean (±sd) values for BUT were, group I 8.89s (±4.12, 95%CI, 7.08-10.69) and group II 7.39s (±5.04, 95%CI, 4.54-10.25). At 2-months there was a significant difference in relation to TMH (unpairedt-test, p=0.032) and comfort (Mann-Whitney U test, p=0.018). Mean (±sd) values for TMH were, group I 0.13mm (±0.07, 95%CI, 0.09-0.17) and group II 0.09mm (±0.09, 95%CI, 0.02-0.17). Median (range) comfort scores were, group I 2.0(0-5) and group II 4.0(1-5).
Step 2
For the operated eyes, the indices of the best fit least squares regression lines linking the changes observed at 1-month post with the corresponding baseline values are shown in table 4. The process for comparing pairs of gradients [47] revealed no significant intergroup differences except for TMH (unpaired t=2.552, p=0.016).The change in TMH at 1-month postop and baseline values are shown in figure 2. Points below the y=0.0 line are cases where TMH improved. Compared with group II, there was a significantly greater proportion of group I cases below this line (z-test for two population proportions, z =-1.953, p=0.023).
|
|
Group I |
Group II |
Δ gradient |
|
TMH |
y=0.506x-0.109, r=0.581,p=0.011 |
y=0.804x-0.049, r=0.908, p<0.01 |
t=2.552,p=0.016 |
|
Schirmer |
y=0.629x-10.58, r=0.405,p=0.062 |
y=1.01x-17.40, r=0.713, p<0.01 |
|
|
BUT |
y=0.77x-7.15, r=0.565,p=0.014 |
y=0.54x-4.41,r=0.591,p=0.043 |
p=0.972 |
|
Comfort |
y=0.74x-1.78,rho=0.632, p<0.01 |
y=1.34x-5.14, rho=0.843,p<0.01 |
p=0.799 |
|
Staining |
y=0.88x-0.07, rho=0.843,p<0.01 |
y=0.96x-0.30, rho=0.918, p<0.01 |
p=0.977 |
Table 4: Correlation between individual changes in TMH, Schirmer test, BUT, comfort and staining scores at 1-month postop and baseline values. Group I= operated eyes of patients treated with vitamin D. Group II=operated eyes of the control patients. For each of the five measurements, the significance of inter group difference in the gradients was tested according to the procedures outlined by Diedenhofen, et al.[47]. The results of the comparisons, where applicable, are noted in the column labelled Δ gradient.
An association between individual changes in Schirmer test at 1-month postop and baseline values was significant in group II but not in group I. These data are shown in figure 3. The points below the y= 0 line are cases where the Schirmer test scores improved. An intergroup difference in the proportions below the y= 0 line was not significant (z=0.019, p=0.985).
The associations between individual changes in BUT at 1-month postop and base line values are shown in figure 4. Points below the y= 0.0 line are cases where BUT improved. Compared with group II, there was a significantly greater proportion of group I cases below this line (z- test for two population proportions, z=1.793, p=0.037).
The associations between individual changes in comfortat 1-month postop and baseline comfort scores are shown in figure 5. Points below the y= 0 line are cases where the comfort scores became worse. An intergroup difference in the proportions below the y= 0 line was not significant (z-test for two population proportions, z=0.066, p=0.948).
The association between individual changes in staining at 1-month postop and baseline staining scores are shown in figure 6. Points below the y= 0 line are cases where the comfort scores became worse. An intergroup difference in the proportion below the y= 0 line was not significant (z-test for two population proportions, z=0.768, p=0.221).
DISCUSSION
All patients were directed, and reminded, to adhere to the prescribed postop treatment regimen and return for all scheduled postop checkups. Of the fifty patients, 52% returned at 1 week, 68% at 1 month and 48% at 2 months post-op. Despite the cases that did not attend all postop visits, a significant fall in mean TMH was observed in the operated eyes not treated with vitamin D supplements (group II). This was evident at 1-monthpostop and remained low at 2-months postop. In contrast to this, the mean TMH in the operated eyes of group I remained stable until vitamin D treatment was withdrawn. The difference between the two groups of operated eyes could be related to different exposure times encountered during surgery. This can be ruled out as there was no significant intergroup difference in mean exposure times. Table 1 shows the similarity in mean TMH between the operated and unoperated eyes. In group I, the mean TMH remained unwavering and declined on cessation of vitamin D supplementation. In group II, mean TMH fell after surgery and thereafter remained low. This is in marked contrast with earlier reports claiming TMH remained unaffected by phacoemulsification [12] or returned to preop levels between 2-6 weeks after surgery [9,18]. Figure 2 compares the change in TMH at 1-month postop with the baseline value. In both groups the expected change in TMH can be predicted using the appropriate equations listed in table 4. For a preop TMH value of 0.20mm the predicted fall in TMH in a patient not treated with vitamin D would be is 0.11mm by 1-month postop whereas in a patient treated with vitamin D the predicted change would be less than 0.01mm. Figure 2 also shows that in both groups, the greater the preop TMH the greater the expected change in TMH by 1-month postop. Furthermore, the difference in the gradients between the two equations indicates that the greater the preop TMH, the greater the predicted fall in TMH in those patients not treated with the vitamin D supplement. Figure 2 gives the impression the difference in the gradients results from a small number of group II outliers. However, on closer examination the cluster of remaining group II data points are located on, or very close to, the best fit line. Excluding these three outliers increases the gradient to 1.101, reduces the correlation co-efficient to 0.759 and adjusts the p value to 0.017. The prediction of a substantial fall in TMH is still evident.
In figures 2 and 4, those cases below the preop-postop= 0 line are those where the tear volume and stability improved by 1-month after surgery. There is a significantly greater proportion of the group I cases below this line compared with group II. Clearly, there was a greater chance of obviating a fall in TMH in the group given the vitamin D supplement. The volume of tears at the ocular surface at any moment is the net result of the amount secreted, the loss from evaporation and drainage, following the blink. The vitamin D supplement influenced this balance by increasing the volume of tears.
Table 1 also shows the changes in the Schirmer test scores. In group II, there was no significant change in the Schirmer test in either the operated or contralateral unoperated cases. The results are in broad agreement with other studies that reported either no change in Schirmer test scores after phacoemulsification [12] or a tendency for any change to revert to preop levels by 6-weeks postop [18]. In group I, there were no differences between the operated and unoperated eyes at each stage of the investigation, but the results of the Schirmer test improved in the operated cases by 1-month postop. For the operated eyes, Schirmer test score was significantly lower in group I compared with group II at preop only. It is tempting to accept that vitamin D supplementation improved the Schirmer test scores in the operated cases, however there was no concomitant change in the unoperated eyes. The change in Schirmer test score cannot be predicted on a case-by-case basis in group I. This is in stark contrast with the results shown in figure 2. The ambiguity of statistical outcomes calls into question the value of the Schirmer test for assessing the change in tear volume after cataract surgery.
The DEWS report highlighted the impact on ocular comfort and stability of the tear film resulting from damage to the meibomian glands [48]. The assault on the eyelids(from use of lid retractors), conjunctiva (from exposure, irrigation and postop drops)and cornea (from exposure and incisions) have a direct impact on the tissues that ultimately secrete the components of the tear film and contribute to ocular comfort [2,3,5,10,12,13,15-18,21,22]. Mean BUT remained unchanged over the duration of the study (as shown in table 2). Trattleret al., [2] found 63% of patients had BUT values below 5s after cataract surgery. In the current study less than 25% of all operated cases demonstrated a BUT below 5s at 1-month postop. Some have claimed that BUT returns to preop levels by 1-month post op [11,15,19] and others maintain that low BUT continuous to persist after 1-month postop [12,16,17,21]. Figure 4 shows the change in BUT in relation to preop BUT in both groups of operated eyes. The indices of the least squares a regression line predicts that, at 1-month postop, BUT tends to improve when the preop is ≤9s and reduces when the preop is ≥10s. On closer examination, there was a significantly higher proportion of group I cases (55%) below the preop-postop = 0 line compared with group II (33%). Therefore, a higher proportion of patients are predicted to present with an improved BUT, at 1-month postop, after taking a vitamin D supplement compared with those patients that did not. Conjunctival goblet cell count declines rapidly after cataract surgery [10] remaining below preop levels by 1-month postop [22]. The routine postop programme of drops may have facilitated an improvement in the stability of the tear film in some cases by either improving the ability of the ocular surface to anchor the precorneal tear film or reducing the rate of tear evaporation. BUT values tended to remain constant in the unoperated eyes, however by 1-month postop the mean BUT were greater in group I compared with group II. This might have been a statistical anomaly, but it does suggest that the higher proportion of improved cases in the unoperated cases of group I may have resulted from a further promotion of the tear film brought about by the vitamin D supplement. The study was conducted during the winter months. The temperature and humidity in the clinics could have facilitated an overall increase in BUT in some cases forcing upwards the mean BUT in both groups. This could have led to there being no statistically significant difference between the groups over the period of investigation.
Table 3 shows there was a significant fall in comfort scores in, operated and unoperated eyes of, group I by 1-month postop. In group II, there was no change in self-reported comfort. For the operated eyes at 1-month postop, group I patients rated a median score of 2.0 while group II patients rated a median score of 4.0. Turning to figure 5, the impression given is that a greater proportion of group I patient reported an improvement in comfort. The appropriate equations in table 4 predict, for a preop comfort score of 2, at 1-month postop the change in group I is negligible but up to 2.5 unit rise in discomfort in group II. The results should be viewed with caution because a placebo was not implemented. The patients using vitamin D were, to some extent, motivated to score an improved comfort rating. Table 3 also shows the staining scores reduced in the operated and unoperated eyes of both groups. Figure 6 shows there was no striking difference between groups I and II with respect to changes in staining scores in relation to baseline values. Thus, according to this benchmark, it cannot be said that vitamin D supplement was a factor that contributed to improving the status of the ocular surface.
CONCLUSION
In the group that did not take the vitamin D tablets, mean TMH reduced after phacoemulsification and this was still evident at 2-months postop. This presumably resulted from a combination of factors including, fall in rate of tear production, increase in rate of tear evaporation and maybe a rise in rate of tear drainage. Vitamin D supplementation appears to combat any of the factors that would cause TMH to fall after phacoemulsification and leads to a greater percentage of cases where BUT is enhanced. To the best of our knowledge, this is the first report based on the role of vitamin D supplementation in relation to clinical signs of dry eye after phacoemulsification. Further prospective long-term studies on larger cohorts of different patients, including various dosages of vitamin D supplementation, and placebo groups are necessary to determine the ideal limits of vitamin D intake to offset, mitigate and combat existing symptoms of dry eye. The results reported can be used, in conjunction with a power equation, to estimate the number of patients that should be enrolled in further long-term studies [44].
DECLARATION
None of the authors have any financial interest in any of the products or procedures mentioned in this paper. The study was self-financed.
REFERENCES
- Kasetsuwan N, Satitpitakul V, Changul T, Jariyakosol S (2013) Incidence and pattern of dry eye after cataract surgery. PLoS One 8: 78657.
- Trattler WB, Majmudar PA, Donnenfeld ED, McDonald MB, Stonecipher KG, et al. (2017) The prospective health assessment of cataract patients' ocular surface (PHACO) study: the effect of dry eye. Clin Ophthalmol 11: 1423-1430.
- Choi YJ, Park SY, Jun I, Choi M, Seo KY, et al. (2018) Perioperative ocular parameters associated with persistent dry eye symptoms after cataract surgery. Cornea 37: 734-739.
- Iglesias E, Sajnani R, Levitt RC, Sarantopoulos CD, Galor A (2018) Epidemiology of persistent dry eye-like symptoms after cataract surgery. Cornea 7: 893-898.
- Sutu C, Fukuoka H, Afshari NA (2016) Mechanisms and management of dry eye in cataract surgery patients. Curr Opin Ophthalmol 27: 24-30.
- Moss SE, Klein R, Klein BE (2018) Incidence of dry eye in an older population.Arch Ophthalmol 123: 369-373.
- Gupta PK, Drinkwater OJ, VanDusen KW, Brissette AR, Starr CE (2018) Prevalence of ocular surface dysfunction in patients presenting for cataract surgery evaluation. J Cataract Refract Surg 44: 1090-1096.
- Cochener B, Cassan A, Omiel L (2018) Prevalence of meibomian gland dysfunction at the time of cataract surgery. J Cataract Refract Surg 44: 144-148.
- Liu Z, Luo L, Zhang Z, Cheng B, Zheng D, et al. (2002) Tear film changes after phacoemulsification. Zhonghua Yan Ke Za Zhi 38: 274-277.
- Li XM, Hu L, Hu J, Wang W (2007) Investigation of dry eye disease and analysis of the pathogenic factors in patients after cataract surgery. Cornea 26: 16-20.
- Oh T, Jung Y, Chang D, Kim J, Kim H (2012) Changes in the tear film and ocular surface after cataract surgery. Jpn J Ophthalmol 56: 113-138.
- Han KE, Yoon SC, Ahn JM, Nam SM, Stulting RD, et al. (2014) Evaluation of dry eye and meibomian gland dysfunction after cataract surgery. Am J Ophthalmol 157: 1144-1150.
- Cetinkaya S, Mestan E, Acir NO, Cetinkaya YF, Dadaci Z, et al. (2015) The course of dry eye after phacoemulsification surgery. BMC Ophthalmol 30: 15-68.
- Devendra J, Singh S (2015) Effect of oral lactoferrin on cataract surgery induced dry eye: A randomised controlled trial. J Clin Diagn Res 9: 6-9.
- Park Y, Hwang HB, Kim HS (2016) Observation of influence of cataract surgery on the ocular surface. PLoS One 11: 0152460.
- Kim JS, Lee H, Choi S, Kim EK, Seo KY, et al. (2018) Assessment of the tear film lipid layer thickness after cataract surgery. Semin Ophthalmol 33: 231-236.
- El Ameen A, Majzoub S, Vandermeer G, Pisella PJ (2018) Influence of cataract surgery on meibomian gland dysfunction. J Fr Ophtalmol 41:173-180.
- Kohli P, Arya SK, Raj A, Handa U (2019) Changes in ocular surface status after phacoemulsification in patients with senile cataract. Int Ophthalmol 39: 1345-1353.
- Khanal S, Tomlinson A, Esakowitz L, Bhatt P, Jones D, et al. (2008) Changes in corneal sensitivity and tear physiology after phacoemulsification.Ophthalmic Physiol Opt 28: 127-134.
- González-Mesa A, Moreno-Arrones JP, Ferrari D, Teus MA (2016) Role of tear osmolarity in dry eye symptoms after cataract surgery. Am J Ophthalmol 170: 128-132.
- Hanyuda A, Ayaki M, Tsubota K, Negishi K (2019) Discrepancies in persistent dry eye signs and symptoms in bilateral pseudophakic patients. J Clin Med 8: 211-222.
- Kato K, Miyake K, Kondo N, Asano S, Takeda J, et al. (2017) Conjunctival goblet cell density following cataract surgery with diclofenac versus diclofenac and rebamipide: A randomized trial. Am J Ophthalmol 181: 26-36.
- Yildirim P, Garip Y, Karci AA, Guler T (2016) Dry eye in vitamin D deficiency: more than an incidental association. Int J Rheum Dis 19: 49-54.
- Shetty R, Deshpande K, Deshmukh R, Jayadev C, Shroff R (2016) Bowman break and subbasal nerve plexus changes in a patient with dry eye presenting with chronic ocular pain and vitamin D deficiency. Cornea 35: 688-691.
- Meng YF, Lu J, Xing Q, Tao JJ, Xiao P (2017) Lower serum vitamin D level was associated with risk of dry eye syndrome. Med Sci Monit 10: 2211-2216.
- Jin KW, Ro JW, Shin YJ, Hyon JY, Wee WR, et al. (2017) Correlation of vitamin D levels with tear film stability and secretion in patients with dry eye syndrome. Acta Ophthalmol 95: 230-235.
- Yang CH, Albietz J, Harkin DG, Kimlin MG, Schmid KL (2018) Impact of oral vitamin D supplementation on the ocular surface in people with dry eye and/or low serum vitamin D. Cont Lens Anterior Eye 41: 69-76.
- Demirci G, Karaman ES, Ozsutcu M, Eliacik M, Olmuscelik O, et al. (2018) Dry eye assessment in patients with vitamin D deficiency. Eye Contact Lens 44: 62-65.
- Shetty R, Sethu S, Chevour P, Deshpande K, Pahuja N, et al. (2016) Lower vitamin D level and distinct tear cytokine profile were observed in patients with mild dry eye signs but exaggerated symptoms. Trans Vis Sci Tech 5: 1-6.
- Jee D, Kang S, Yuan C, Cho E, Arroyo JG (2016) Serum 25-Hydroxyvitamin D levels and dry eye syndrome: Differential effects of vitamin D on ocular diseases. PLoS One 19: 0149294.
- Jeon DH, Yeom H, Yang J, Song JS, Lee HK, et al. (2017) Are serum vitamin D levels associated with dry eye disease? Results from the study group for environmental eye disease. J Prev Med Public Health 50: 369-376.
- Lemp MA, Baudouin C, Baum J (2007) The definition and classification of dry eye disease: Report of the definition and classification subcommittee of the International Dry Eye Workshop. Ocul Surf 5: 75-92.
- Lemp MA, Bron AJ, Baudouin C, Benítez Del Castillo JM, Geffen D, et al. (2011) Tear osmolarity in the diagnosis and management of dry eye disease. Am J Ophthalmol 151: 792-798.
- Julio G, Lluch S, Pujol P, Merindano MD (2012) Effects of tear hyperosmolarity on conjunctival cells in mild to moderate dry eye. Ophthal Physiol Opt 32: 317-323.
- McGinnigle S, Naroo SA, Eperjesi F (2012) Evaluation of dry eye. Surv Ophthalmol 57: 293-316.
- Lemp MA, Hamill JR (1973) Factors Affecting Tear Film Breakup in Normal Eyes. Arch Ophthalmol 89: 103-105.
- Farrell J, Grierson DJ, Patel S, Sturrock RD (1992) A classification for dry eyes following comparison of tear thinning time with Schirmer tear test. Acta Ophthalmol 70: 357-360.
- Mainstone JC, Bruce AS, Golding TR (1996) Tear meniscus measurement in the diagnosis of dry eye. Curr Eye Res 15: 653-661.
- Bron AJ, Evans VE, Smith JA (2003) Grading of corneal and conjunctival staining in the context of other dry eye tests. Cornea 22: 640-650.
- Price DD, McGrath PA, Rafii A, Buckingham B (1983) The validation of visual analogue scales as ratio scale measures for chronic and experimental pain. Pain 17: 45-56.
- Baeke F, Takiishi T, Korf H, Gysemans C, Mathieu C (2010) Vitamin D: modulator of the immune system. Curr Opin in Pharmacol 10: 482-496.
- Jassil NK, Sharma A, Bikle D, Wang X (2017) Vitamin D binding protein and 25-Hydroxy vitamin D levels: Emerging clinical applications. Endocrin Pract 23: 605-613.
- Ross AC, Taylor CL, Yaktine AL, Del Valle HB (2011). Dietary Reference Intakes for Calcium and Vitamin D (Pg no: 815), Institute of Medicine of National Academies. The National Academic Press, Washington DC, USA.
- Pocock SJ (2013) Clinical trials: A practical approach (Pg no’s: 1-141), John Wiley & Sons Ltd, Chichester, UK.
- Patel S, Plaskow J, Ferrier C (1993) The influence of vitamins and trace element supplements on the stability of the pre-corneal tear film. Acta Ophthalmol (Copenh) 71: 825-829.
- Blades KJ, Patel S, Aidoo KE (2001) Oral antioxidant therapy for marginal dry eye. Eur J Clin Nutr 55: 589-597.
- Diedenhofen B, Musch J (2015) Cocor. A comprehensive solution for the statistical comparison of correlations. PLoS One 10: 0121945.
- Craig JP, Nelson JD, Azar DT, Belmonte C, Bron AJ, et al. (2017) TFOS DEWS II Report executive summary. Ocul Surf 15: 802-812.
Citation: Tutchenko L, Skovron M, Patel S (2020) Oral Vitamin D Therapy and Clinical Characteristics of the Tear Film following Routine Phacoemulsification. J Ophthalmic Clin Res 7: 065.
Copyright: © 2020 Larysa Tutchenko, et al. This is an open-access article distributed under the terms of the Creative Commons Attribution License, which permits unrestricted use, distribution, and reproduction in any medium, provided the original author and source are credited.