Proficiency Test for Blood Alcohol Concentration in Forensic Laboratories: Spanish Experience
*Corresponding Author(s):
García-Repetto RNational Institute Of Toxicology And Forensic Sciences, Department Of Seville. Avda. Dr. Fedriani S/n 41009 Sevilla, Spain
Tel:+34 954371233,
Email:rosario.garciarepetto@justicia.es
Abstract
Ethanol is a well-known psychoactive drug whose intake strongly affects driving capability. As Blood Alcohol Concentration (BAC) is related to the car crash risk, most of the countries have set maximum legally permissible BAC levels for drivers. Therefore, one of the analyses performed by forensic toxicology laboratories is BAC determination.
In recent years, forensic science has experimented the need of improving standards and quality controls as there is a high probability that their results are questioned in court. Satisfactory participation in Proficiency Testing (PT) is one of the ways of demonstrating the competence of the laboratory.
The Department of Seville of Spanish National Institute of Toxicology and Forensic Science has been organizing a PT for BAC determination since 2019. A total of 36 samples were distributed between 2019 and 2022 to a total of 62 participants laboratories. The main objective of this paper is to communicate to the scientific community the results of our experience as PT provider. We can conclude that the participants showed a high level of competence, and the provider has implemented an effective procedure for test items preparation. The procedure applied to the statistical analysis of the results allowed the reliable estimation of assigned value.
Keywords
Blood alcohol concentration; Forensic toxicology; Proficiency testing; Spain
Introduction
Ethanol is a well-known psychoactive depressant drug consumed worldwide being one of the most widely used substances of abuse [1]. Since alcohol intake strongly affects the driving capability and the Blood Alcohol Concentration (BAC) is related to the car crash risk, many countries have taken steps to minimize the potential harm that can result from driving under the influence of alcohol by setting maximum legally permissible BAC levels for drivers, ranging from 0 to 0.8 g/L [2].
The Spanish regulation identifies two different threshold values: 0.5 and 1.2 g/L. Driving with a BAC higher than 0.5 g/L is forbidden and is object of an administrative sanction. Driving with a BAC greater than 1.2 g/L is defined as a crime [3]. Findings of a recent survey conducted to determine the prevalence of alcohol and other drugs in drivers killed in road traffic accidents in Spain showed that alcohol is still one of the most dangerous psychoactive substances used by drivers. Overall, 35.5 % of the driver population dead in road accidents tested positive for alcohol. Of those who tested positive for alcohol, 72.6 % were severely intoxicated (BAC ≥ 1.2 g/L) [4].
The determination of BAC for legal purposes is performed at forensic toxicology laboratories. As the reported results may imply severe legal consequences and there is a high probability of being questioned in court, their reliability must be demonstrated. Results reliability is achieved through method validation, quality control, and determination of uncertainty of measurement (MU) [5-7].
The growing concern over the accuracy of judgements reached by forensic examiners has led to a new emphasis on improving standards and quality controls as well as improving the underlying research foundations for forensic methods [8].
The international standard ISO/IEC 17025 requires from testing laboratories to use validated measurement procedures, certified reference materials and implement quality control procedures to ensure and/or demonstrate the validity of their results. One of this quality control procedures is the participation interlaboratory comparisons such as Proficiency Testing (PT) [9].
Participation in PT also helps the laboratory in the identification of analytical problems, the evaluation of method effectiveness, enhancing personnel skills, the monitoring of continuing performance and implementing adequate corrective actions for improvement [10,11]. All these benefits obtained by participation in PT explain why satisfactory participation over several rounds increases the confidence in laboratory’s results. Furthermore, accreditation bodies require regular participation in PT schemes covering all families of tests included in the scope to gain and maintain accreditation [12].
Forensic laboratories regularly complete PT designed to measure their performance, including as part of the routine accreditation of laboratories as it can be deduced from the 2016 report of US Department of Justice that claimed that a 98% of all US publicly funded crime laboratories had adopted some form of proficiency testing in 2014 [13].
The National Institute of Toxicology and Forensic Sciences, dependent of the Ministry of Justice, as the reference laboratory for forensic toxicology in Spain has been organizing a PT for BAC determination since 1995 in compliance with the international standards and the guidelines of the Spanish Accreditation Body (ENAC). The past four years PT has been provided by the Department of Seville of this organization. We present here the last four years results with the aim of assessing the PT scheme and to communicate to the scientific community the results of our experience as PT provider.
Bibliometric Study
A critical bibliographic review was performed by means of different online scientific electronic databases, such as Dimensions, Scopus, and Web of Science. Reviews were performed employing the following expressions: “Proficiency testing and blood and ethanol” “Proficiency testing and forensic toxicology” “Interlaboratory comparisons and forensic and ethanol and blood”. The period studied begun in year 2000 and finished in 2022. (Figure 1) depicts searching criteria applied in bibliometric study.
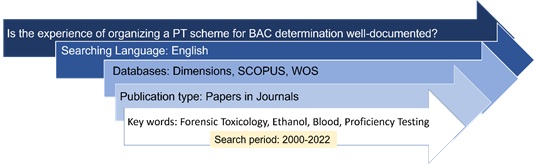 Figure 1: Searching criteria applied in bibliometric study.
The literature review conducted was compliant with Preferred Reporting Items for Systematic Reviews and Meta-Analyses (PRISMA) [14]. 107 documents were first identified using the electronic database mentioned above. 48 duplicates were eliminated. The titles and abstracts of the remaining 59 documents were reviewed to assess their relevance against exclusion criteria. 9 documents were not retrieved. According to established criteria total of 41 studies were excluded. Therefore, nine documents fulfilled inclusion criteria in this systematic review (Figure 2).
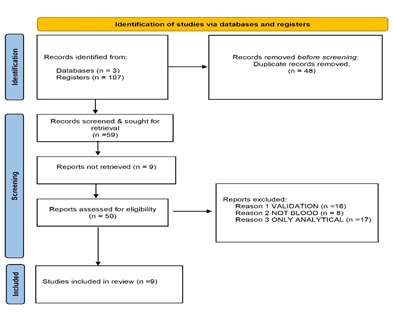 Figure 2: Results of bibliographic search according to PRISMA scheme.
Method
- PT scheme
The participants in this PT scheme are forensic toxicology and clinical laboratories. A total of 62 laboratories from Spain, Portugal, France, Kosovo, and North Macedonia have participated during the last 4 years, being the majority Spanish laboratories (87%). (Figure 3) depicts the distribution of laboratories by country. The participation to the interlaboratory scheme is totally free.
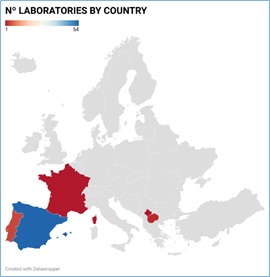 Figure 3: Country distribution of PT participant laboratories.
PT provider did not require the use of a specific analytical method. The laboratories were asked to provided information about the number of replicate BAC determinations they make, the types of ethanol reference standards used, analytical technique and inherent measurement uncertainty. Each participating laboratory was assigned with a number as identification code to maintain the relevant information on a confidential basis. The identification code was assigned randomly and changed each year. These codes are communicated to each participant individually together with the instructions of each PT round.
Three rounds each year are scheduled. Two blood samples and one plasma sample (1.8 mL each) with different ethanol concentrations are included in each shipment. Ethanol concentration results and their associated uncertainty, expressed in grams per liter, were requested within about 30 days from delivery and a confidential report and statistical evaluations (z-score) are returned approximately one month later. Data received from the participants were handled anonymously.
All communications between PT provider and participants were made electronically.
The procedure followed in each scheme round is:
- Registration of the participants
- Procurement, preparation, and quality control testing of test materials
- Dispatch of test materials to participants
- Participants analyze the test materials and report their results within the specified deadline
- Results are analyzed and the performance of laboratories assessed using appropriate statistical techniques
- We prepare a comprehensive report and distribute it to participants.
- We send performance summary reports and longer-term historical reports to each participant
- Round are reviewed and requirements for subsequent rounds are identified
Participants belong mostly to both the clinical and forensic laboratories. In small proportion, others belong to Defense, Security, Health, or University. The number of laboratories participants (62) number of samples (36) and the wide range of concentrations spiked in blood and serum samples (0-4 g/L), is allowing us to achieve good results.
- Pt Items preparation
Whole blood and plasma samples were obtained from Blood and Tissue Bank (Banc de Sang I Teixits Barcelona, Spain) (BST). Ethanol absolute (99.9% purity; 0.79 g/cm3) used to prepare PT items were purchased from Merck KGAA (Darmstadt, Germany).
Since 2010 there is an agreement between the Ministry of Justice, and the Generalitat of Catalonia, to acquire the blood and plasma bags from BST for the development of the project "Ethyl alcohol intercomparison exercise in blood”. Biological samples transferred from the BST biobank comply with the current regulations marked by the entry into force of Spanish Law 14/2007, on Biomedical Research, Spanish Royal Decree 1716/2011 of November 18, and by Regulation (EU) 2016/679 of the European Parliament and of the Council of April 27, 2016, concerning the protection of natural persons about the processing of personal data and the free circulation of this data. Indications for biological hazards associated to handling biological samples are included in the documentation attached to the shipments.
Each year, participating laboratories in the PT, must sign a commitment for the exclusive use of the items submitted for scientific purposes.
After verifying the absence of ethanol or other volatile compounds in the test materials purchased, blank samples were spiked with the appropriate quantity of ethanol. Sodium fluoride was used as preservative (1%). Obtained solutions were distributed in 2 millilitre-polypropylene screw caps tubes sealed with polypropylene caps.
Nine bottles of each PT item were randomly chosen and analysed in duplicate to test the homogeneity of the material. The statistical evaluation was performed according to the ISO 13528 [15]. The criterion for sufficient homogeneity was always met on different ethanol concentration levels.
Test materials are shipped in appropriate packaging and under conditions intended to maintain the integrity of the test materials during transit. Shipment packages were isothermal bags which included flexible cold accumulators to keep the temperature below 4°C during delivery. Expected delivery time is within 48 hours for all the participants. Shipment logistics was managed by Spanish official post and by tracking companies.
Participant laboratories are expected to communicate any incident or comment regarding the receipt of the samples and their status. Received claims are answered directly to the participant by email, notifying the decision made or the corresponding justification. They, also, will be published in the report.
- Statistical evaluation
A population of results is defined statistically as the infinite number of results that could be obtained and fitted by a probability distribution function. PT providers usually assume that the population of results is normally distributed with a mean µ and a standard deviation σ (denoted as x* and s* when are determined by consensus) [16].
ISO 17043 [17] recommends the use of using Algorithm A as it is described in Annex C of ISO 13528 [15] to perform the statistical analysis of PT results. This algorithm is an iterative procedure that uses robust statistics to minimize the influence of the outliers, by pulling them closer to the average value so they become less extreme [18]. Obtained estimates are used as consensus values. The iteration is performed until no significant deviations are observed, between one iteration and the next, in the third decimal place of the values assigned to the parameter calculated [15].
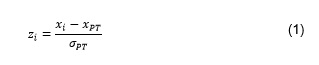
The robust estimate of the mean is known as the assigned value of the PT (xPT) and the robust estimate of standard deviation (σPT) is known as the Standard Deviation for Proficiency Assessment (SDPA) [19].
Laboratory performance is evaluated by the calculation of the parameter z-score. If xi is the reported value by the i-th (i=1..,n)participant in a round of PT and the random variable Z follows a standard normal distribution (Z~N(0,1)), z-score for the participant i (i=1,…,n) is calculated using equation 1 [16,18]:
 The distribution of z-score can be interpreted by the participants for the purpose of evaluating their own analytical performance compared with other laboratories as follows [20]. According to the standard ISO 13528, the interpretation of this value is as follows [15]:
- A result that gives |z_i |
- A result that gives 2≤|z_i |
- A result that gives |z_i |≥3 is considered unacceptable (action signal)
From the standard normal distribution, it can be calculated that a participant can be classified in a wrong way as questionable or unacceptable with probabilities of 4.3% and 0.3%, respectively [16].
The uncertainty of the assigned valued derived as a robust average from participants results (n) is estimated using equation 2 [21]:
 The standard uncertainty of the assigned value is negligible if its value complies with the inequality 3 [21,22]:
 All statistical calculations were conducted using Microsoft Excel Office 365.
- PT assessment
The main objective of the present paper is the assessment of PT scheme. Therefore, we want to know if there is a significant increase in the overall performance of the laboratories and if there is any laboratory that perform better than the rest. For further PT scheme improvement, it would be interesting to find some expert laboratory.
For answering these questions, the overall relative standard deviation in the different interlaboratory rounds is calculated to assess if it decreases over time, meaning that the performance improves [23]. Furthermore, percentage of satisfactory results for each laboratory are calculated to know if there are laboratories that constantly perform satisfactorily or unsatisfactorily.
To establish if there is an equivalence between theoretical concentration of the target value and assigned value, a regression analysis is performed. If both datasets are equivalents, the regression line must have a slope (m) close to 1 and an intercept (b) of zero. The following t-tests were applied (equations 4 and 5).

 Where Sm and Sb are slope and intercept standard error, respectively.
The calculated t-values are compared to the critical t value from the t-distribution table withn 2 degrees of freedom and 95% confidence level, being n the number of data pairs compared. If calculated t-values are lower than tabulated-t values, it can be concluded that both data sets are identical from a statistical point of view [24].
The same procedure as described above for demonstrating equivalence between target and assigned value was applied to establish if any of the participating laboratories could be considered as expert laboratory.
Results
A total of 36 samples were distributed between 2019 and 2022 to PT participating laboratories. 24 of them were blood samples whereas 12 of them were plasma samples. (Figure 4) shows the relationship between the assigned value and the target value for all of them. (Table 1) shows the results of t-test applied to slope and intercept using equations 4 and 5.
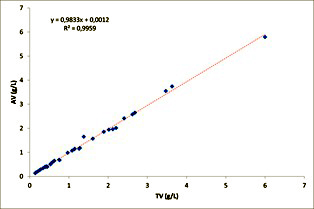
Figure 4: Linear Regression of assigned value against expected value.
|
|
Coefficient |
Standard Error |
t-Statistic |
|
|
Intercept |
0.001 |
0.02 |
0.1 |
>0.05 |
|
Slope |
0.98 |
0.01 |
1.5 |
>0.05 |
Table 1: Regression equivalence study between target value and assigned value (α=0.05; n=36; t critical=1.69).
Participating laboratories chose the analytical technique as PT provider did not require any specific one. (Figure 5) shows the percentage of laboratories that used one technique or other.
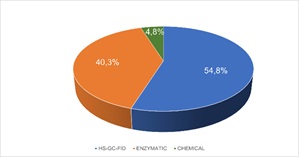 Figure 5: Analytical Techniques used by participant laboratories.
Once the laboratories reported their results, a Relative Standard Deviation (RSD) between laboratories (%) was calculated for each PT sample. (Figure 6) depicts the obtained results, showing that most of them were below 10% of variability.
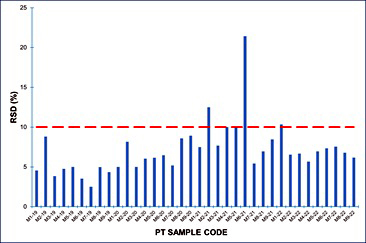 Figure 6: Relative standard deviation (%) of each PT sample.
Results reported by participating laboratories for each PT sample were subjected to statistical analysis according to ISO 13528 [15] has been described before. Z-score were calculated for each sample analyzed by each of the laboratories. (Figure 7) shows the percentage of satisfactory z-score obtained for each PT sample and the percentage of z-score |z|≤1 for blood samples. (Figure 8) shows the percentage of satisfactory z-score obtained for each PT sample and the percentage of z-score |z|≤1 for plasma samples.
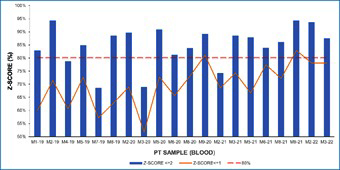 Figure 7: Percentage of satisfactory results (z-score≤2) and z-score≤1 in blood samples.
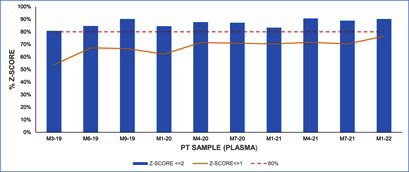 Figure 8: Percentage of satisfactory results (z-score≤2) and z-score≤1 in plasma samples.
No difference in the percentage of satisfactory results (p>0.05) were found when analyzing the possible influence of the analytical technique employed by PT participating laboratories (Figure 9&10).
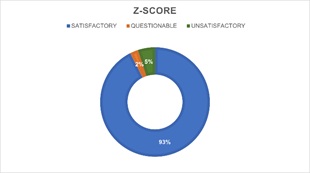 Figure 9: Percentage of z-score with enzymatic techniques.
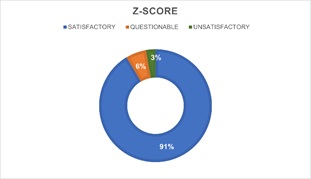 Figure 10: Percentage of z-score chromatographic techniques.
Laboratories were classified according to the number of samples analyzed and the number of satisfactory results obtained (Figure 11&12) shows the results of an analysis of the relationship between the assigned value and the results of the laboratory selected as reference laboratory using Pearson correlation coefficient. (Table 2) shows the results of t-test applied to slope and intercept using equations 4 and 5.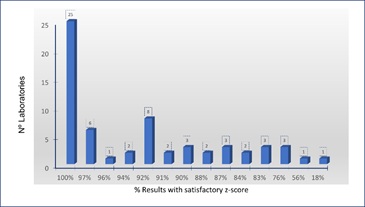 Figure 11: Laboratories according to the percentage of satisfactory z-score.
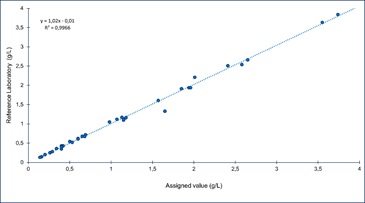 Figure 12: Linear Regression of reference laboratory results against target value.
|
Coefficient |
Standard Error |
t-Statistic |
|
|
Intercept 0.01 |
0.02 |
0.5 |
>0.05 |
|
Slope 1.02 |
0.01 |
1.2 |
>0.05 |
Table 2: Regression equivalence study between assigned value and participant selected as an expert laboratory (α=0.05; n=36; t critical=1.69).
Discussion
Bibliometric study rendered that there are only a few forensic toxicology PT schemes dedicated to BAC determination that have undergone peer-review and publication.
As PT provider we have two main tasks: Prepare and provide suitable, stable, and homogeneous samples and provide reliable assigned value for ethanol concentration in blood or plasma.
INTCFS did not perform any specific studies on ethanol stability in blood because according to revised bibliography BAC remains stable for more than 12 months when samples are stored in air-tight polypropylene tubes, with NaF as preservative and refrigerated at 4°C [20,25,26]. Moreover, other authors showed non-significant loss of ethanol in unopened, full, and unrefrigerated tubes after long-term storage [27] or in tubes stored at 38°C for 7 days [28]. Therefore, it was considered that PT samples’ shipping conditions employed allowed to ensure BAC stability.
Since the PT scheme was open to all laboratories willing to participate, any given PT round may include participants with little experience leading, in some cases, to biased results that do not represent the actual scatter of results among laboratories familiar with the method. To represent best estimates of the interlaboratory scatter robust statistics are employed to eliminate the effect of outlying observations [23].
PT items are designed to resemble the requirements of the actual casework considering the threshold values established by Spanish Traffic Law [3]. As mentioned above, ethanol absence in blank samples obtained from the blood and tissues bank was verified. Therefore, the expected value was calculated from the known quantity of ethanol spiked in the samples. The assigned value is the best estimate of the unknown true value [29]. Table 1 and (Figure 4), show that assigned values obtained from consensus were not different (p>0.05) to expected values, demonstrating the adequacy of the statistical procedure applied to derive the assigned value.
A total of 62 laboratories from five different European countries have participated over the years in our PT scheme. However, only 27 laboratories have participated in all rounds included in this study.17 of them have reported results for each PT sample whereas other 10 laboratories have participated in each round but have reported results only for plasma samples.
As the use of a specific analytical technique was not required, results were obtained by different techniques. Participant laboratories mostly chose headspace-gas chromatography with flame ionization detection (HS-GC-FID) as analytical technique (54.8%). However, an important group of laboratories (40.3%) employed enzymatic techniques and only a 4.8% of the participants used other type of analytical technique (Figure 5).
The variability between participating laboratories was estimated using the relative standard deviation obtained for the 36 PT samples included in this study ranged from 2.5% to 21.4%, with an average of 7.1%. It must be considered that RSD for 31 samples ranged between 2.5% to 12.5%, and only one sample with an assigned value quite close to the usual limit of quantification rendered RSD of 21.4% (Figure 6). When this sample is not considered the average of RSD is 6.7%.
The dispersion (RSD) of our PT is somewhat less than that obtained in previous studies performed in Italy and Belgium, whose RSD values which ranged from about 12% to 18% and 8 to 15%, respectively [20,30]. Therefore, obtained dispersion data assures a harmonization of results among participating laboratories.
Laboratories were asked to provide the measurement uncertainty associated with their results. As only a few of the PT participants reported it (approximately 13% in each round), the z-score was chosen as the way of assessing satisfactory performance in PT. Z-scores may confirm that the method of analysis applied is fit for the intended purpose [31].
(Figures 7&8) depict the percentage of satisfactory z-score obtained for blood and plasma samples, respectively. More than an 80% of participating laboratories obtained a satisfactory z-score (|z| ≤2) in more than 70% of blood samples (Figure 7). As it can be observed in (Figure 8), percentage of laboratories with satisfactory results for plasma samples are higher than 80%. However, in four PT blood samples, the percentage of laboratories with satisfactory results were lower than 80%.
(Figures 7&8) also show that the number of laboratories with z-score ≤1 shows an increasing tendency over the rounds, especially for blood samples. This tendency may indicate an improvement of laboratory performance over the PT rounds. It has also been demonstrated that ongoing participation in PT can result in improved performance [21].
Over the period studied, only a 5.2% of the reported results rendered z-score >3 and therefore considered unsatisfactory. According to the participants, these kinds of results were normally due to clerical errors such as mislabeling, transcription errors, incorrect units, and decimal point errors.
When the analytical technique used is considered, no significant differences (p>0.05) are found between the percentage of satisfactory, questionable, and unsatisfactory z-score obtained by laboratories that chose HS-GC-FID and those that used enzymatic techniques (Figures 9&10). However, HS-GC-FID must be considered the analytical technique of choice since enzymatic techniques present certain lack of specificity and are designed to analyze plasma and not total blood [30,32].
Laboratory performance should be followed over time as neither a satisfactory performance in one PT item does not necessarily imply a high level of competence nor an unsatisfactory performance result indicate lack of proficiency [20].
Only 4 laboratories obtained satisfactory results for the 36 samples analyzed (Figure 11) being one of them accredited to ISO 17025 [9]. This laboratory was selected for assessment as an expert laboratory. Accredited laboratory was preferred as reference laboratories because accreditation bodies require the performance of root cause analysis and the implementation of corrective actions for unsatisfactory PT performance [21]. Both activities increase the reliability of its results.
The assessment of the selected laboratory was performed by means of least square linear regression between laboratory results and assigned value for each of the 36 samples analyzed (Figure 12). Slope and intercept of the equation obtained were assessed by means of a t test [24].
As both t statistic calculated were lower than t critical and there was not a statistically significant difference (p>0.05) between the assigned value and the results of the assessed laboratory, it was concluded that its results are equivalent to the assigned value. Therefore, assessed laboratory will be used as an expert laboratory in future rounds.
Conclusion
The PT presented here has been realistically designed to mimic the actual casework in a forensic toxicology laboratory. As PT provider we can assure that participation in this PT is an independent way of demonstrating competence and improving the analytical work. Thanks to participation in this PT, individual laboratories may compare their results with other laboratories in the same area of expertise, identify sources of error and increase their staff expertise [11,20].
Compliance with the requirements established for PTs providers [17] and the large number of PT samples included in the study has allowed us to obtain a dispersion result that demonstrates the effectiveness of the procedures used to prepare test items and ensure harmonization among the participants and allow us to provide assigned values of ethanol in blood and plasma available for use as positive controls by laboratories. One of the long-term participants laboratories has been selected as expert laboratory for future rounds.
These findings may assist forensic scientists to establish their competence and proficiency before a court of law. In this sense, overall satisfactory long-term participation in PT schemes can be considered as a further guarantee for justice administration.
Our results show that the analytical technique is not a significant variable which influences the number of satisfactory results obtained. However, in the future, it would be necessary to study the influence of storage condition, use of reference materials and delay time before analysis.
Although, other studies have shown a possible influence of accreditation on the results, we cannot reach any conclusion as the number of accredited laboratories among the participants is quite low [21].
As PT provider we have committed ourselves to establish a SDPA based on a fit for purpose value to avoid using a consensus value that depends on the spread of the results submitted by the participants. Using a fit for purpose value will facilitate the monitoring of performance scores over successive rounds of the PT scheme and allow trend assessment [19]. Furthermore, we encourage participating laboratories to establish measurement uncertainties associated with their results. This would allow the improvement of the PT results.
References
- Prenesti E, Bagnati M, Berto S, Basile M, Vidali M (2019) Measurement Uncertainty of Ethanol Concentration in Venous Whole Blood Determined by a HS-GC-MS Method. JSM Analytic Bioanalytic Techniq 4.
- World Health Organization (2018) Legal BAC limits by country.
- European Monitoring Centre for Drugs and Drug Addiction (2021) Legal approaches to drug and driving.
- Instituto Nacional de Toxicología y Ciencias Forenses (2023) Hallazgos toxicológicos en víctimas mortales de accidentes de tráfico.
- Gullberg RG (2012) Estimating the measurement uncertainty in forensic blood ethanol analysis. J Anal Toxicol 36: 153-161.
- Zamengo L, Frison G, Tedeschi G, Frasson S, Zancanaro F, et al. (2014) Variability of blood alcohol content (BAC) determinations: The role of measurement uncertainty, significant figures, and decision rules for compliance assessment in the frame of a multiple BAC threshold law. Drug Test Anal 6: 1028-1037.
- Hwang RJ, Beltran J, Rogers C, Barlow J, Razatos G (2017) Measurement of uncertainty for blood alcohol concentration by headspace gas chromatography. Canadian Society of Forensic Science Journal 50: 114-124.
- Crozier WE, Kukucka J, Garrett BL (2020) Juror appraisals of forensic evidence: Effects of blind proficiency and cross- examination. Forensic Sci Int 315: 110433.
- International organization for standardization (2017) ISO 17025 General requirements for the competence of testing and calibration laboratories. Geneva.
- Mianes RL, Schwengber Ten Caten C (2017) Organization of proficiency schemes by testing and calibration laboratories. Accredit Qual Assur 22: 119-123.
- El Samad O, Baydoun R (2021) Proficiency tests: A tool for improvement and testing analytical performance at Gamma-Ray Spectroscopy Laboratory. Accredit Qual Assur 26: 121-127.
- Entidad Nacional de Acreditación (2021) Criterios generales para la acreditación de laboratorios de ensayo.
- Burch AM, Durose MR, Walsh SK, Tiry E (2016) Publicly Funded Forensic Crime Laboratories: Quality Assurance Practices.
- Stewart LA, Clarke M, Rovers M, Riley RD, Simmonds M, et al. (2015) Preferred Reporting Items for a Systematic Review and Meta-analysis of Individual Participant Data The PRISMA-IPD Statement Clinical Review & Education Special Communication. JAMA 313: 1657-1665.
- International organization for standardization (2015) ISO 13528 Statistical methods for use in proficiency testing by interlaboratory comparisons. Geneva.
- Morales C, Giraldo R, Torres M (2021) Boxplot fences in proficiency testing. Accredit Qual Assur 26: 193-200.
- International organization for standardization (2023) ISO 17043 Conformity Assessment-General requirements for the competence of proficiency testing providers. Geneva.
- Jotanovic A, Suljagic S (2015) Comparison of different approaches used for the interpretation and presentation of PT results. Accredit Qual Assur 20: 395-399.
- Brookman B, Mann I (eds.) (2021) Eurachem Guide: Selection, Use and Interpretation of Proficiency Testing (PT) Schemes.
- Zamengo L, Tedeschi G, Frison G, Griffoni C, Ponzin D, et al. (2019) Inter-laboratory proficiency results of blood alcohol determinations at clinical and forensic laboratories in Italy. Forensic Sci Int 295: 213-218.
- Ferreiro López-Riobóo J I (2015) Long-term (2001-2012) study of a proficiency testing scheme for textiles. Accredit Qual Assur 20: 239-245.
- Entidad Nacional de Acreditación (2008) Guía sobre la participación en programas de intercomparación (G-ENAC-14).
- Becker R, Sauer A, Bremser W (2019) Fifteen years of proficiency testing of total petrol hydrocarbon determination in soil: A story of success. Accredit Qual Assur 24: 289-296.
- Jurado JM (2017) Aplicación de Microsoft Excel a la Química Analítica: Validación de métodos analíticos.
- Penetar DM, McNeil JF, Ryan ET, Lukas SE (2008) Comparison among plasma, serum, and whole blood ethanol concentrations: Impact of storage conditions and collection tubes. J Anal Toxicol 32: 505-510.
- Vance CS, Carter CR, Carter RJ, del Valle J, Peña JR (2015) Comparison of immediate and delayed blood alcohol concentration testing. J Anal Toxicol 39: 538-544.
- Tiscione NB, Vacha RV, Alford I, Yeatman DT, Shan X (2015) Long term blood alcohol stability in forensic antemortem whole blood samples. J Anal Toxicol 39: 419-425.
- Shan X, Tiscione NB, Alford I, Yeatman DY (2011) A study of blood alcohol stability in forensic antemortem samples. Forensic Sci Int 211: 47-50.
- Visser R (2006) Interpretation of interlaboratory comparisons results to evaluate laboratory proficiency. Accredit Qual Assur 10: 521-526.
- Devleeschouwer N, Libeer C J, Martens FK, Neels H, van Damme M, et al. (2004) Blood alcohol testing: Comparison of the performance obtained with the different methods used in the Belgian external quality assessment schemes. Clin Chem Lab Med 42.
- Cordeiro F, Emons H, Robouch P (2022) Is the z score sufficient to assess participants’ performance in proficiency testing? The hidden corrective action. Accredit Qual Assur 27: 145-153.
- Moffat AC, Osselton MD, Widdop B, Watts J (2011) Clarke’s Analysis of Drugs and Poisons. Pharmaceutical Press, London.
Citation: García-Repetto R, Torres Y, Soria ML (2023) Proficiency Test for Blood Alcohol Concentration in Forensic Laboratories: Spanish Experience. Forensic Leg Investig Sci 9: 083.
Copyright: © 2023 García-Repetto R, et al. This is an open-access article distributed under the terms of the Creative Commons Attribution License, which permits unrestricted use, distribution, and reproduction in any medium, provided the original author and source are credited.